The following charts were produced by Linn Software and appear in various contexts throughout our website. Many of them were created for the ongoing Homework series and others exist to demonstrate particular RTX® extensions. You can also peruse the Linnsoft Chart-Share section featuring thousands of IRT charts shared by end-users.
| Title | Description | Created | |
|---|---|---|---|
| SampleRTX Chart (@ES#) |
SampleRTX Indicator. This chart was uploaded by Investor/RT 15.1.1 showing symbol: @ES#. |
October 13, 2021 | More |
| BarNumbers Chart |
BarNumbers Sample Chart. |
June 23, 2021 | More |
| CG DeltaPercent (ESZ0) |
Delta as a percentage of Volume. This chart was uploaded by Investor/RT 14.2.5 showing symbol: ESZ0. |
November 29, 2020 | More |
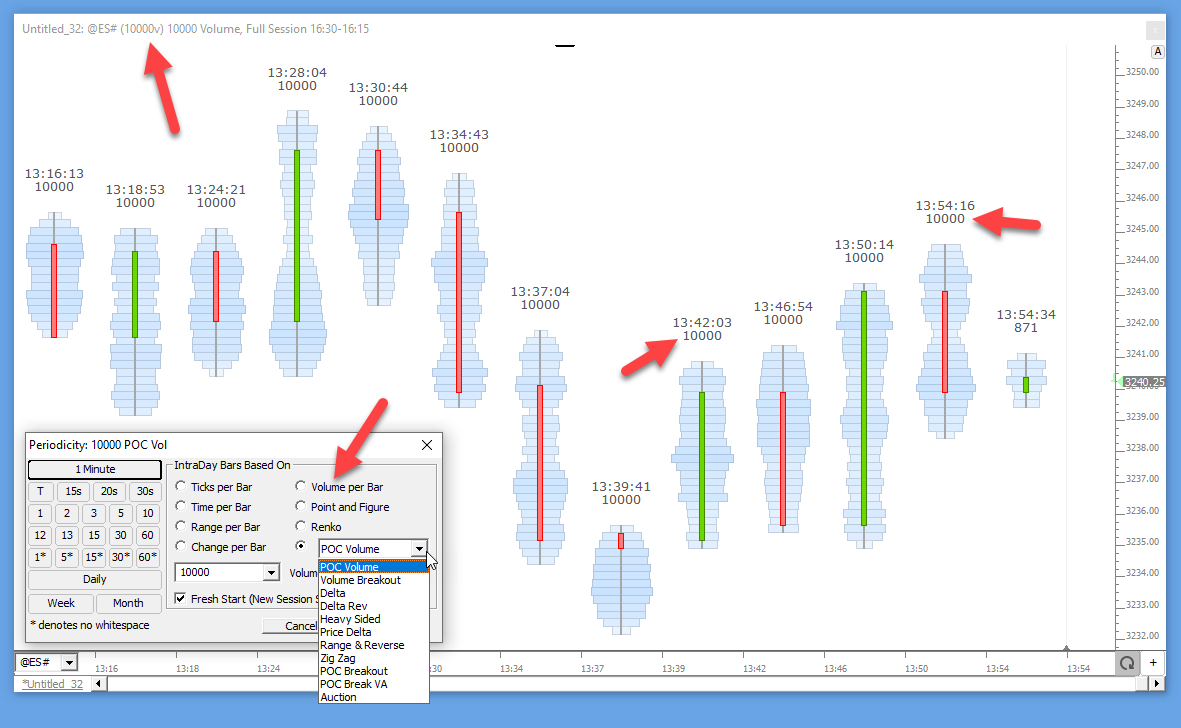
| Periodicity Options |
|
October 30, 2020 | More |
| ChandeMomentumOscillator (@ES#) |
ChandeMomentumOscillator. This chart was uploaded by Investor/RT 14.1.6 showing symbol: @ES#. |
April 24, 2020 | More |
| PaintZigZag (@ES#) |
lsPaintZigZag. This chart was uploaded by Investor/RT 14.1.5 showing symbol: @ES#. |
April 21, 2020 | More |
| HW GZF GapFill (@ES#) |
Homework - Gap Zone Fill Stats. Use buttons to provide the minimum gap required to be considered. Use 2nd button to provide the percentage of that gap that must be filled. |
February 27, 2020 | More |
| HW GF GapFill (@ES#) |
Chart measures percent of gaps that are filled with buttons to control the minimum gap (in ticks) and the percent of that gap it must fill. |
July 26, 2019 | More |
| lsLookBackCandles (@ES#) |
LookBackCandles. This chart was uploaded by Investor/RT 13.5.10 showing symbol: @ES#. |
November 13, 2018 | More |
| FlexMeters (@ES#) |
FlexMeters. This chart was uploaded by Investor/RT 13.5.9 showing symbol: @ES#. |
November 6, 2018 | More |
| lsTimeAndSales (@ES#) |
TimeAndSales (RTX) Indicator. This chart was uploaded by Investor/RT 13.2.8 showing symbol: @ES#. |
April 17, 2018 | More |
| lsTimeAndSales MultiFilter (@ES#) |
TimeAndSales - Multiple Filters. This chart was uploaded by Investor/RT 13.2.8 showing symbol: @ES#. |
April 17, 2018 | More |
| lsSlopeLines (@ES#) |
lsSlopeLines. This chart was uploaded by Investor/RT 13.1.1 showing symbol: @ES#. |
November 10, 2017 | More |
| GapStatisticsExpanded (@ES#) |
Gap Statistics Expanded - Count of gap days and how often those gaps were filled. Buttons control minimum gap, maximum gap, and number of minutes into session it must be filled. |
October 30, 2017 | More |
| VolumeScope (@ES#) |
This chart was uploaded by Investor/RT 13.1.1 showing symbol: @ES#. |
October 25, 2017 | More |
| ChartTradingSample (@ES#) |
ChartTradingDOM Sample Chart with Bollinger Bands and DOM Buttons |
October 22, 2017 | More |
| SpreadMatrix (@ES#) |
Spread Matrix. This chart was uploaded by Investor/RT 12.7.7 showing symbol: @ES#. |
August 8, 2017 | More |
| ScatterPlot (@ES#) |
Scatter Plot (RTX). This chart was uploaded by Investor/RT 12.7.6 showing symbol: @ES#. |
June 19, 2017 | More |
| lsBoundaries (@ES#) |
lsBoundaries RTX Indicator. This chart was uploaded by Investor/RT 12.7.4 showing symbol: @ES#. |
May 31, 2017 | More |
| lsColors (@ES#) |
lsColors RTX Indicator. This chart was uploaded by Investor/RT 12.7.4 showing symbol: @ES#. |
May 31, 2017 | More |
| HW OpenOutValueBackIn (@ES#) |
Homework: Opened outside value 916 of 1439 days (64%). Moved back inside value 552 of 916 days (60%). This chart was uploaded by Investor/RT 12.7.1 showing symbol: @ES#. |
April 7, 2017 | More |
| lsZones (@ES#) |
lsZones. This chart was uploaded by Investor/RT 12.7.1 showing symbol: @ES#. |
March 16, 2017 | More |
| HW OpenOutsideMoveVA (@ES#) |
Open Outside Range - Move Inside Range - Move to opposite VAH/VAL. This chart was uploaded by Investor/RT 12.7.1 showing symbol: @ES#. |
March 14, 2017 | More |
| lsAutoCorrelation (@ES#) |
lsAutoCorrelation. This chart was uploaded by Investor/RT 12.7.1 showing symbol: @ES#. |
February 7, 2017 | More |
| RTX Clock (@ES#) |
RTX Clock. This chart was uploaded by Investor/RT 12.7.1 showing symbol: @ES#. |
January 27, 2017 | More |
| TrueStrengthSqueeze (@ES#) |
TrueStrengthSqueeze (RTX). This chart was uploaded by Investor/RT 12.6.1 showing symbol: @ES#. |
August 25, 2016 | More |
| DivergenceRTX (@ES#) |
Divergence (RTX). This chart was uploaded by Investor/RT 12.6.1 showing symbol: @ES#. |
July 19, 2016 | More |
| PivotStrategyOptimizer (@ES#) |
PivotStrategyOptimizer. This chart was uploaded by Investor/RT 12.6.1 showing symbol: @ES#. |
June 2, 2016 | More |
| PaintCandles (@ES#) |
PaintCandles. This chart was uploaded by Investor/RT 12.5.9 showing symbol: @ES#. |
May 9, 2016 | More |
| PivotStrategyAnalysis (@ES#) |
PivotStrategyAnalysis. This chart was uploaded by Investor/RT 12.5.9 showing symbol: @ES#. |
April 26, 2016 | More |
| PivotStrategyAnalysis (@ES#) |
PivotStrategyAnalysis. This chart was uploaded by Investor/RT 12.5.9 showing symbol: @ES#. |
April 25, 2016 | More |
| FlexLevels Chart (RTX) |
This chart was uploaded by Investor/RT on Fri, 03/04/2016 |
March 4, 2016 | More |
| Buy Sell Meter Chart (RTX) |
The BuySellMeter extension displays the buying volume versus the selling volume for a user-specified period of time expressed as a number of days or number of bars. |
February 9, 2016 | More |
| Day Types Chart (RTX) |
The DayTypes RTX Indicator determines the developing day type throughout the session and labels each bar with the day type in effect as of that bar. |
February 9, 2016 | More |
| Paint Indicator Chart (RTX) |
The Paint Indicator ... |
February 9, 2016 | More |
| Sine Wave Chart (RTX) |
Sample Chart showing the Ehler's Sine Wave indicator in a 5 minute ES Futures chart with reference lines at 0.0 and 0.5 |
February 5, 2016 | More |
| Split Session Profiling Chart |
This chart was created to accompany the video Split Session Profiling Using Profile Indicator |
January 23, 2016 | More |
| Engulfing the Pre-30 Intraday Chart |
This intraday chart accompanies the video Engulfing the Pre-30 from the Homework, Research, and Statistics series series... |
January 12, 2016 | More |
| Engulfing the Pre-30 Daily Chart |
This daily chart accompanies the video Engulfing the Pre-30 from the Homework, Research, and Statistics series series |
January 12, 2016 | More |
| Clear Chart (RTX) |
The Clear RTX Extension is an implementation of the Clear Method, a method for determining short term swing direction and produces a color coded output line showing the current swing direction and... |
December 10, 2015 | More |
| AutoTrend Chart (RTX) |
The AutoTrend indicator connects the previous two 5-bar high fractals and previous two 5-bar low fractals to identify an up and down trend. |
December 10, 2015 | More |
| Holiday Tree Chart (RTX) |
This is a sample chart showing the Holiday Tree (RTX) indicator. Enjoy. |
December 8, 2015 | More |
| Trail of Intentions Chart (RTX) |
Trail of Intentions (TINT) is an RTX Extension designed to display historical snapshots of the depth of market. |
November 25, 2015 | More |
| Polynomial Regression Channel Chart (RTX) |
Polynomial Regression Channel (PRC) is an RTX Extension indicator that draws a best fit n-degree polynomial regression line through a recent period of data. |
November 25, 2015 | More |
| Vervoort Oscillator Chart (RTX) |
In his article "The Quest For Reliable Crossovers" (Stocks and Commodities Magazine, May 2008) author Sylvain Vervoort explains a trading method using the crosses of two moving averages: a zero-... |
November 25, 2015 | More |
| Price Volume Pattern Chart (RTX) |
Price Volume Pattern is an RTX Extension designed to identify buy and sell volume-based patterns within a sequence of one or more prices within each bar. |
November 25, 2015 | More |
| Math Lines Chart (RTX) |
The Investor/RT Math Lines Indicator is the Linn Software implementation of the popular Murrey Math Lines. |
November 25, 2015 | More |
| Chartmill Value Chart (RTX) |
The Chartmill Value Indicator(CVI) appeared in the January 2013 issue of Technical Analysis of Stocks and Commodities. The article was written by Dirk Vandycke. |
November 25, 2015 | More |
| Volume Candles Chart (RTX) |
Volume Candles overlays existing price in a chart and plots Volume at price in both a text and profile form. |
November 24, 2015 | More |
| Double Top Chart (RTX) |
Identifies Double Tops and Double Bottoms based on a user specified period. |
November 24, 2015 | More |
| Price Time Highlighter Chart (RTX) |
The Price Time Highlighter provides highly customizable highlighting of price (range) and bar(s) inside any chart pane with user specified color settings. |
November 24, 2015 | More |
| Session Prices Chart (RTX) |
Session Prices calculates common price levels of interest on up to three different sessions regardless of the session of the chart. |
November 24, 2015 | More |
| Trade Dots Chart (RTX) |
Trade Dots draws Dots at each price sized relative to the volume at that price. |
November 24, 2015 | More |
| Small IB Count |
Companion chart to Homework #3: Average Range Volume and Other Tendencies |
November 13, 2015 | More |
| Day Session IB Range Ratio |
Companion chart to Homework #6: IOAMT Webinar - May-13-2011 |
November 13, 2015 | More |
| Overnight to Day Session |
Companion chart to Homework #6: IOAMT Webinar - May-13-2011 |
November 13, 2015 | More |
| Volume Price Statistics |
Companion chart to Homework #6: IOAMT Webinar - May-13-2011 |
November 13, 2015 | More |
| Volume Breakdown Indicator Chart |
Companion chart to Homework #6: IOAMT Webinar - May-13-2011 |
November 13, 2015 | More |
| Opening Range Trade 1 Minute |
Companion chart to Homework #8: Opening Range Trade |
November 13, 2015 | More |
| Opening Range Trade Short |
Companion chart to Homework #8: Opening Range Trade |
November 13, 2015 | More |
| Opening Range Trade Long |
Companion chart to Homework #8: Opening Range Trade |
November 13, 2015 | More |
| IB Study |
Companion chart to Extracting Market Behavior Lesson 1: Initial Balance Multiple Study |
November 13, 2015 | More |
| IB Study Expanded |
Companion chart to Extracting Market Data Lesson 2: Initial Balance Multiple Study Expanded |
November 13, 2015 | More |
| IB Range Profiling |
Companion chart to Extracting Market Behavior Lesson 3: Profiles on Indicators: Initial Balance Range... |
November 12, 2015 | More |
| IB Range Filtering |
Companion chart to Extracting Market Behavior Lesson 4: Profile on Indicator: Filtering Results |
November 12, 2015 | More |
| IB Range Statistics |
Companion chart to Extracting Market Behavior Lesson 5: Profile on Indicator: Info Box Statistics |
November 12, 2015 | More |
| Price Pivot Effectiveness Intraday |
Companion chart to Homework #20: Measuring Effectiveness of Key Prices as Reversal Prices |
November 12, 2015 | More |
| Price Pivot Effectiveness Daily |
Companion chart to Homework #20: Measuring Effectiveness of Key Prices as Reversal Prices |
November 12, 2015 | More |
| Price Pivot Count Daily |
Companion chart to Homework 21: Counting Frequency of Price Crossing Key Levels |
November 12, 2015 | More |
| Price Pivot Count Intraday |
Companion chart to Homework 21: Counting Frequency of Price Crossing Key Levels |
November 12, 2015 | More |
| Filtered Distribution |
Companion chart to Homework #22 and Lesson #6 in "Extracting Market Behavior" series |
November 12, 2015 | More |
| Moving Average Ribbons Chart (RTX) | October 22, 2015 | More | |
| Equi-Indicator (EquiVolume) |
This chart shows an example of the Equi-Indicator with width based on Volume. Note, that in this example, the actual price bars of the chart have been set to Invisible. |
July 31, 2015 | More |
| Relative Cumulative Volume |
Compares the Cumulative Volume Intraday to the Average Cumulative volume of the last X number of sessions. |
June 10, 2015 | More |
| FractalProfiles |
This chart is documented in the Profiles On Indicators article. The FractalProfiles chart extracts significant highs and lows and profiles those highs and lows. |
April 2, 2015 | More |
| TimeHighLowSet |
This chart is documented in the Profiles On Indicators article. The TimeHighLowSet chart extracts the time into the session that the high and low was set/completed. |
April 2, 2015 | More |
| TimeSetRange |
This chart is documented in the Profiles On Indicators article. The TimeSetRange chart extracts the time into the session that the range was completed. |
April 2, 2015 | More |
| ZigZagStudy_Ticks |
This chart is documented in the Profiles On Indicators article. |
April 2, 2015 | More |
| Risk Reward Chart (RTX) |
This is a 1 minute chart of the S&P Emini illustrating the Risk Reward Indicator, a new indicator in Version 12. |
August 17, 2014 | More |
| SMI Ergodic Chart |
Ergodic = TSI |
August 13, 2014 | More |
| Buttons for OHLC (Session Statistics) |
This chart contains buttons that Toggle the Open, High, Low and Close of the Session. |
May 20, 2014 | More |
| Session Statistics Relative Volume |
This chart demonstrates Investor/RT's ability to compare todays current volume in Black with the past Average Volume for that exact time period over the last 20 Days. The black histogram is simply... |
May 20, 2014 | More |
| Woodies Chart |
This chart draws VWAP bands (Volume Weighted Average Price) at the VWAP +/- half the current days range. As the days progresses and the range expands, the bands expand. |
February 7, 2013 | More |
| VPOC Shift Alert |
The chart below alerts the user of pending and actual VPOC shifts. This chart is explained in the video VPOC Shift Alerts. |
February 7, 2013 | More |
| Vortex Indicator |
This chart shows the +VI (green) and -VI (red) components of the Vortex Indicator discussed in the article titled The Vortex Indicator in the January 2010 Issue of Stocks and Commodities... |
February 7, 2013 | More |
| Value Charts |
Value Chart - This chart shows the Value Chart / Value Indicator in the lower pane on a 2-minute chart of the ES with... |
February 7, 2013 | More |
| Ten Point Profile |
This 2 Rangebar chart of ES includes the Zig Zag Indicator identifying 10 point moves and labeling the delta of each move. |
February 7, 2013 | More |
| TD Sequential |
TD Sequential Chart - (Pro Required) This chart shows the TD Sequential Count above and below the bars. |
February 7, 2013 | More |
| Premier Stochastics Indicator |
After copying the Chart Definition below to your clipboard, in Investor/RT, choose "File: Import: Definition from Clipboard" from the main menu. The chart should appear. |
February 7, 2013 | More |
| Kraut Color-Based System |
This chart contains the Kraut Color-Based system for short term trading, discussed in the Trader's Tips section of the July 2011 issue of TASC magazine. Volume bars are painted as follows. |
February 7, 2013 | More |
| Katsanos Volume Flow Index |
This chart contains the Volume Flow Index (VFI) custom indicator discussed in the Trader's Tips section of the June 2004 issue of TASC magazine. |
February 7, 2013 | More |
| Ichimoku Kinko Hyo |
Ichimoku Kinko Hyo Chart Definition |
February 7, 2013 | More |
| Higher Close, Lower Volume |
Higher Close, Lower Volume - This is a daily chart of... |
February 7, 2013 | More |
| Heiken Ashi |
The Heiken-Ashi chart was discussed in the article Using the Heiken-Ashi Technique in the February 2004 issue of Stocks and Commodities Magazine (TASC). |
February 7, 2013 | More |
| Gimelfarb Bull and Bear Balance |
This chart contains the Bull and Bear Balance (BBB) custom indicator discussed in the Trader's Tips section of the October 2003 issue of TASC magazine. |
February 7, 2013 | More |
| Gap Adjusted Moving Average |
This chart plots a gap-adjusted moving average in pink. This moving average is implemented with a custom indicator and therefore requires the pro version of Investor/RT. |
February 7, 2013 | More |
| Extreme Delta |
This chart contains signal markers for buy (green) and sell (red) signals based on the delta turning positive after several down bars (buy) or turning negative after several up bars (sell). |
February 7, 2013 | More |
| Empirical Mode Decomposition |
This chart shows the EMD indicator in the lower pane. |
February 7, 2013 | More |
| DeMark Combo |
This chart shows a variation of the DeMark Combo. |
February 7, 2013 | More |
| Better TRIN |
This chart plots the Better TRIN indicator as described on the emin-watch.com web site. |
February 7, 2013 | More |