Core Indicator

FlexMeters (RTX)

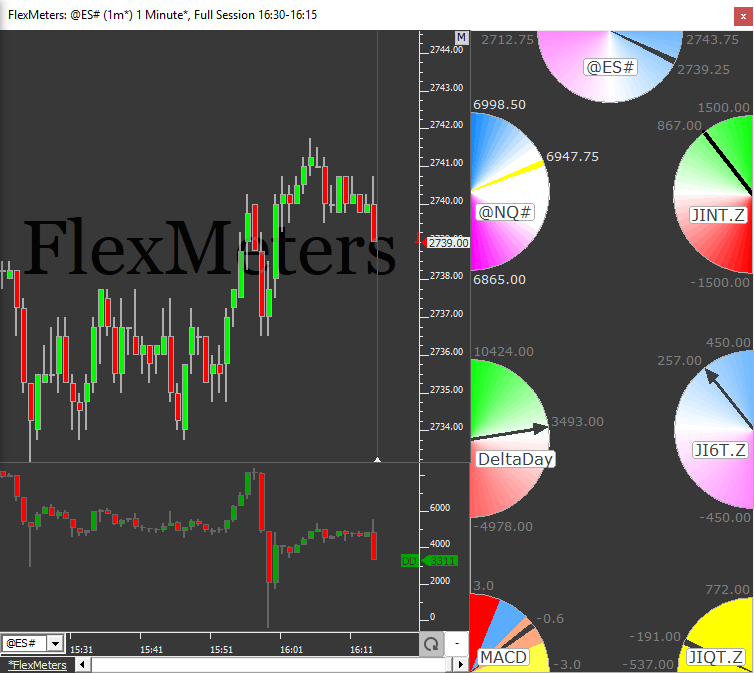
FlexMeters is an RTX extension designed to enable Investor/RT users to display customized meters of market behavior within multi-pane charts. This flexible tool draws meters showing the present value of some price or computed value as compared to a specified range of values seen in the past.  FlexMeters can be drawn using a variety of shapes, colors, positions, titles, and labelling options.  The underlying data values of a FlexMeter can be price values of the associated instrument, or values computed via an RTL custom indicator; thus there is unlimited flexibility in the kinds of market behavior gauges that be made available to the trader at a glance. The range or scale of the meter may be specified manually or it can be computed from minimum/maximum values of a recent period of trading. Even more flexibility can be gained by specifing the range using C# or V# user variables, which may be set by the user or computed by some RTL indicator elsewhere in the trader's workspace.

Custom Indicator

Adding a custom Indicator that has been created using the RTL language to a chart is done with the indicator named Custom Indicator. The setup of the charted indicator is where the name of the RTL Custom Indicator is specified, along with other settings.

A general overview of custom Indicators can be found here.

For more information about how to create RTL Custom Indicators, see this article.


TrendTool (RTX)

TrendTool is an RTX Extension for easily drawing and editing trendlines on instruments. TrendTool does not replace the long standing Trendline indicator in Investor/RT. Think of it as a companion tool that you may prefer to use sometimes. Some may use it most of the time. TrendTool was developed using the RTX development tools. As a result, TrendTool trend lines can be edited using convenient keyboard shortcuts and mouse actions.

CustomCandles (RTX)

The CustomCandles RTX Extension is designed to create candles or bars for indicators and takes four custom indicators that supply the open, close, high and low prices of the indicator.

PeriodCandles (RTX)

The PeriodCandles RTX Extension is designed to overlay candles of a higher periodicity over shorter periodicity bars or candles.

OrderFlowMetrics (RTX)

The OrderFlowMetrics RTX Extension is a companion indicator to the DOM and provides a single column of data that can reflect change in size, size, volume, or delta over a user-specified period.

GapRunner (RTX)

The GapRunner RTX Extension is designed to identify gaps between bars and between sessions and extend those gaps until price returns to fill them.

Brackets (RTX)

The Brackets RTX Extension is designed to clearly box and identify the price action within each time-based period (bracket) with options to label, color, and extend the brackets horizontally and vertically.

ExportData (RTX)

The Export Data RTX Extension is designed to Exports Dynamic Data periodically to a csv file using an Input template.

Pages