Together with the Custom Indicator, an RTL Signal Formula is one of the key building blocks of Investor/RT
A Signal is an RTL formula (such as CLOSE > MA) testing the value of each bar of data for a true/false condition. When it comes to knowing more about writing simple RTL Signal formula, please refer to the RTL 101 section of the knowledge base, which offers:
-
a global presentation of the RTL language, of its main syntax rules, which involve different components (historical or primitive tokens, functions and variables)
-
a global overview of the use of RTL signal formula throughout the software (as dynamic input for other technical indicators, for trading systems developments, etc)
This page focuses on the Signal Marker, i.e., the native Technical Indicator of Investor/RT, which was developed to display the historical true/false values for a given RTL Signal formula on a chart.
In addition to the Signal marker itself, there are multiple indicators designed solely to visualize the historical true/false values of an RTL signal formula. Instead of displaying a marker, you can indeed paint candles, the chart background, color histograms or dotted lines, etc. These indicators include the Color Marker indicator, Paint Bar indicator, PaintCandles RTX, PaintIndicator RTX and more.
Presentation
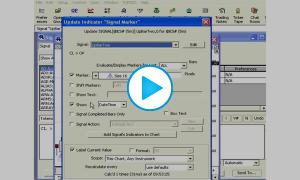
The Signal Marker indicator tests a user-specified RTL signal formula to determine its true/false status using the chart's periodic data. This indicator has 2 main purposes:
1 ) display a specific marker on all of the bars for which the signal is true.
The preference tab reviews all the settings associated with this marker selection: the marker shape, its size and colors, its position (above/below the bar etc), the text label display, and a few more settings.
2) Trigger a "Signal Action" under a real-time datafeed environment, i.e. a sequence of user-defined actions, as detailed on the dedicated "Signal Action setup" webpage
What is important to highlight is that a Signal Action is a generic Investor/RT Object that is fully independent of the Signal marker indicator and can be created or edited in the Object Manager Window. It offers the ability to trigger a wide range of actions, from very basic ones (such as playing a sound or displaying an alert message) to much more complex ones, such as triggering a trade order, maintaining an event log, or any other I/RT tasks that could be programmed through a chart button, a schedule or keyboard shortcuts.
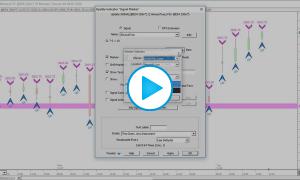
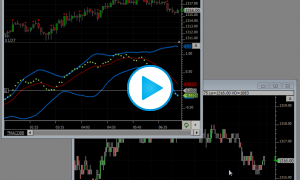
In the chart below, 2 signal markers (green and pink "laser" arrows) are highlighting pivot high and low bars (for a given zigzag line setup), while showing, as label display, the value of the custom indicator (displayed in the pane below) which returns the wave count based on a HH / LL definition of a trend (DOW theory).

Important concept: "Intra-bar" Signal versus "End of bar" Signal
When charting daily or intra-day, the signal is re-evaluated according to the "Recalculate Every xx" settings (which may be as fast as once every incoming tick). However, this setting is not the one determining how a given Signal formula should be considered an Intra-bar or End of bar signal.
The Signal marker includes a very important checkbox titled "Signal completed bars only", which will decide when the signal action can be triggered, i.e., ie at any time during the bar, whenever an intermediate calculation of the signal returns true, or just at the completion of the bar (assuming that this end-of-bar calculation returns a true value)
This critical decision is always deeply linked to the type of formula syntax used inside the RTL signal, ie.:
-
With a formula such as CLOSE < MA, the "Signal completed bars only" box is typically checked as the user expects to be alerted only once, when the formula definitely returns a true Signal. This can only be confirmed at the completion of the bar, when both the final values of the MA and CL tokens are known
-
With a formula detecting if a new session High is being made during the current bar (with a syntax such as HI > SESST_DayHI.1), this box is usually not checked as the user typically wants to be alerted as soon as a new daily high is formed. (if unchecked, the alert would trigger only when the bar is completed)
As the SESST_DayHI.1 value (ie the Highest High of any bar reached up to the previous bar) is fixed during the whole duration of the ongoing bar, and as the HI value of the bar can only go up, there is zero risk of getting a "false" signal. When turning true (i.e., whenever a new trade breaks the current daily High), that signal can't turn false again during the remaining duration of the bar.