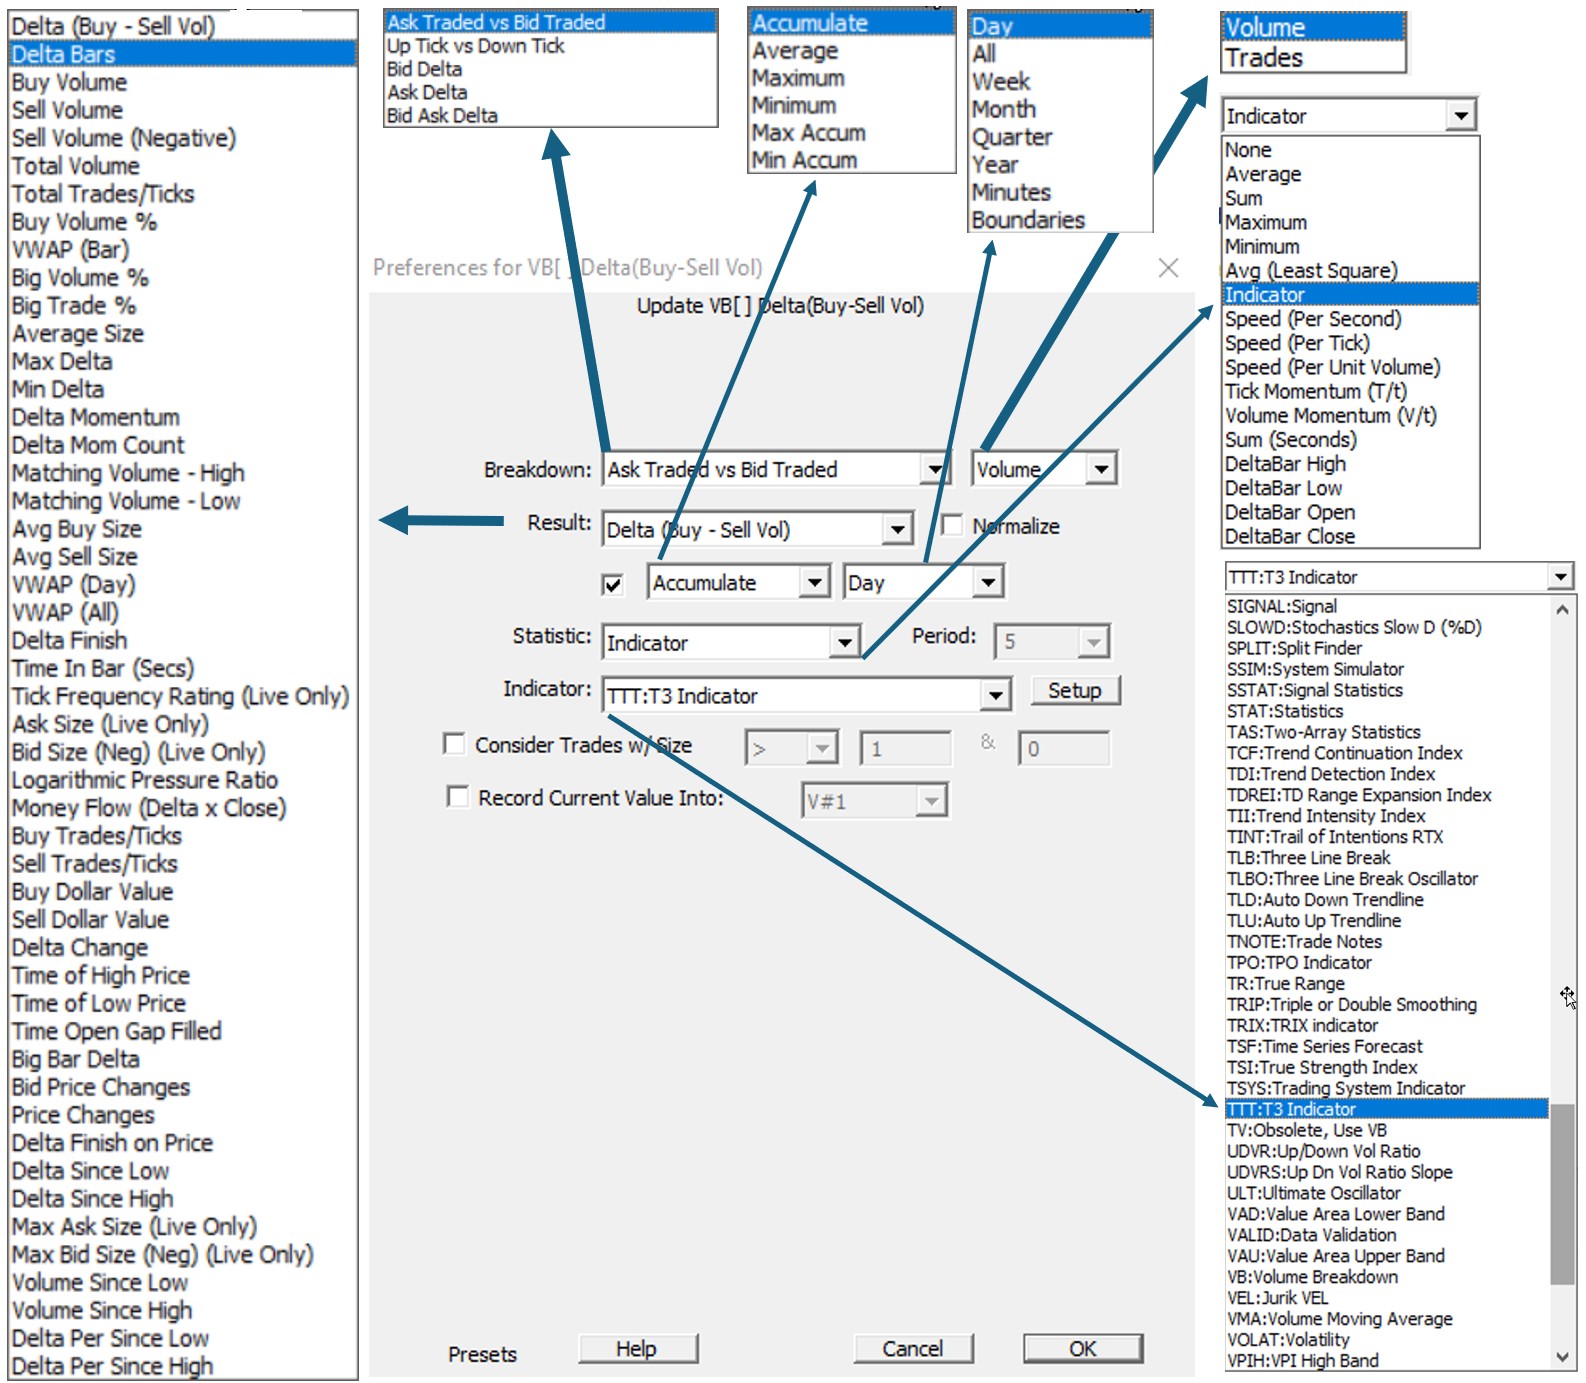
Note: Three other advanced breakdown options (Bid Delta, Ask Delta, and Bid Ask Delta) are designed to help traders identify the levels of refreshed bids and offers. Check the Related Tab for more information on these options.
-
Delta (Buy - Sell Vol) - difference between the buy volume and the sell volume.
-
Delta Bars - same as "Delta", except drawn in a candle bar format.
-
Buy Volume - Volume that traded at or above the ask.
-
Sell Volume - Volume that traded at or below the bid.
-
Sell Volume (Negative) - Volume that traded at or below the bid, expressed as a negative value. This option is there so that Buy Volume and Sell Volume histograms may be added to the same pane, but drawn on different sides of the zero line.
-
Total Volume - Total volume traded.
-
Total Trades/Ticks - Total number of trades or ticks.
-
Buy Volume % - Percent of volume within each bar which was classified as Buy Volume.
-
VWAP (Bar) - Volume weighted average price of each bar. Each tick is weighted by it's volume to produce a weighted average price of all ticks within each bar.
-
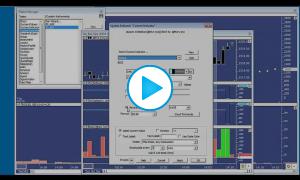
Big Volume % - Percent of volume within each bar which was classified as "Big Volume". "Big Volume" is defined as any trade with a size greater than a size specified to the right of the "Consider Only Trades With Volume" checkbox. That Volume Box will be editable whenever "Big Volume %" or "Big Trade %" results are selected.
-
Big Trade % - Percent of Trades within each bar which was classified as "Big Volume". This result simply deals with the number of trades, as opposed to the size of those trades.
-
Average Size - Average size of the trades which occurred within any given bar.
-
Max Delta - The maximum delta value achieved within each bar. This is equivalent to the high seen for each deltabar.
-
Min Delta - The minimum delta value achieved within each bar. This is equivalent to the low seen for each deltabar.
-
Delta Momentum - Delta Momentum essentially sums up the delta values while the per bar delta remains on the same side of the zero line. When delta turns from positive to negative, the result will reset to that negative values, and the result will continue to accumulate while the deltas remain negative. When delta becomes positive, the result will reset back to that positive value, and accumulate from there while delta remains positive.
-
Delta Mom Count - Delta Mom Count works in the same way, except it simply counts how many bars delta has remained positive or negative consecutively. A value of -5 means we've had 5 consecutive negative delta bars.
-
Matching Volume - High - Amount of volume that traded on both sides (buy and sell volume) at the high of the bar. In general, at the high of the bar, most (if not all) volume will trade at the ask (buy volume).
-
Matching Volume - Low - Amount of volume that traded on both sides (buy and sell volume) at the low of the bar. In general, at the low of the bar, most (if not all) volume will trade at the bid (sell volume).
-
Avg Buy Size - Average size of all trades that came in on the buy/ask side.
-
Avg Sell Size - Average size of all trades that came in on the sell/bid side.
-
VWAP(Day) Volume Weighted Average Price of all ticks accumulated throughout each session.
-
VWAP(All) - Volume Weighted Average Price of all tick accumulated throughout the entire view period of the chart.
-
Delta Finish - This is the pullback of delta from its last high or low. If Delta last bounced off its high before completing the bar, the finish will be negative (or zero). If Delta last bounced off its low before completing the bar, the finish will be positive (or zero).
-
Time in Bar (Secs) - Amount of time, in seconds, spent in each bar. Especially useful for tick-based periodicities, such as tick bars, volume bars, range bars, PNF, Renko, etc.
-
Logarithmic Pressure Ratio - LOGe (Buy Volume / Sell Volume). Commonly, a moving average is applied to this result.
-
Money Flow (Delta x Close) - Delta of the bar multiplied by the closing price of the bar.
-
Buy Trades/Ticks - Number of trades that occurred at or above the ask.
-
Sell Trades/Ticks - Number of trades that occurred at or below the bid.
-
Buy Dollar Value - A summation of the Close x Volume of each buy tick within the bar.
-
Sell Dollar Value - A summation of the Close x Volume of each sell tick within the bar.
-
Delta Change - Change in the delta from the current bar. In other words, current bars delta minus previous bars delta. This is a good indication of the direction of delta.
-
Time of High price - Returns the time in a hh.mmss format the time of the High of the Bar
-
Time of Low price - Returns the time in a hh.mmss format the time of the Low of the Bar
-
Big Bar Delta - This result accumulates the buying volume and selling volume of each 1 second period. It also accepts a volume filter which is placed in the "Consider Trades With Volume" field. If the buy volume of any given second exceeds the volume filter supplied, it is accumulated into the buying volume of the bar. If the sell volume of any second exceeds the filter, it is accumulated into the bar's sell volume. The result for each bar is the accumulated buy volume minus the accumulated sell volume. This result essentially applies a filter, not on every trade, but on an accumulation of the trades within each 1 second period.
-
Bid Price Changes - This result counts how many times the bid price changed within each bar.
-
Delta Since High also referred to as "COT High"- This delta value is resulting from the accumulation of every transaction since a new high of the price bar was achieved. Any time the price bar makes a new high, the "COT High" delta resets to zero and builds from there.
-
Delta Since Low, also referred to as "COT Low"- This delta value results from the accumulation of every transaction since a new low of the price bar was achieved. Any time the price bar makes a new low, the "COT Low" delta resets to zero and builds from there.
-
Delta Finish on Price, also referred to as "COT High/Low"- Any time the price bar makes a new low or a new high, the delta resets to zero and builds from there. Please note that this naming convention (COT or Commitment of Trader) adopted by the "orderflow" community for this notion has nothing to do with the weekly COT reports issued by the CFTC or other exchanges. It is just a valuable metric to assess the strength (i.e., commitment) of the participants contributing to that cumulative delta value since an extreme price level.
-
Volume Since High - Also referred to as "COT High volume", this result returns the volume accumulated delta since a new high of the price bar was achieved. Any time the price bar makes a new high, the value resets to zero and builds from there.
-
Volume Since Low - Also referred to as "COT Low volume", this result returns the volume accumulated delta since a new low of the price bar was achieved. Any time the price bar makes a new low, the value resets to zero and builds from there.
-
Delta Per Since High - Delta % since High (also referred to as COT High %) is based on the ratio between the "COT High" and the "Volume since High". Any time the price bar makes a new high, the value resets to zero and builds from there.
-
Delta Per Since Low - Delta % since Low (also referred to as COT Low %) is based on the ratio between the "COT Low" and the "Volume since Low". Any time the price bar makes a new low, the value resets to zero and builds from there.
-
Tick Frequency Rating (Live) - The "Tick Frequency Rating" option provides a measure of trade frequency, combined with tick direction (buying or selling). This rating will plot on a scale from 1 to 100+ (or -1 to -100+). A value of 1 signifies that the tick came in over 5 seconds from the previous tick. A value of 100 signifies that a tick came in right on top of the previous tick (essentially at the same millisecond). Values above 100 indicate that multiple ticks continued to arrive on top of one another. Values in between 0 and 100 are plotted with a reverse logarithmic scale. In essence, the higher the values, the faster the frequency of ticks. In addition, these values are plotted as positive values on buy ticks are up ticks and as negative values on sell ticks or down ticks (depending on how VB is set up). This result only works in real-time, and therefore will begin forming from the time the chart containing it is opened, or from the time it's added to a chart. It also works best in on 1 tick charts. When viewed at other periodicities, it sums the values of all ticks within the bar.
-
Ask Size (Live Only) - Plots the ask size at the time of each tick or trade. These values only plot live (the VB will be blank when initially opening the chart and build from there). The ask size plots as a positive value.
-
Bid Size (Neg) (Live Only) - Plots the bid size at the time of each tick or trade. These values only plot live (the VB will be blank when initially opening the chart and build from there). The bid size is negative and plots nicely in a pane along w/ Ask Size.
-
Max Ask Size and Max Bid Size (Neg) (Live Only) - These results will get the maximum bid or ask size achieved within each bar. These options can be especially useful for an Auction (or 1 tick range) periodicity in which all ask trading occurred at the upper price and all bid trading occurred at the lower price. The Max Bid Size is presented as a negative number so it can be combined within the same pane with the positive Max Ask Size.
Note : Very often, Volume breakdown information will be used inside custom indicators written in the RTL language, thanks to the VB RTL token