VMA Percent (@ES#)
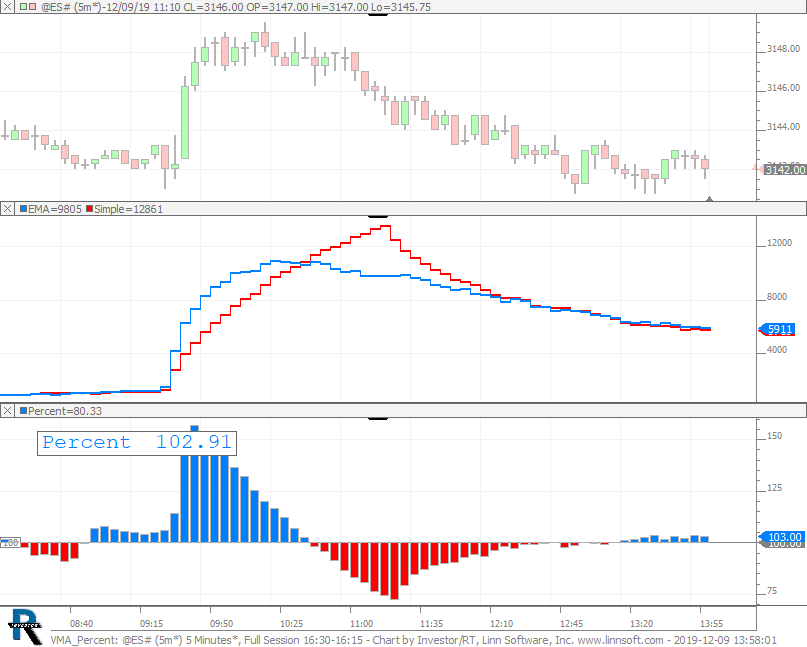
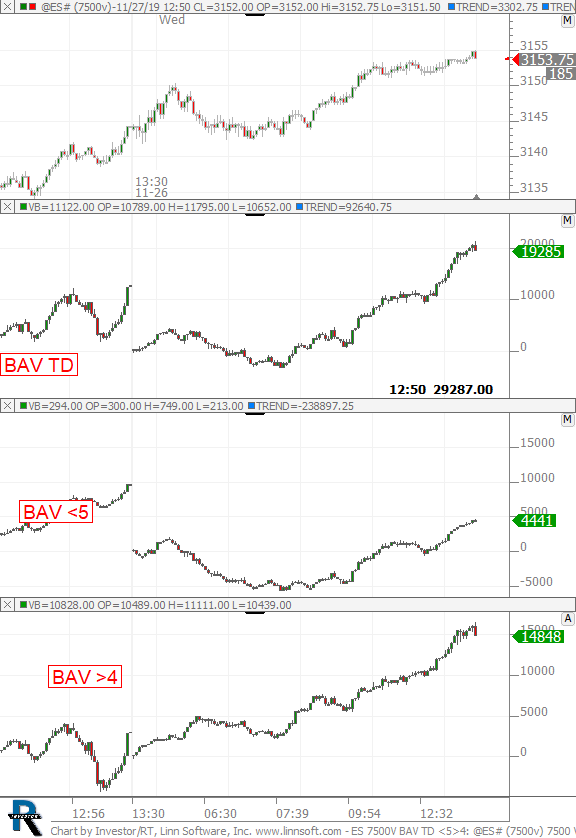
Percent of Exp VMA vs Simple VMA. This chart was uploaded by Investor/RT 14.1.5 showing symbol: @ES#.
Percent of Exp VMA vs Simple VMA. This chart was uploaded by Investor/RT 14.1.5 showing symbol: @ES#.
delta gaps. This chart was uploaded by Investor/RT 13.6.4 showing symbol: @ES#.
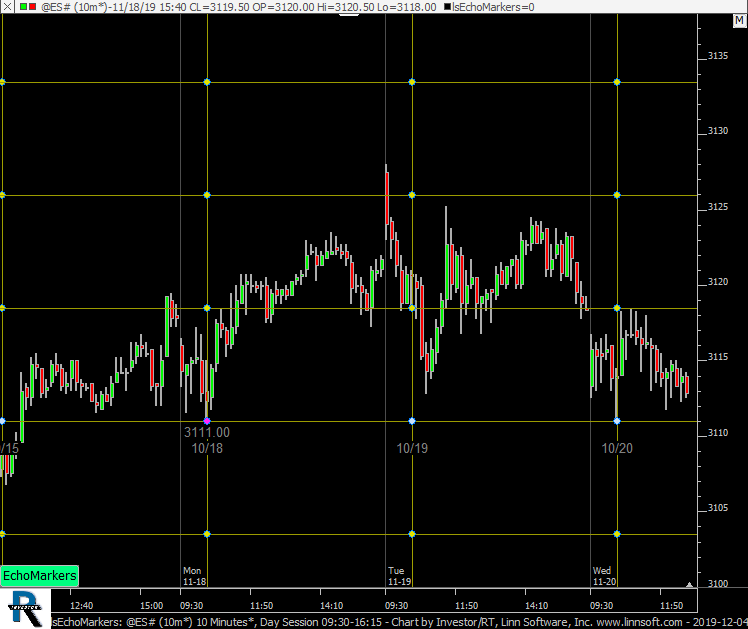
EchoMarkers (RTX). This chart was uploaded by Investor/RT 14.1.5 showing symbol: @ES#.
This chart was uploaded by Investor/RT 14.1.5 showing symbol: @ES#.
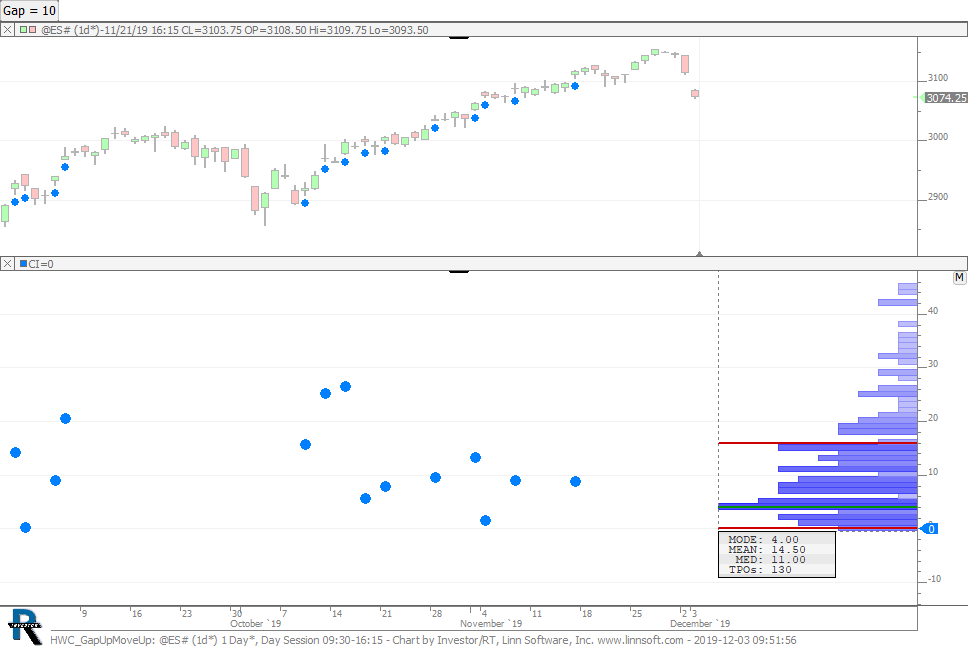
Identifies 10 point gaps up (adjust with button) and then plots the max move made durign the following session on days where there was a gap up. Profile profiles all those moves up on gap up days and gives the mode, mean, and median. This chart was uploaded by Investor/RT 14.1.5 showing symbol: @ES#.
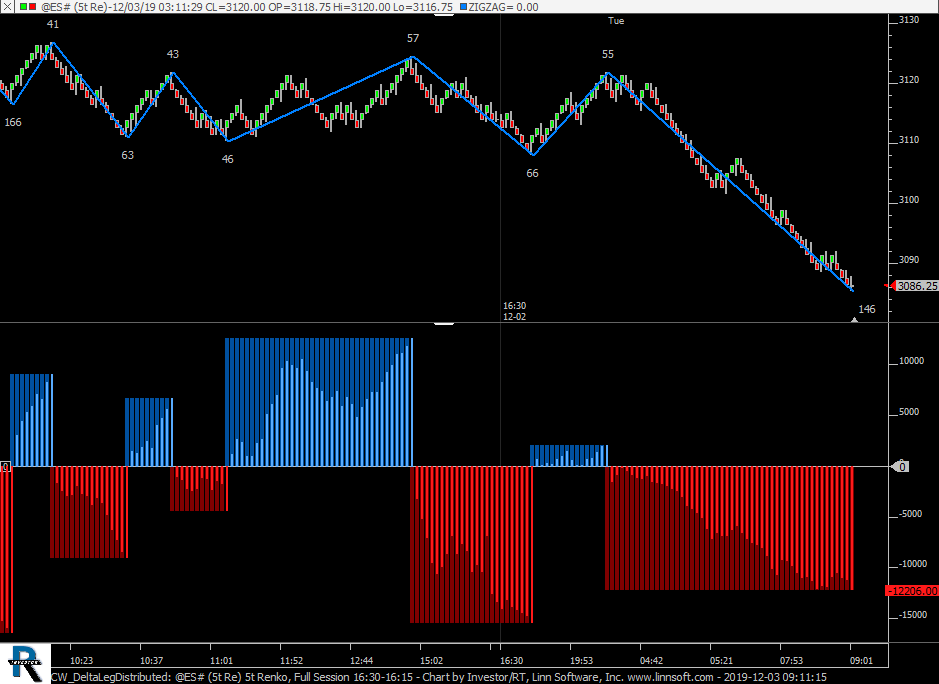
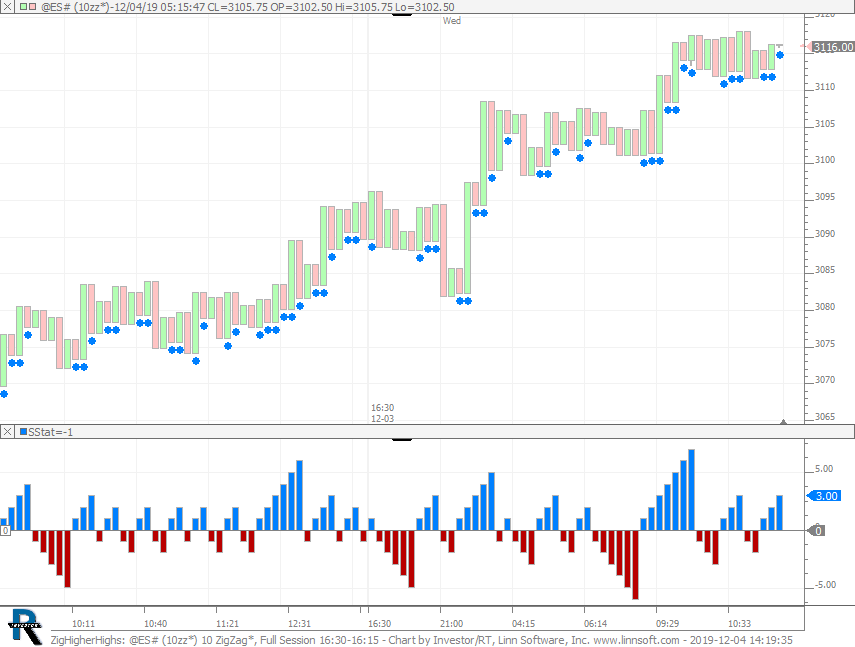
Delta of each leg is spread out over all the bars of the leg (in addition to showing the developing delta of the leg). This chart was uploaded by Investor/RT 14.1.5 showing symbol: @ES#.
delta sub seltas. This chart was uploaded by Investor/RT 13.6.4 showing symbol: @ES#.
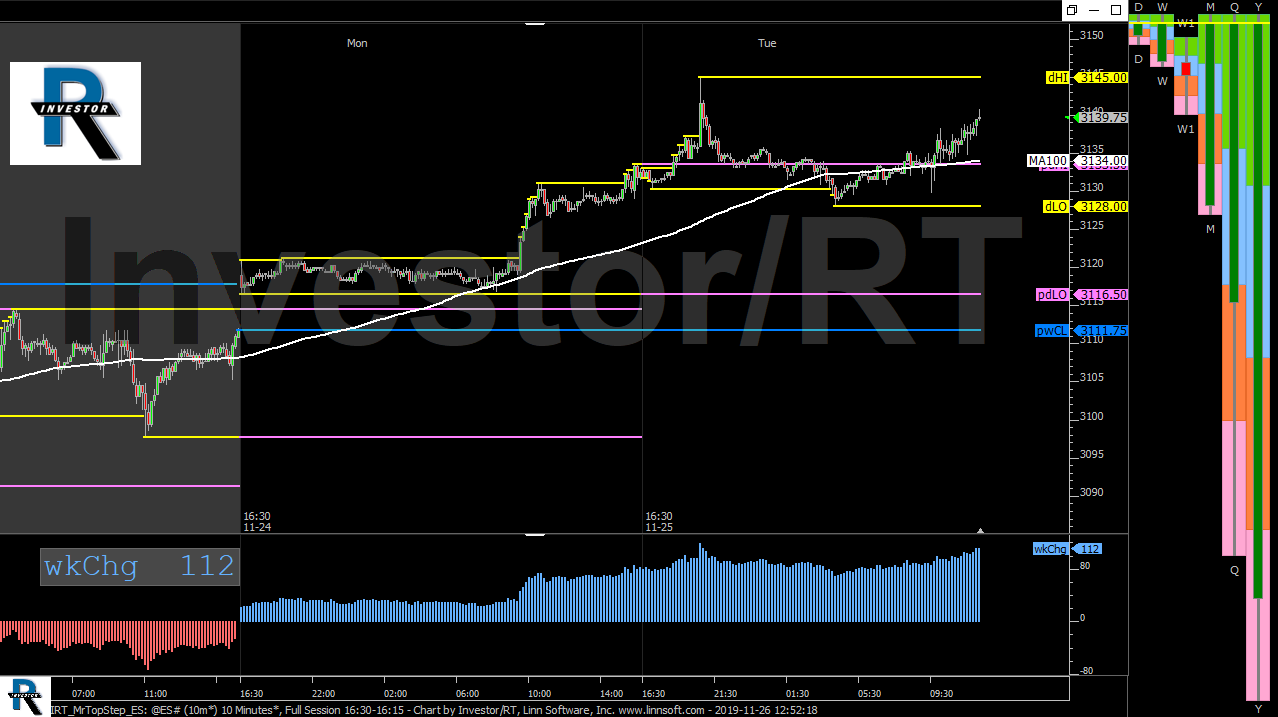
This Investor/RT chart of the ES is a 10 minute chart showing with previous Friday highlighted in gray. The yellow lines show the developing high and low while the pink lines show previous session high and low. The blue line marks the previous session c. This chart was uploaded by Investor/RT 14.1.3 showing symbol: @ES#.
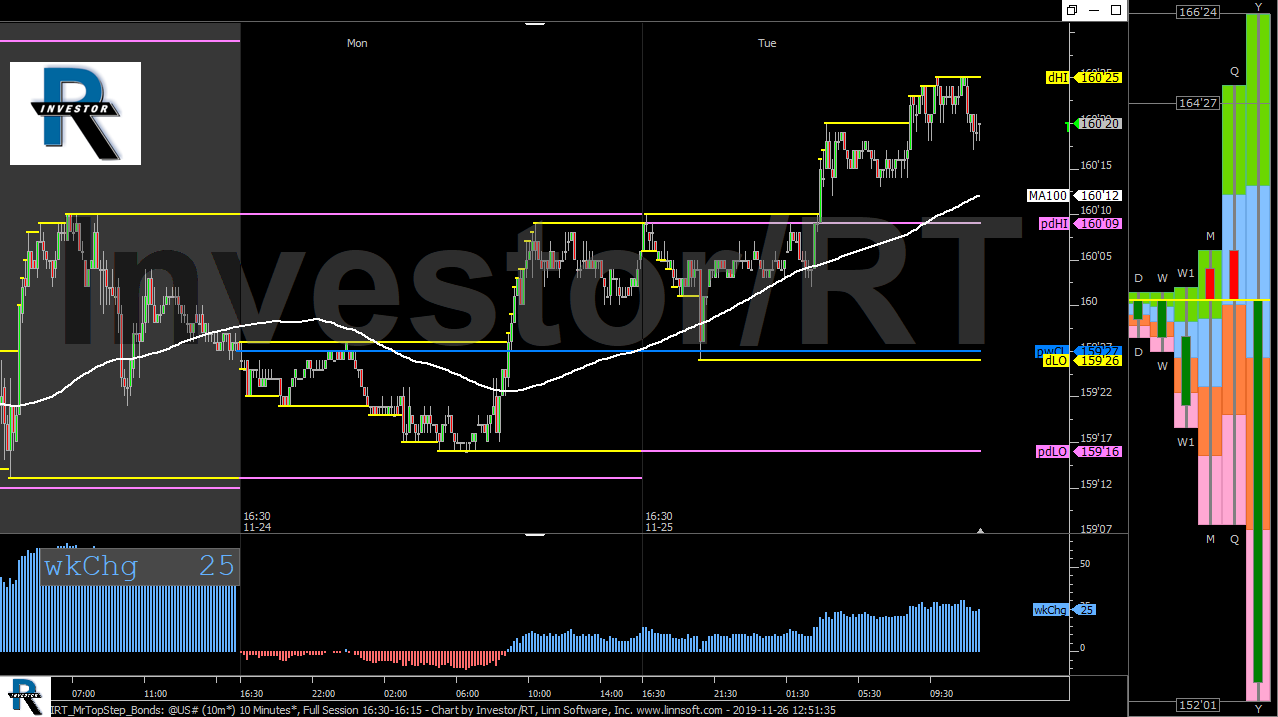
This Investor/RT chart of the Bonds is a 10 minute chart showing with previous Friday highlighted in gray. The yellow lines show the developing high and low while the pink lines show previous session high and low. The blue line marks the previous session c. This chart was uploaded by Investor/RT 14.1.3 showing symbol: @US#.
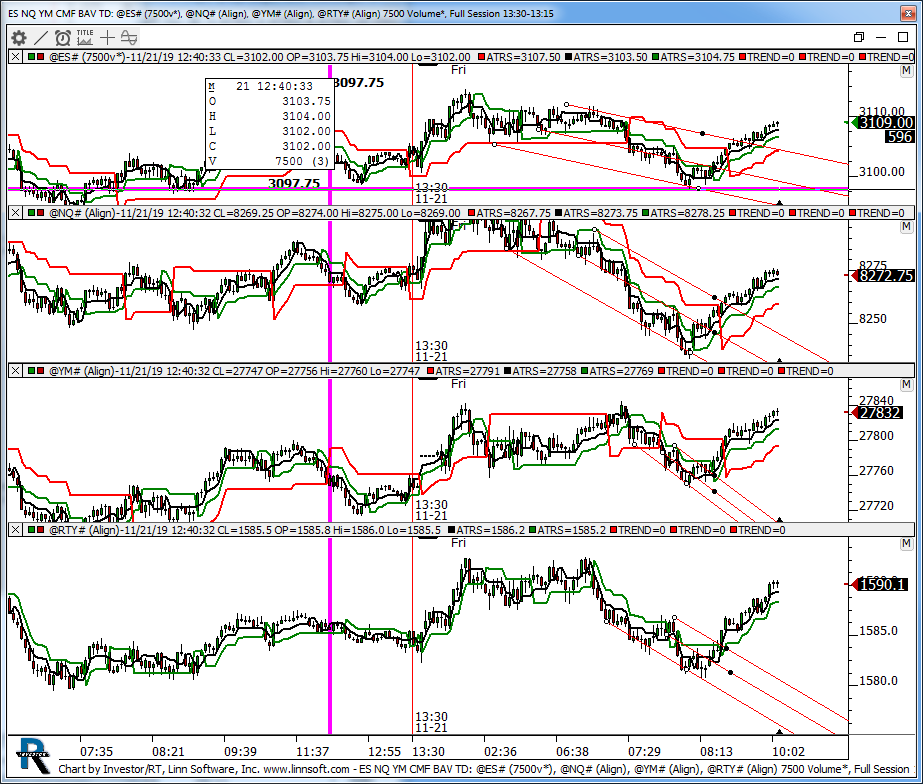
indexes. This chart was uploaded by Investor/RT 13.6.3 showing symbol: @ES#.