ES Candles Noir (ESH7)
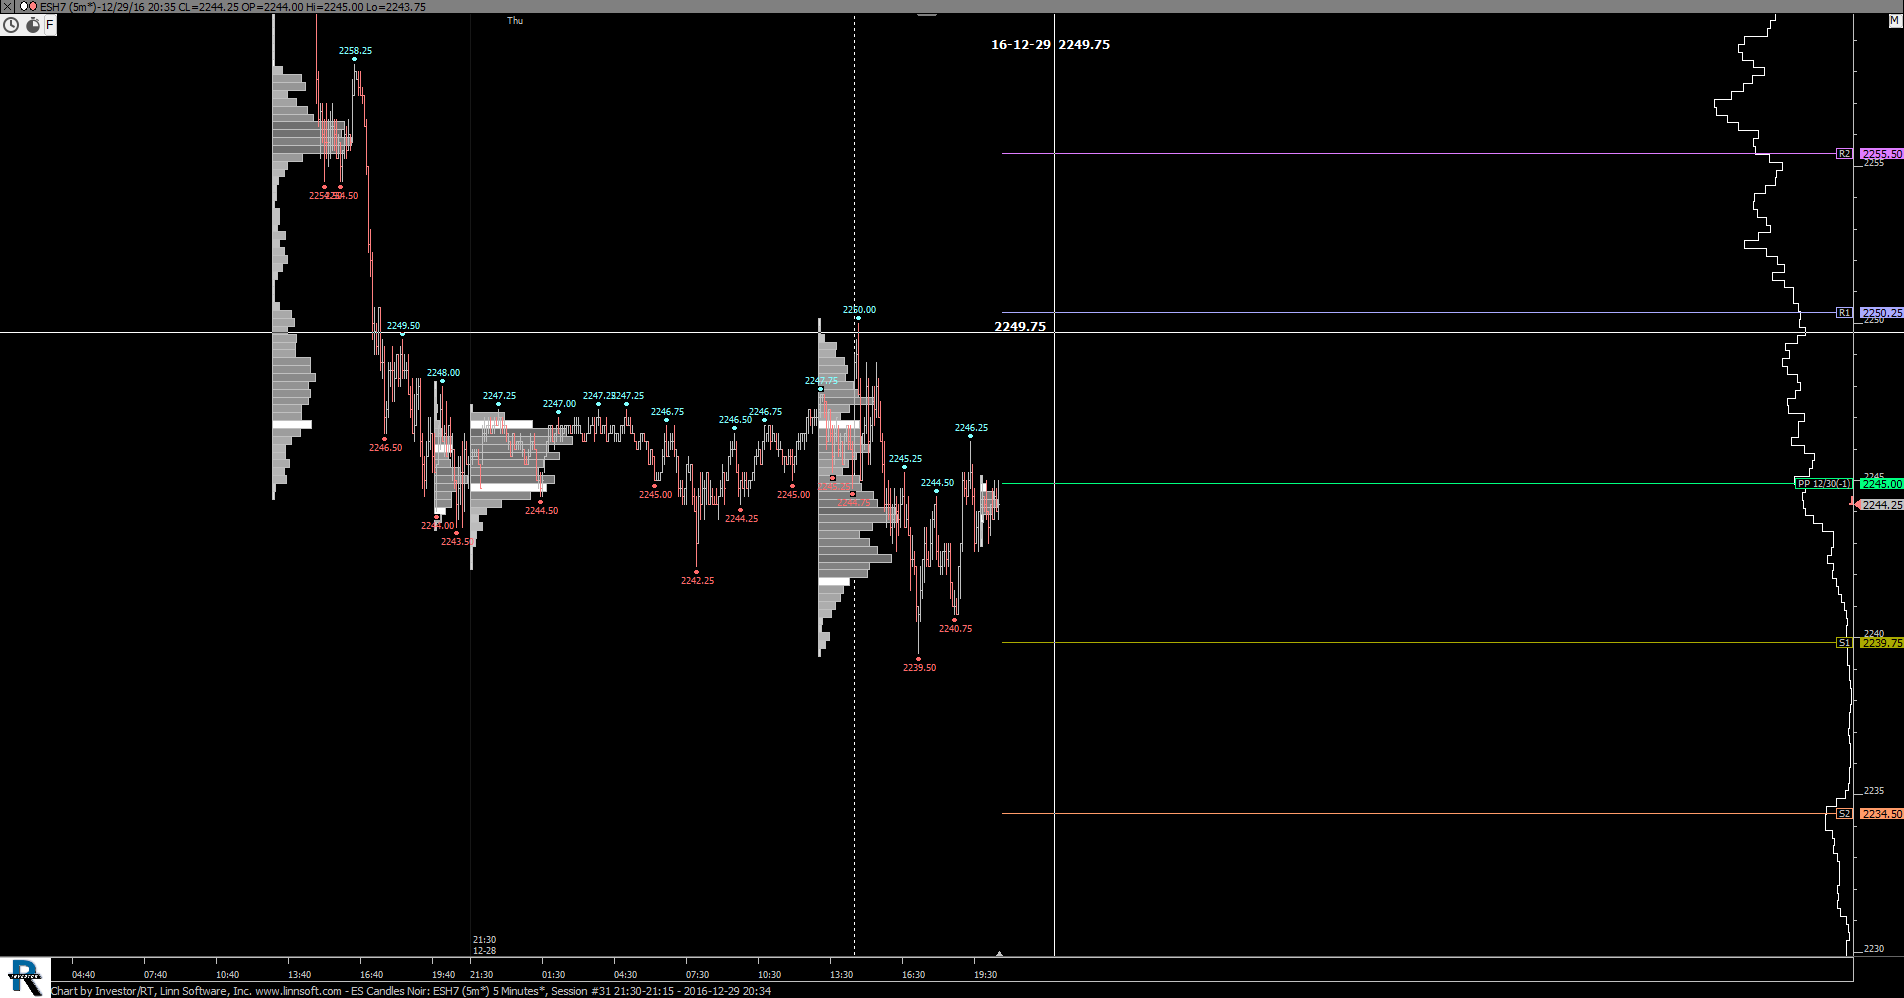
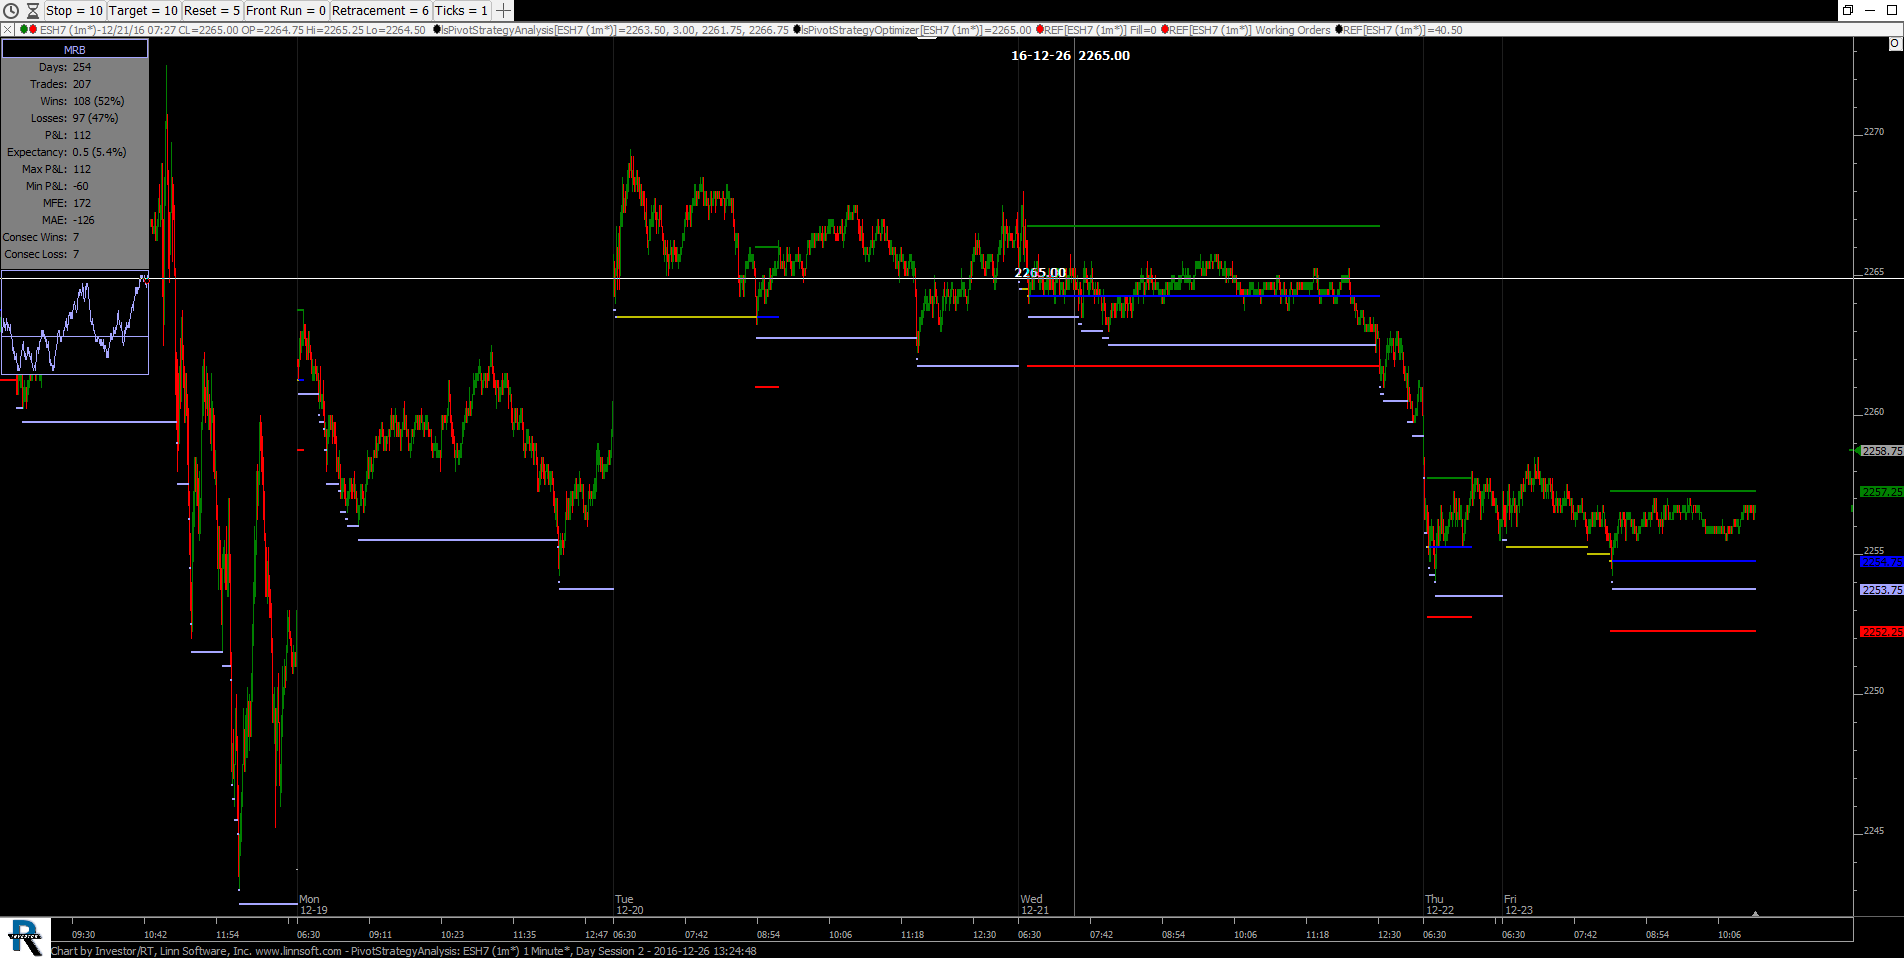
DTG Candles Noir. This chart was uploaded by Investor/RT 12.7.1 showing symbol: ESH7.
DTG Candles Noir. This chart was uploaded by Investor/RT 12.7.1 showing symbol: ESH7.
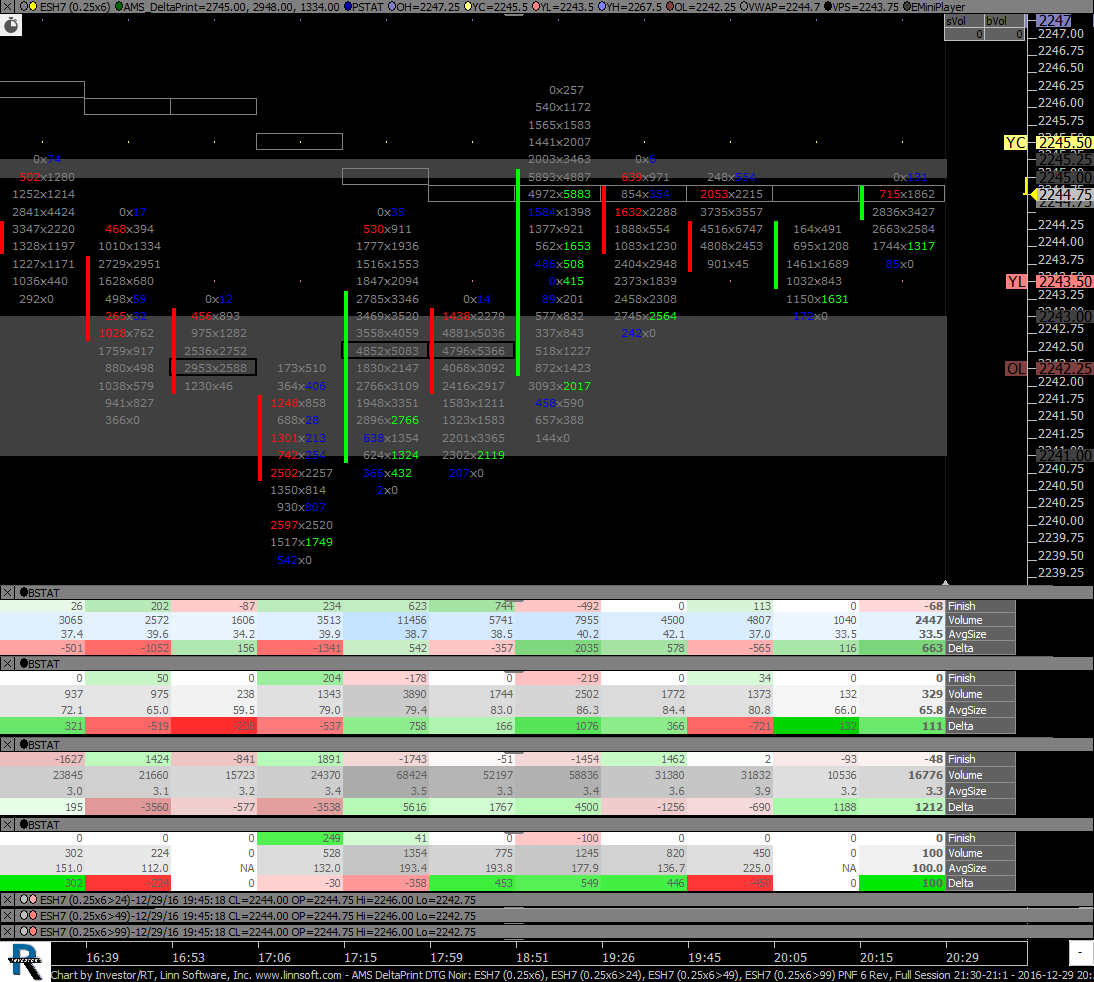
AMS DP Size. This chart was uploaded by Investor/RT 12.7.1 showing symbol: ESH7.
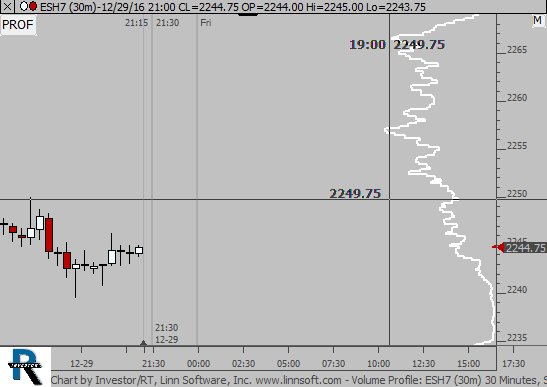
VP LONG. This chart was uploaded by Investor/RT 12.7.1 showing symbol: ESH7.
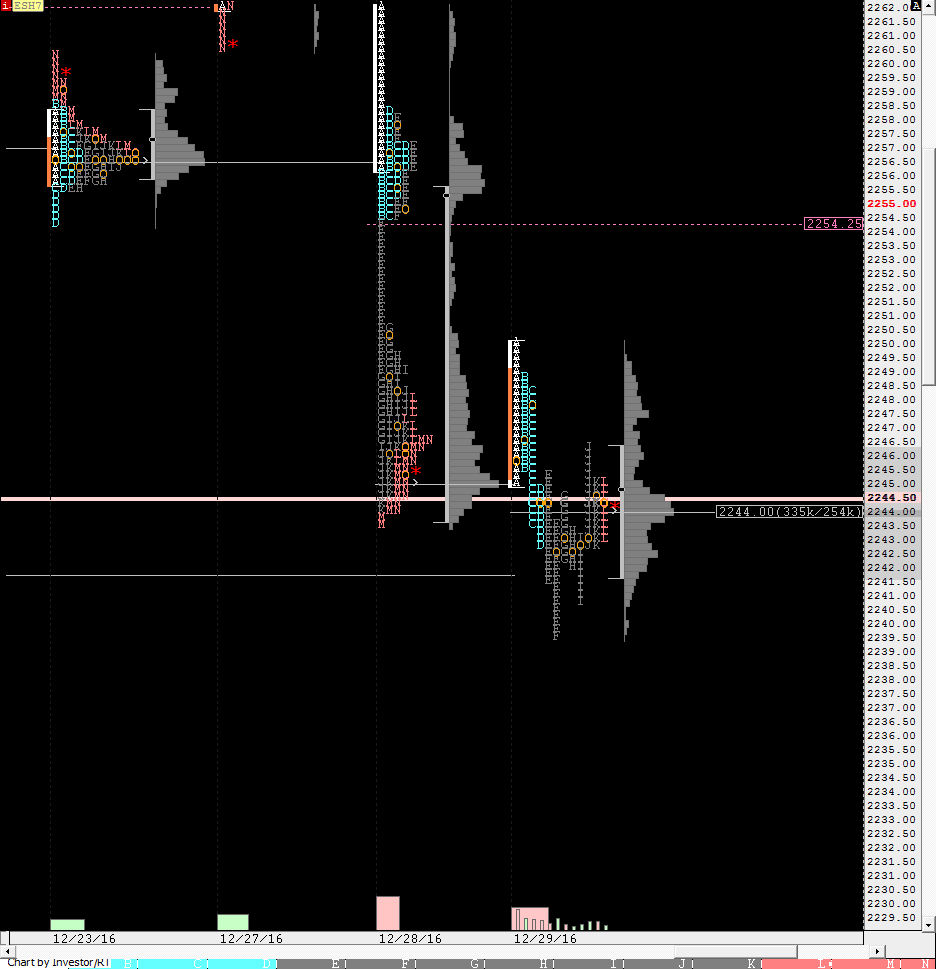
ES MP NOIR. This chart was uploaded by Investor/RT 12.7.1 showing symbol: ESH7.
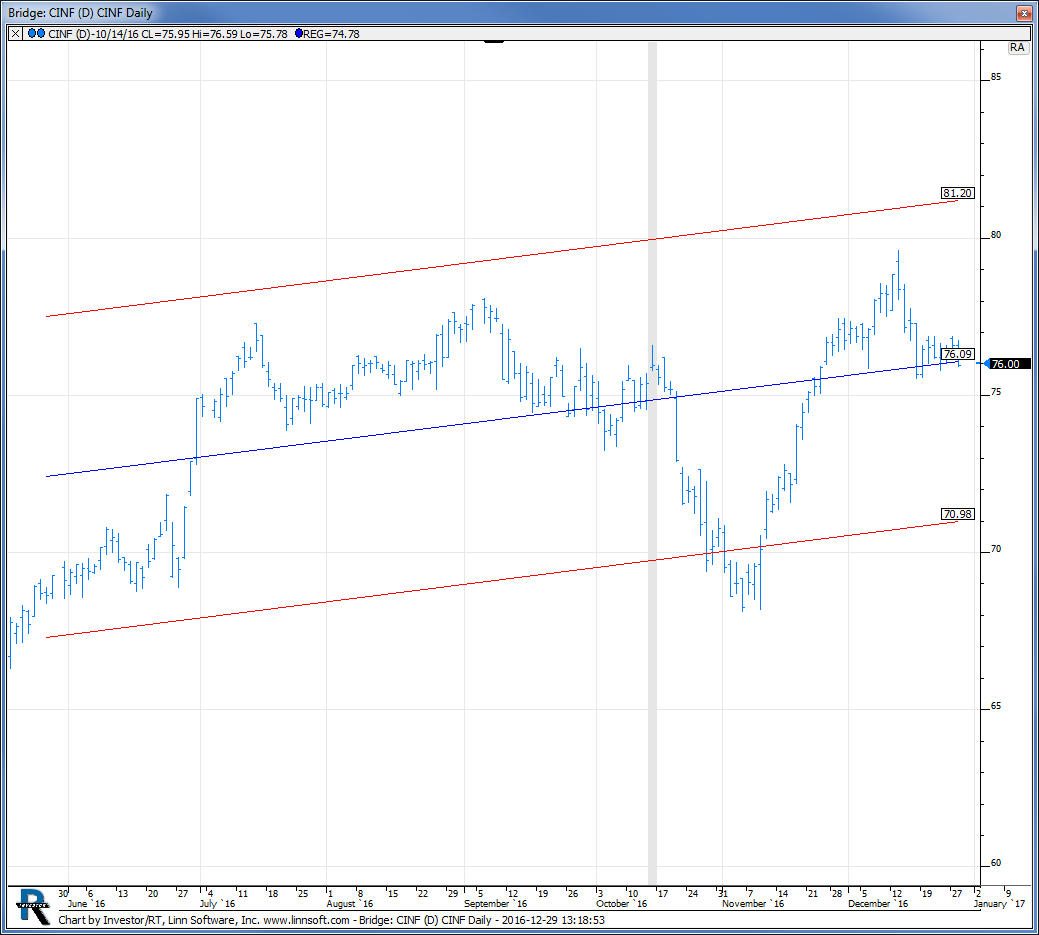
This chart was uploaded by Investor/RT 12.6.8 showing symbol: CINF.
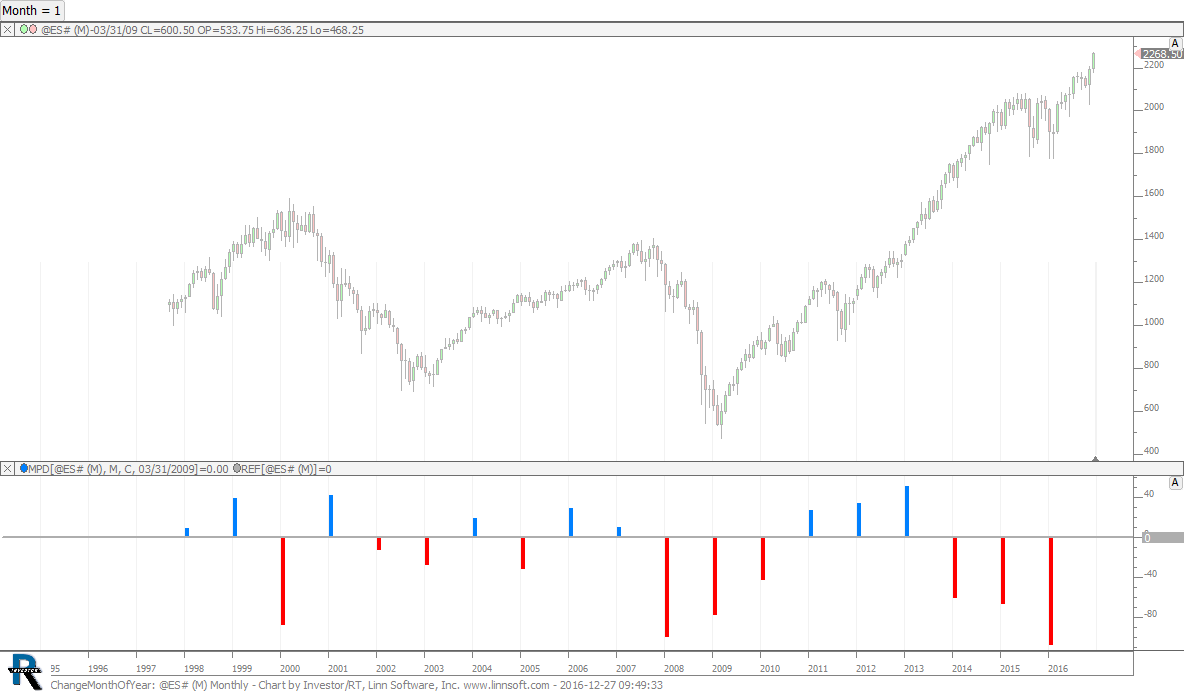
Change by Month. Use button at top to choose the month (1 for Jan, 2 for Feb, etc). This chart was uploaded by Investor/RT 12.7.1 showing symbol: @ES#.
This chart was uploaded by Investor/RT 12.6.8 showing symbol: ESH7.
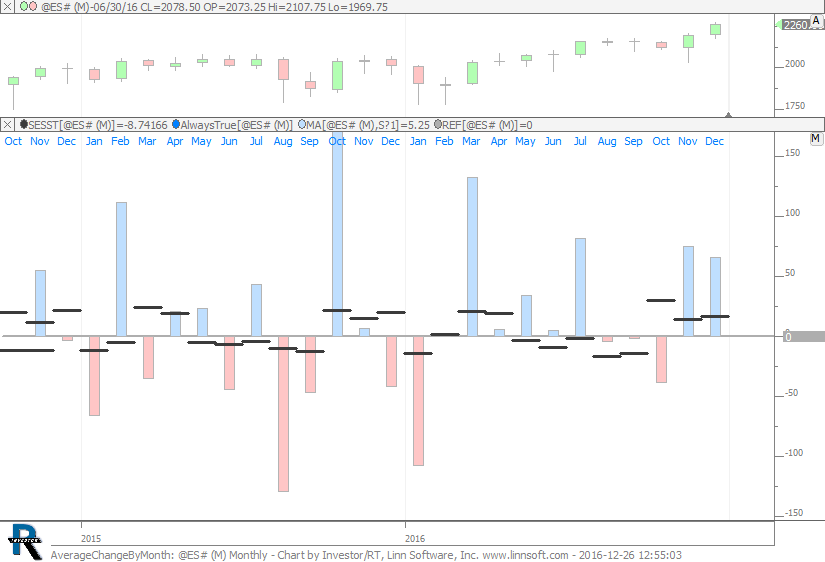
Average Change By Month - Black is Average since 1998. Histogram is change of that month. This chart was uploaded by Investor/RT 12.7.1 showing symbol: @ES#.
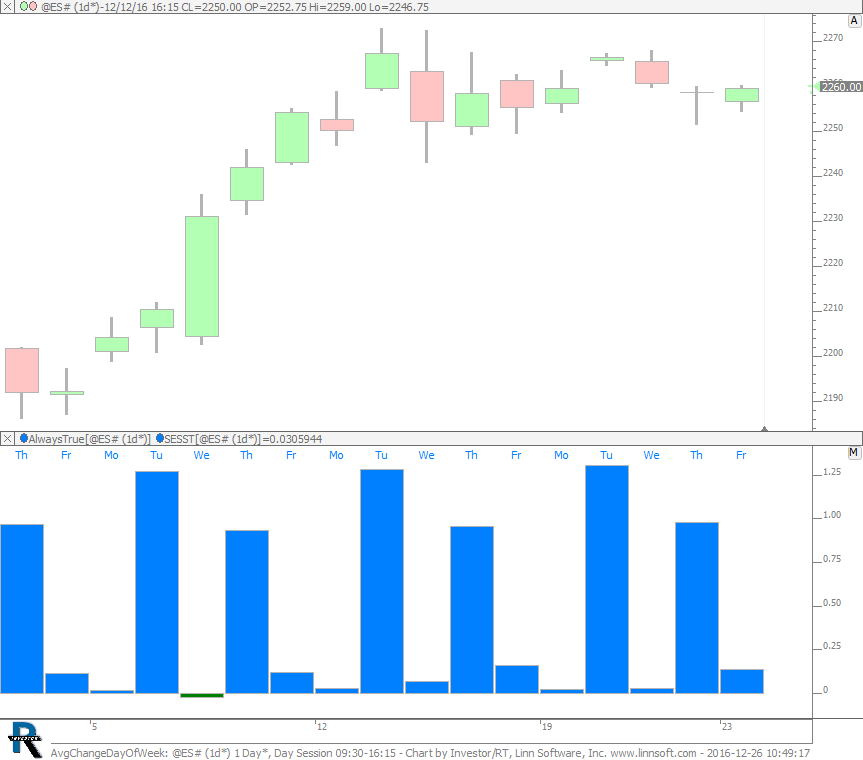
Average Change by Day of Week. This chart was uploaded by Investor/RT 12.7.1 showing symbol: @ES#.
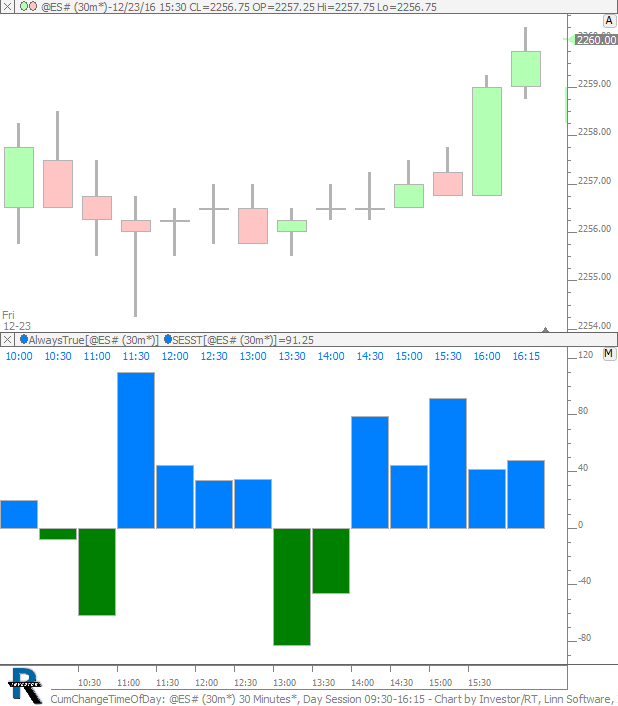
Cumulative Change by Time of Day. This chart was uploaded by Investor/RT 12.7.1 showing symbol: @ES#.