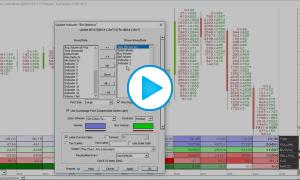
Bar Statistics - Custom Data
This video demonstrates how to add custom rows of textual data to the Bar Statistics Indicator (Bar Stats). Bar Stats can pull rows of data from any custom indicator in the chart and display that data textually. Bar Stats uses the color of the custom indicator to shade the row, the display format of the indicator to format the data, and the custom label of the custom indicator to label each row. Each Bar Stats indicator can have up to 12 custom rows of data and multiple instances of Bar Stats can be added to same chart if more than 12 are needed.


