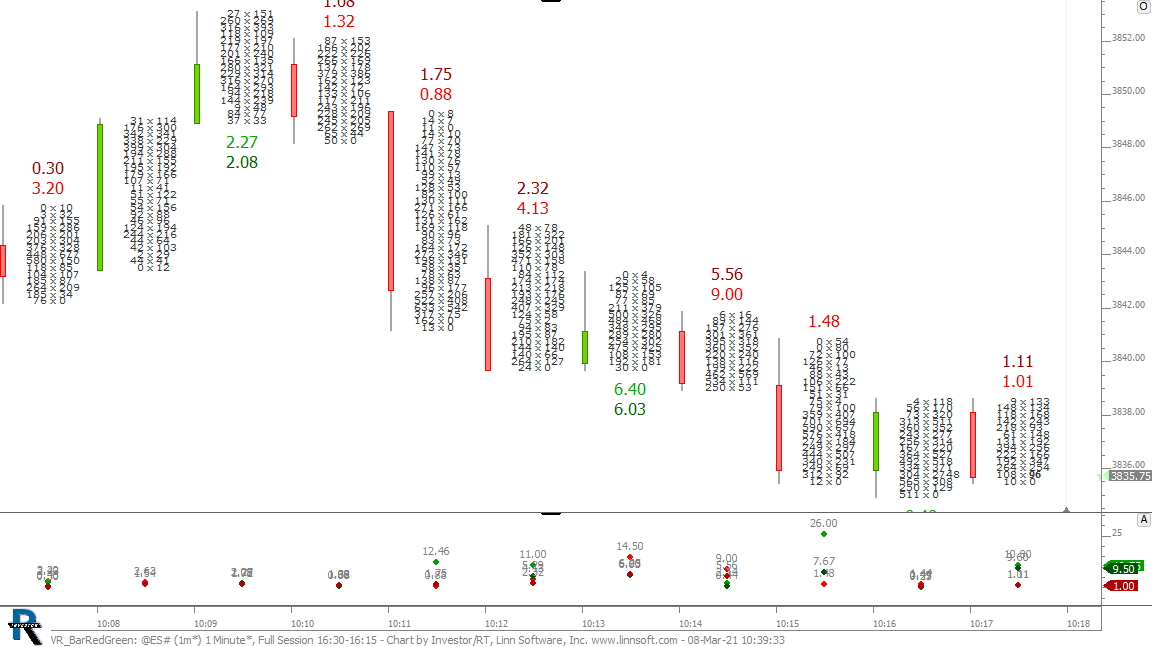
CP PriceCount (@ES#)
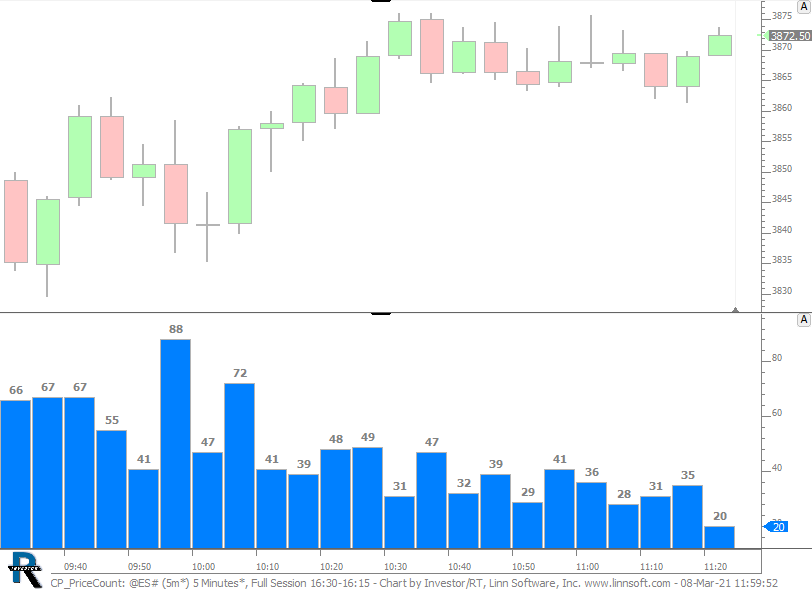
Labels range of each bar in ticks. This chart was uploaded by Investor/RT 14.2.6 showing symbol: @ES#.
Labels range of each bar in ticks. This chart was uploaded by Investor/RT 14.2.6 showing symbol: @ES#.

Labels range of each bar in ticks. This chart was uploaded by Investor/RT 14.2.6 showing symbol: @ES#.
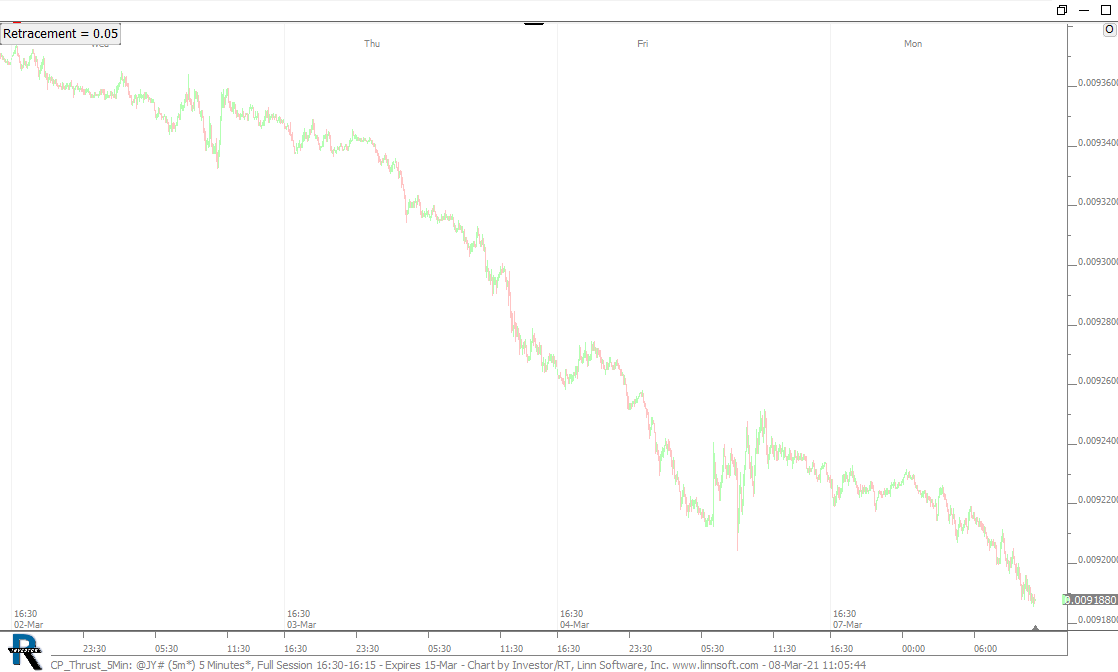
This chart was uploaded by Investor/RT 14.2.6 showing symbol: @JY#.
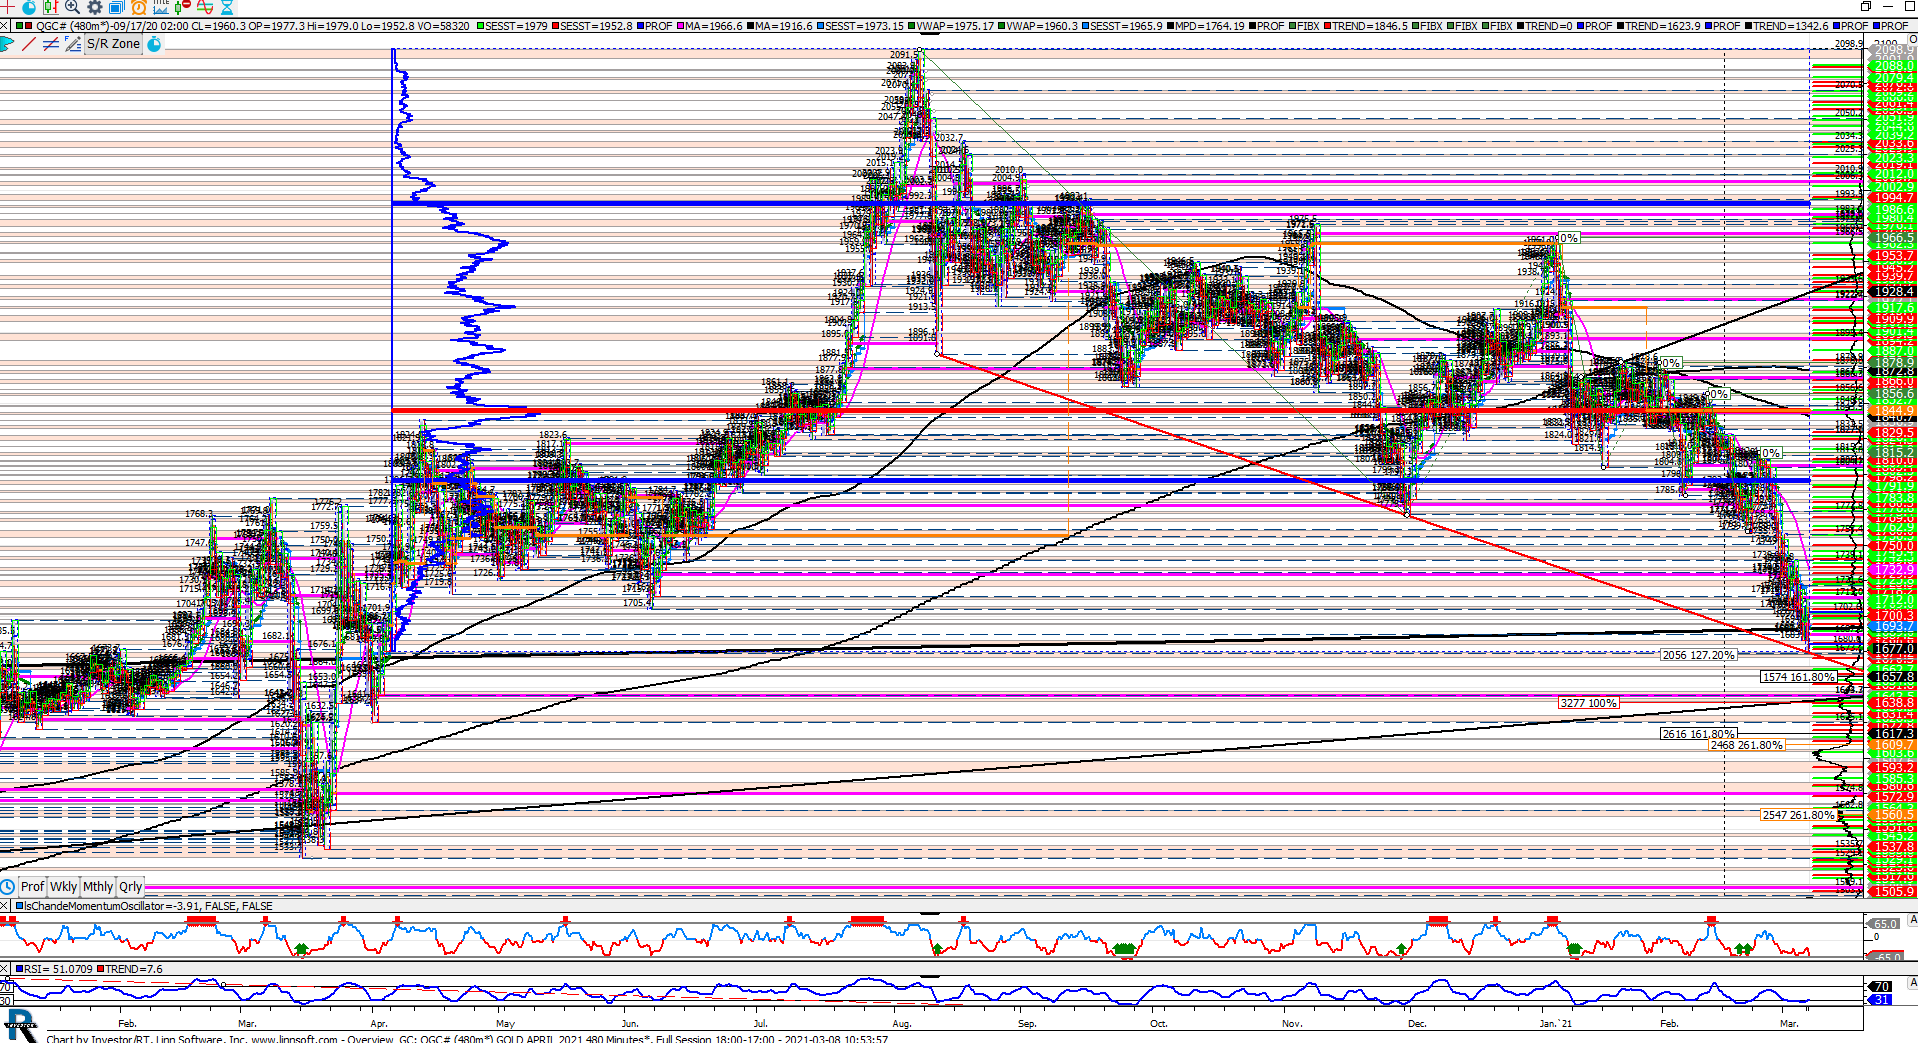
This chart was uploaded by Investor/RT 14.1.10 showing symbol: QGC#.
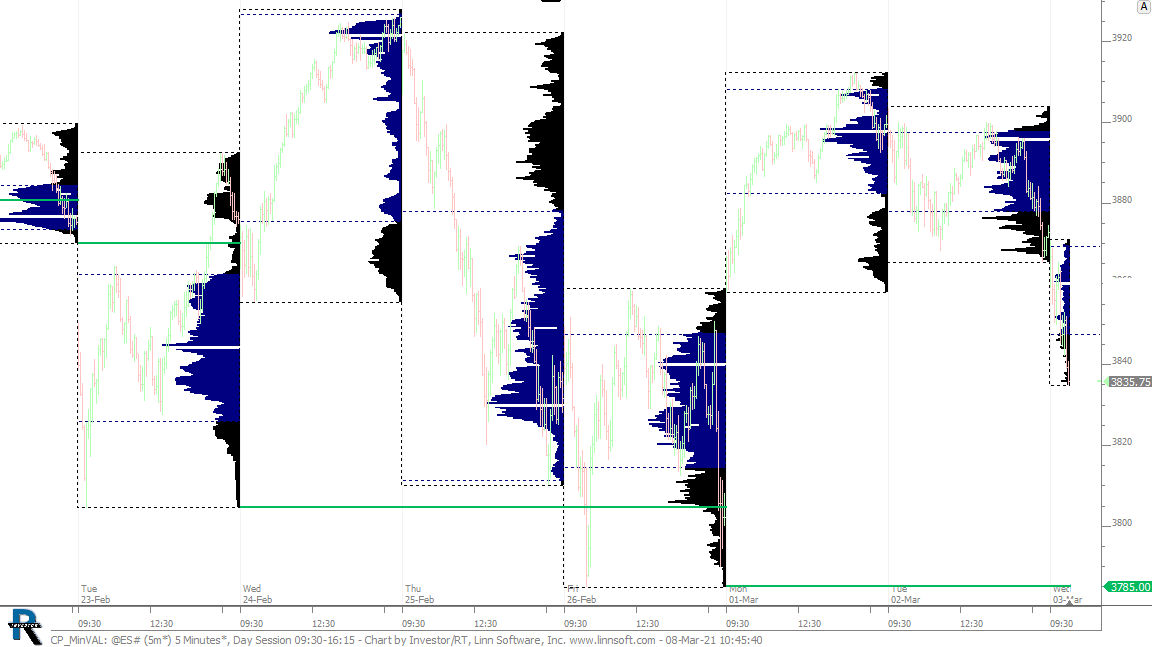
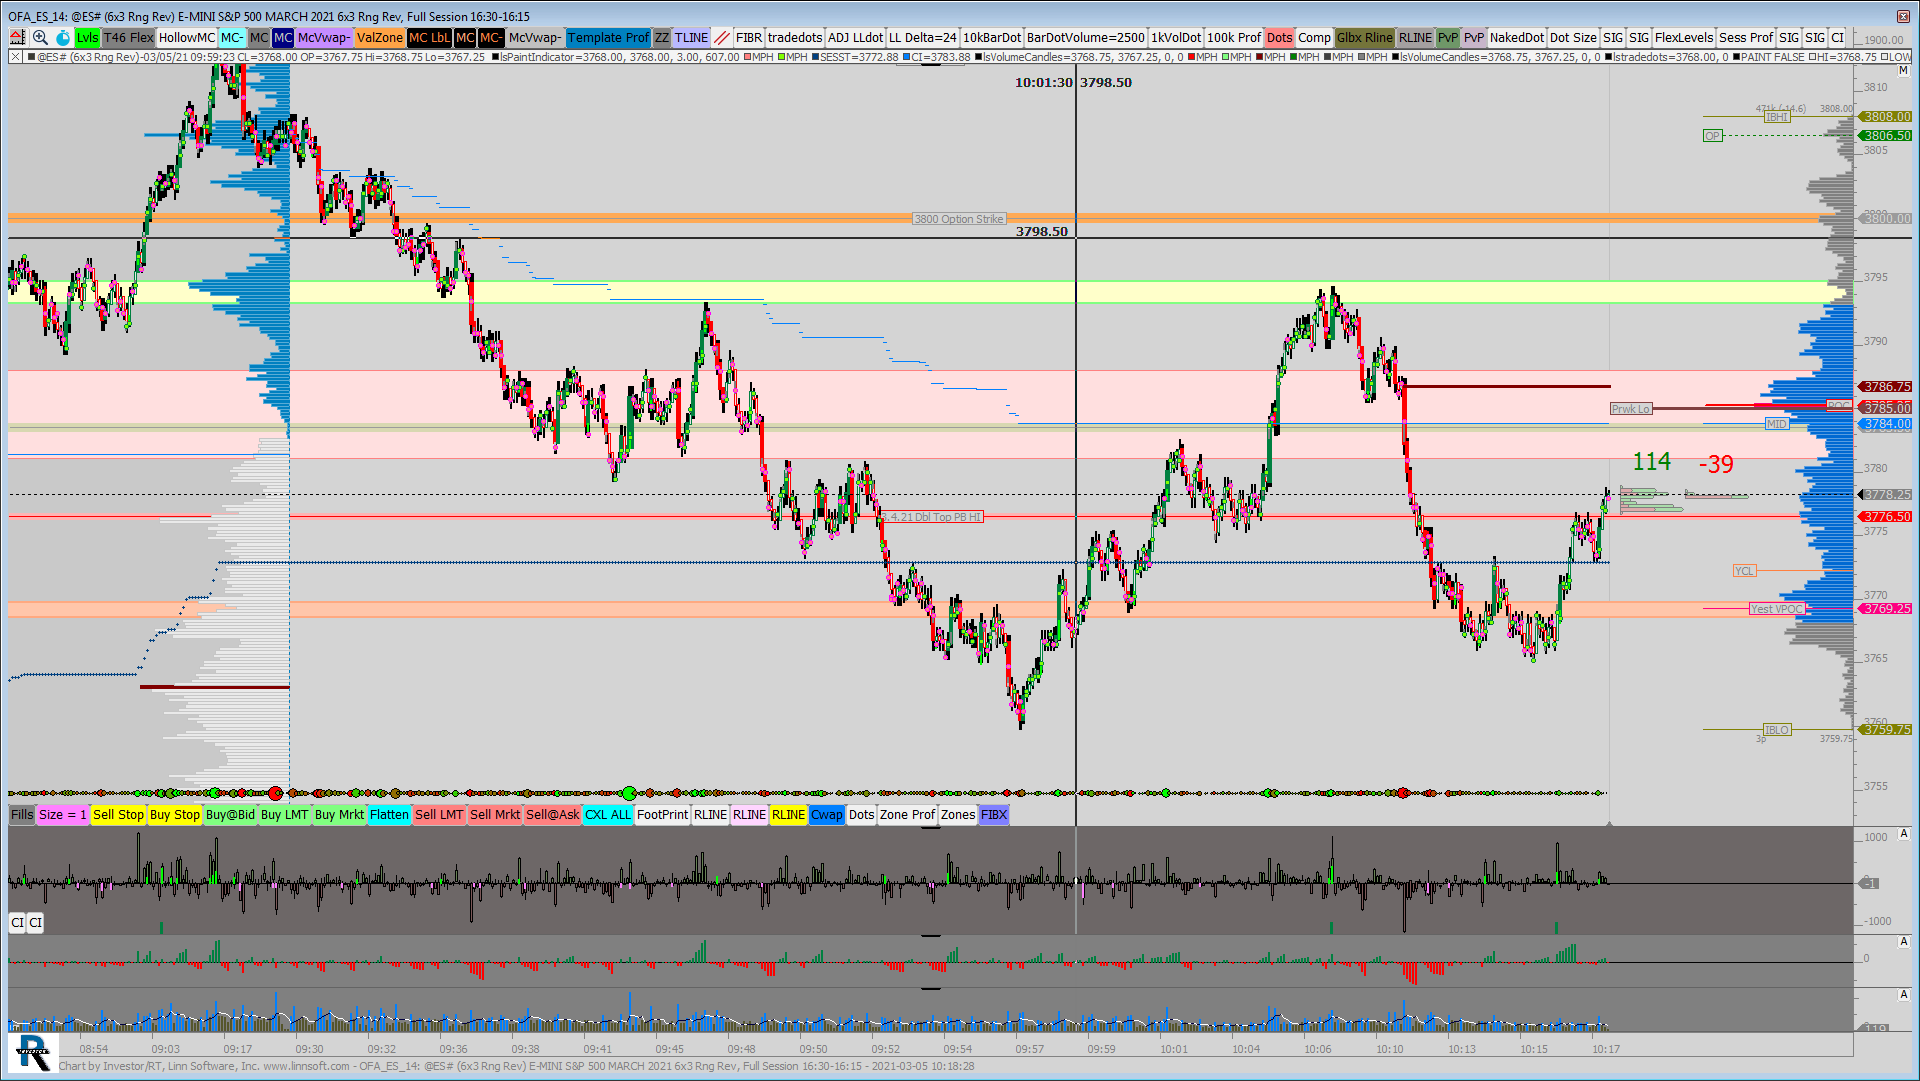
Min VAL of last 5 profiles. This chart was uploaded by Investor/RT 14.2.6 showing symbol: @ES#.
This chart was uploaded by Investor/RT 14.2.6 showing symbol: @ES#.
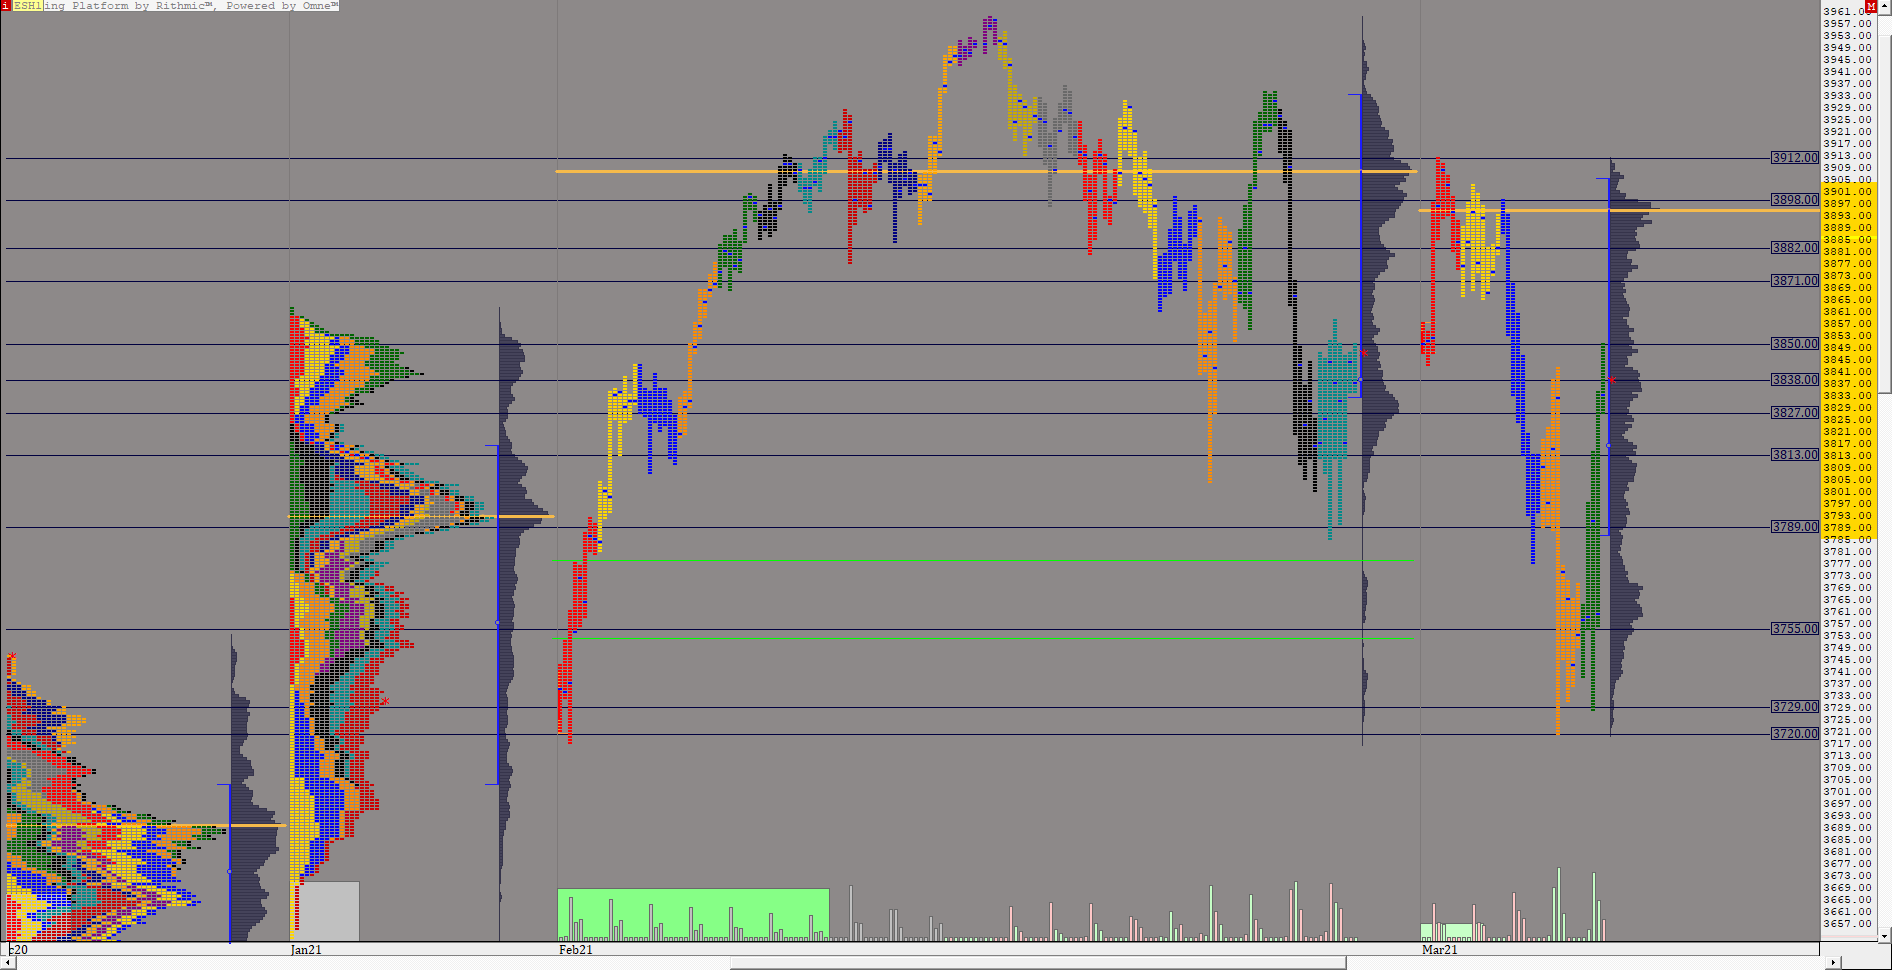
This chart was uploaded by Investor/RT 14.2.5 showing symbol: ESH1.

This chart was uploaded by Investor/RT 14.2.5 showing symbol: AUD.JPY.
This chart was uploaded by Investor/RT 12.7.6 showing symbol: @ES#.
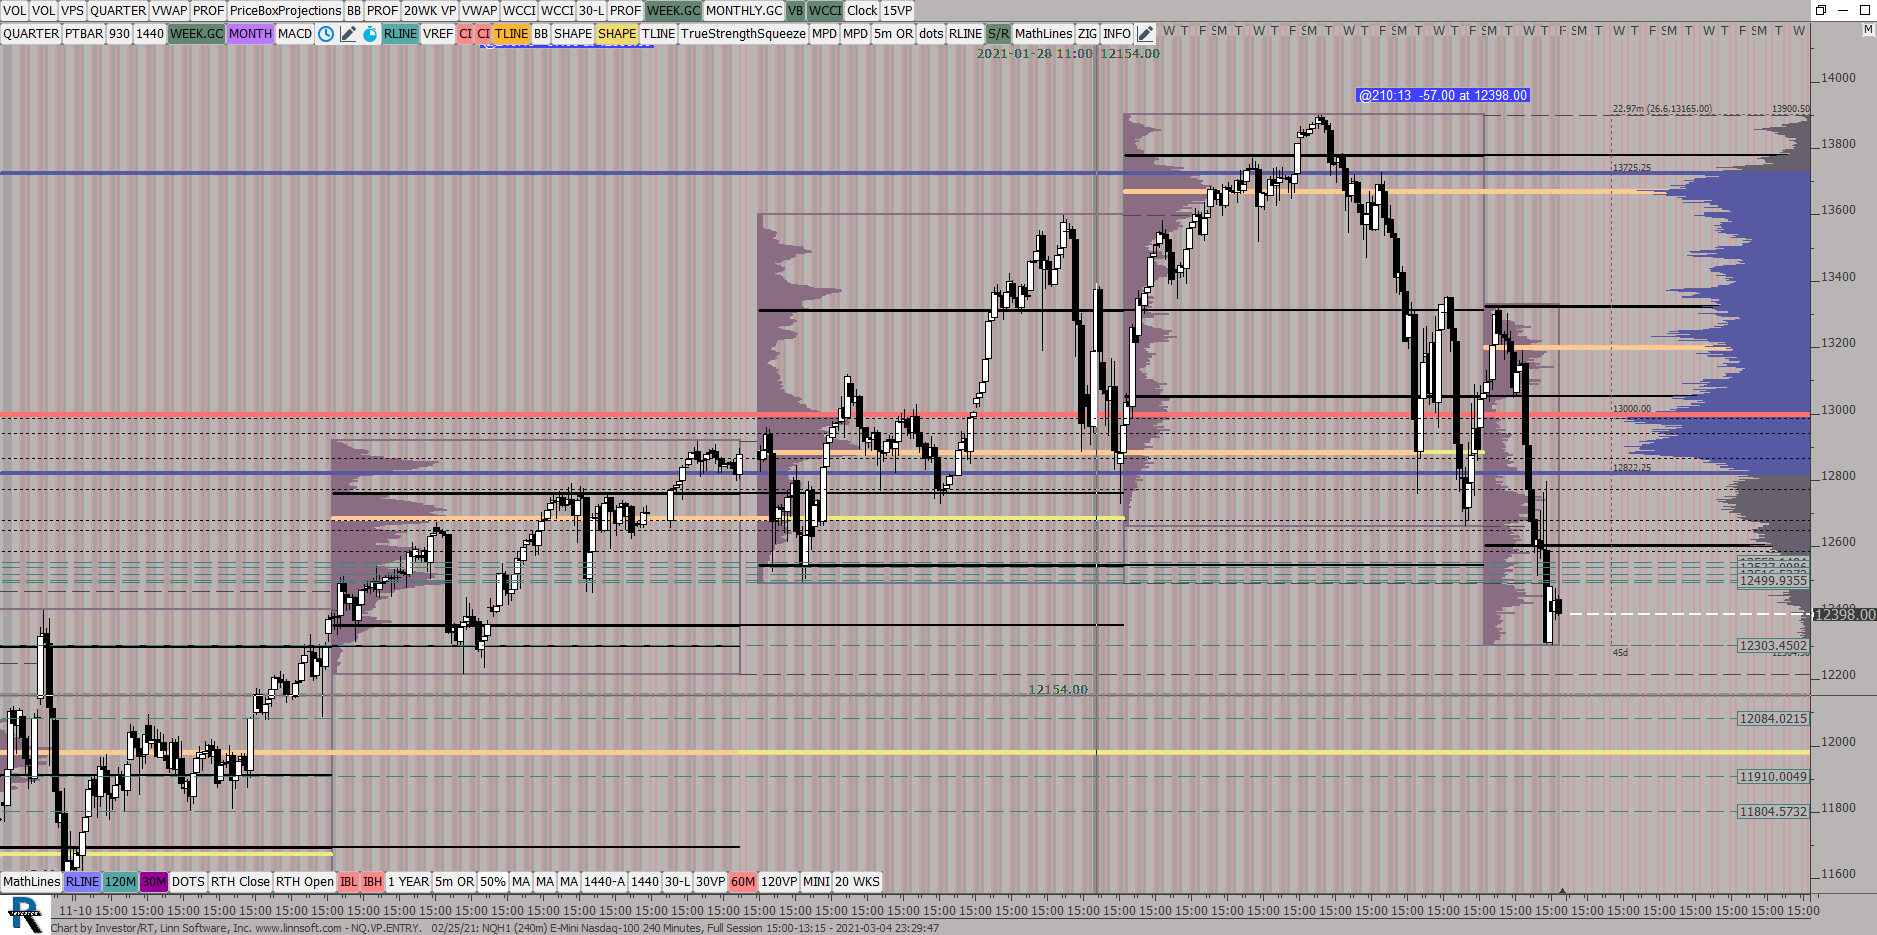
This chart was uploaded by Investor/RT 14.2.5 showing symbol: NQH1.