DJ PaintCandles (@ES#)
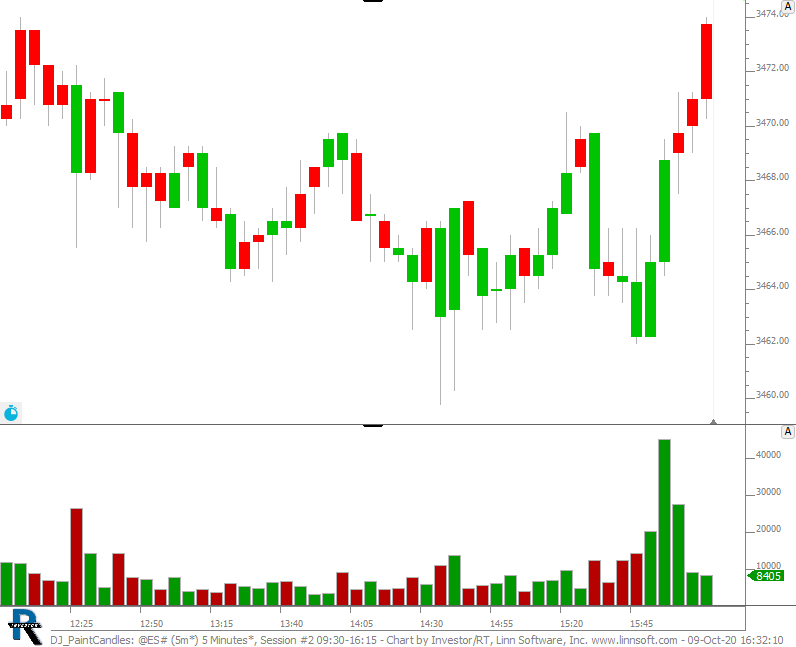
Volume painted based on whether the bar closed up or down. Bars pained based on whether volume is up or down. This chart was uploaded by Investor/RT 14.2.1 showing symbol: @ES#.
Volume painted based on whether the bar closed up or down. Bars pained based on whether volume is up or down. This chart was uploaded by Investor/RT 14.2.1 showing symbol: @ES#.
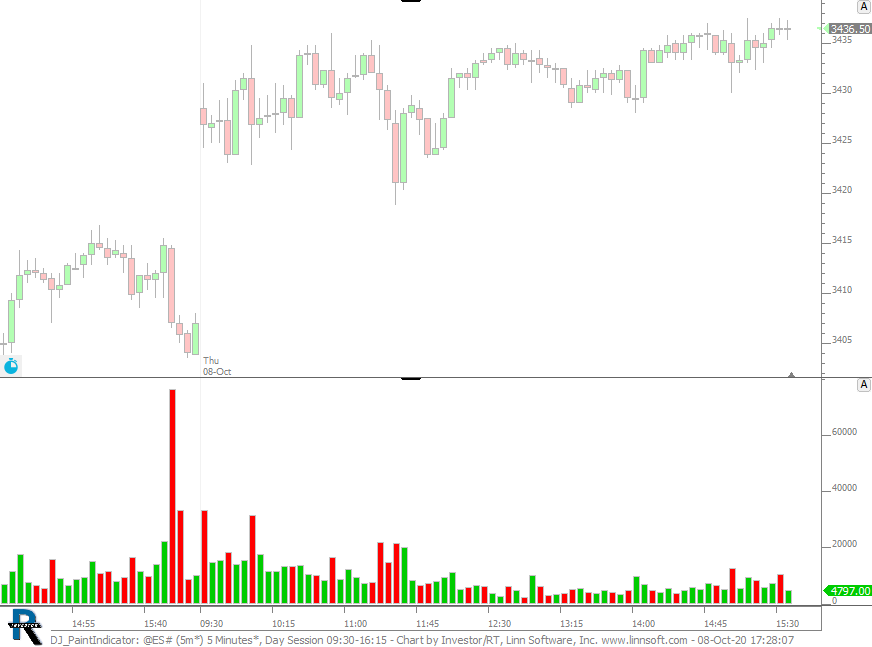
Volume painted based on whether the bar closed up or down. This chart was uploaded by Investor/RT 14.2.1 showing symbol: @ES#.
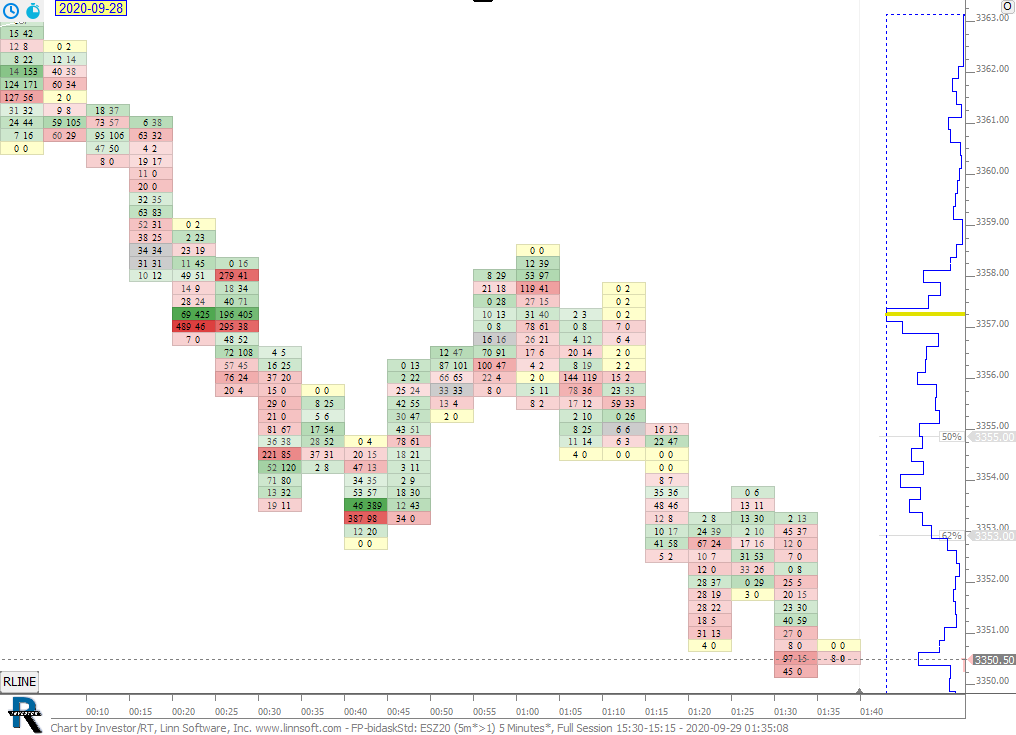
This chart was uploaded by Investor/RT 14.1.9 showing symbol: ESZ20.
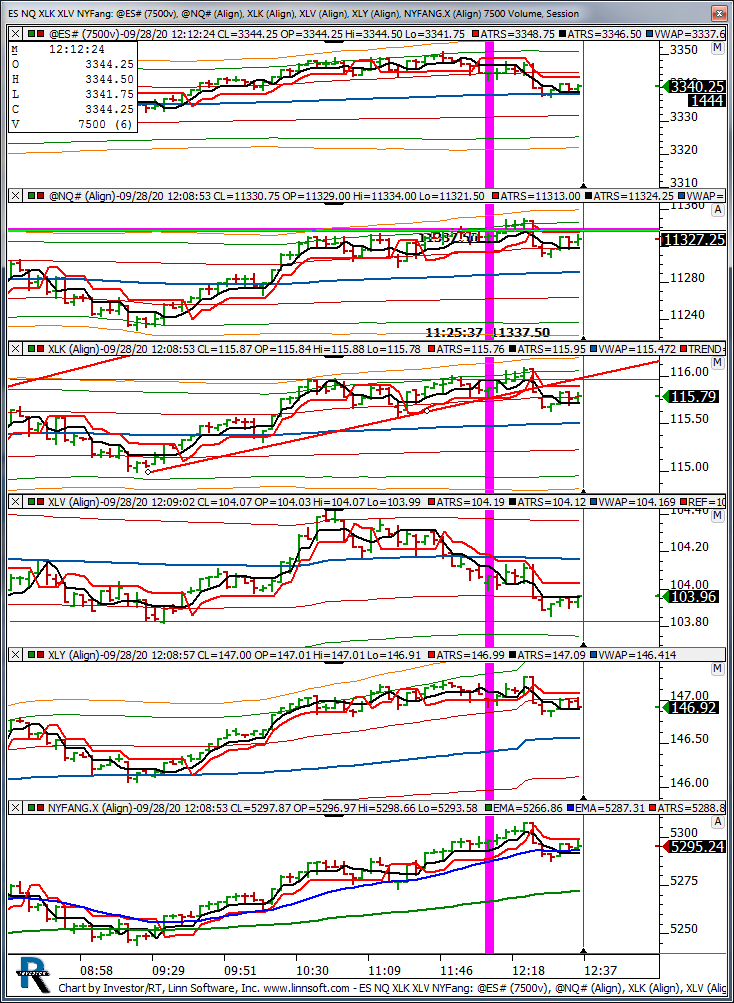
etf. This chart was uploaded by Investor/RT 14.1.9 showing symbol: @ES#.
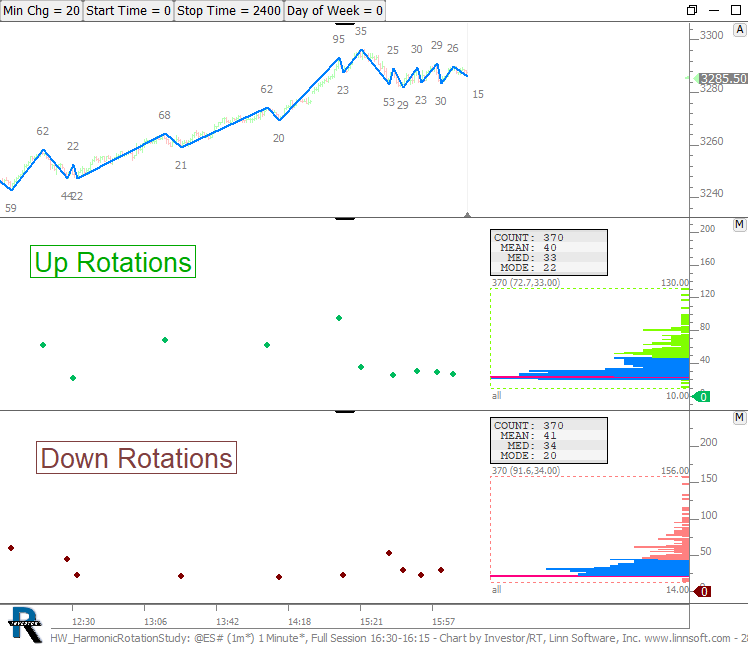
Harmonic Rotation Study. This chart was uploaded by Investor/RT 14.1.9 showing symbol: @ES#.
You might need to hit the recalc button ONCE when opening the chart. This chart was uploaded by Investor/RT 14.1.9 showing symbol: @ES#.
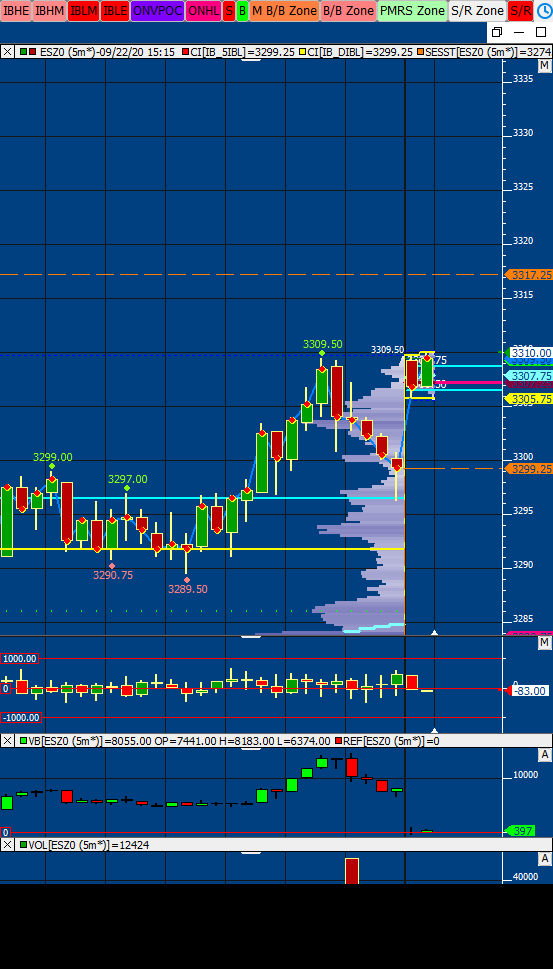
This chart was uploaded by Investor/RT 14.1.8 showing symbol: ESZ0.
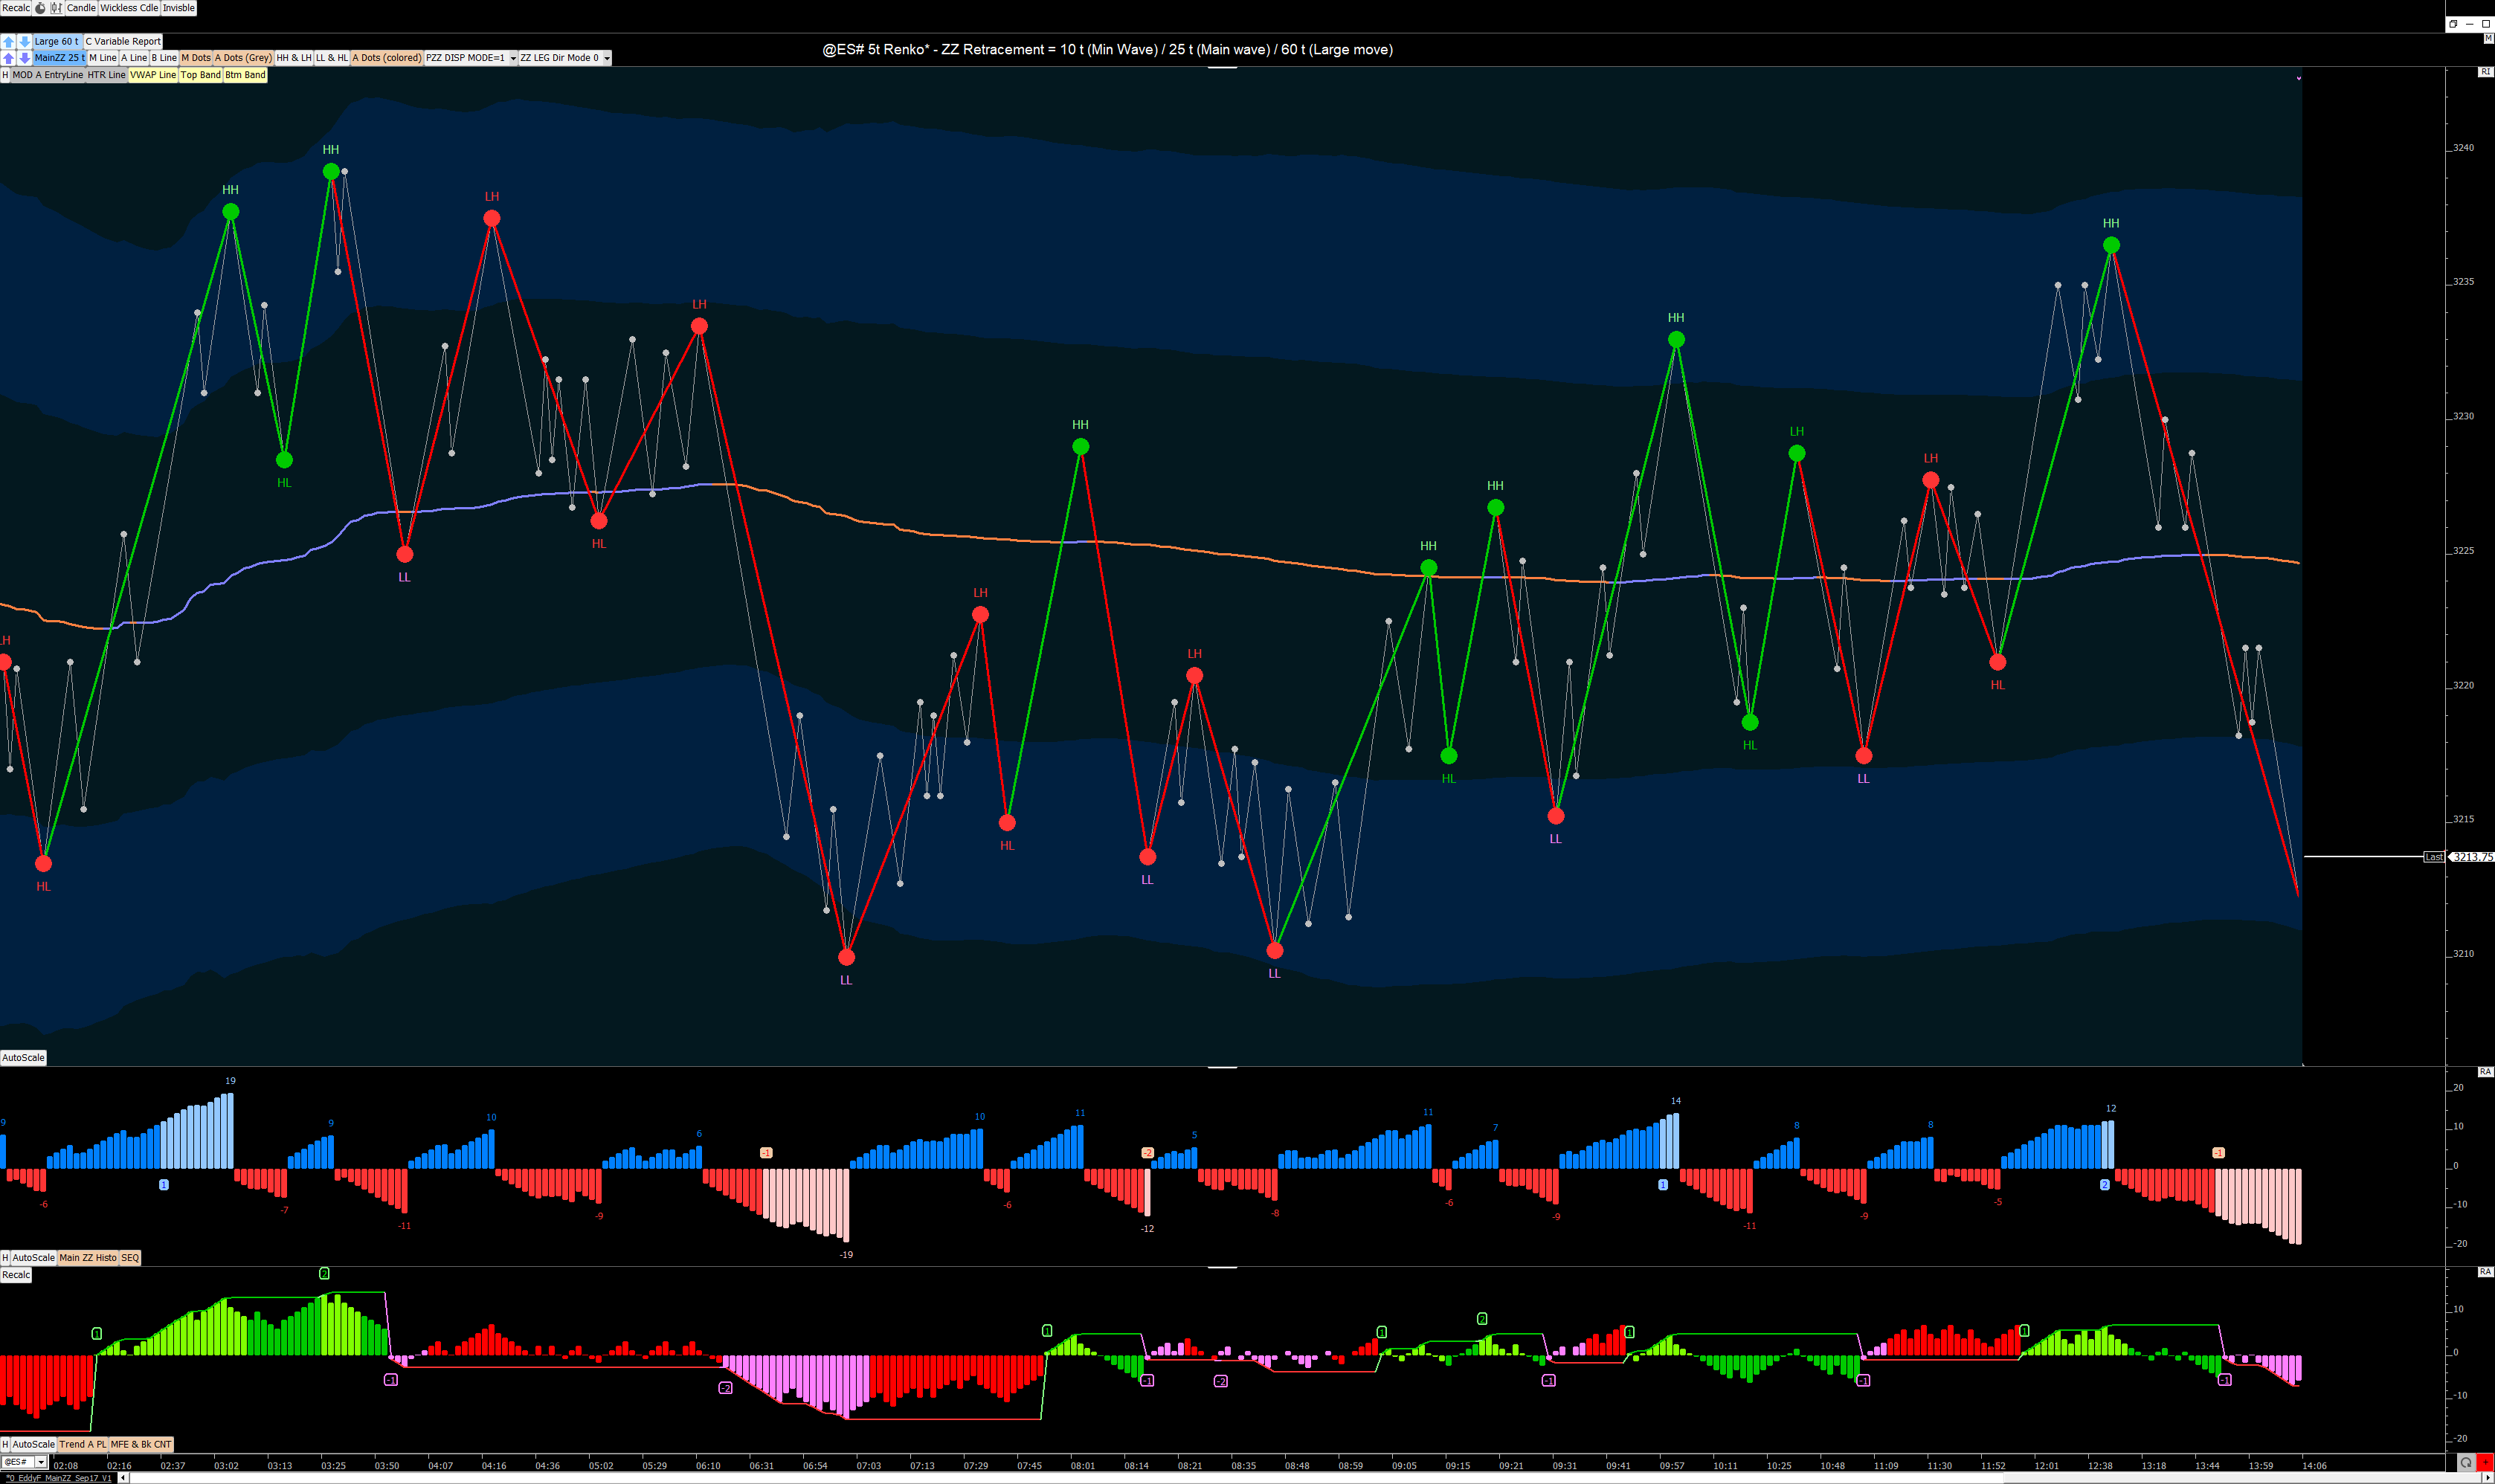
This chart was uploaded by Investor/RT 14.1.6 showing symbol: @ES#.
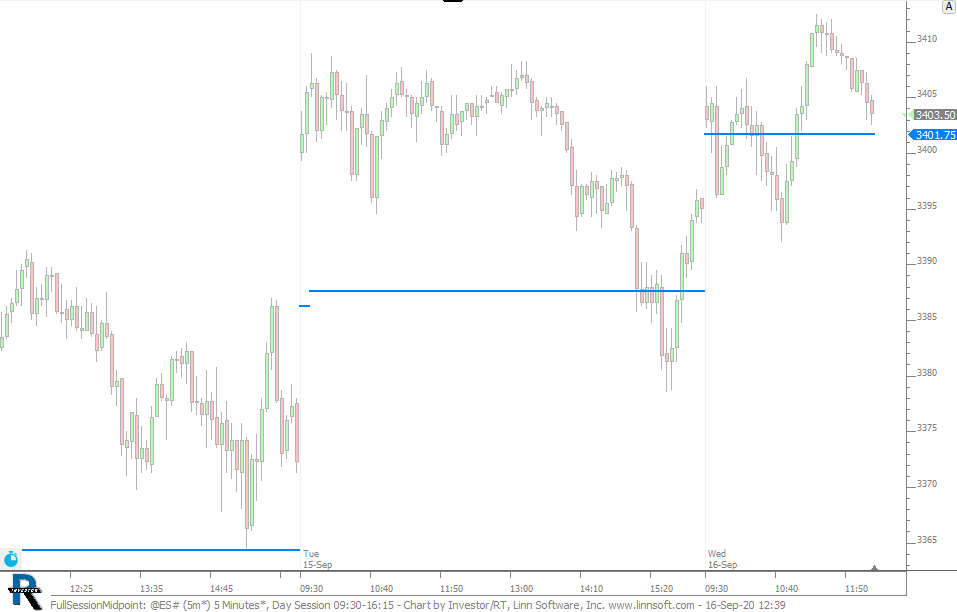
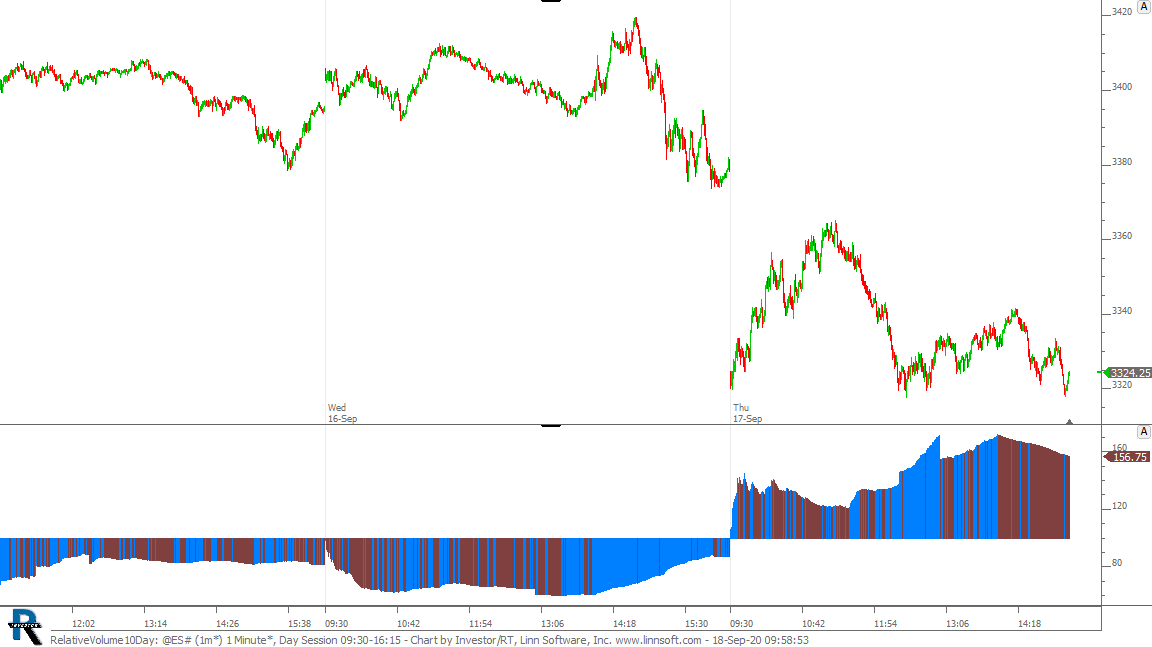
Blue line plots the full session mindpoint on a day session chart. Drag and drop to any other chart. This chart was uploaded by Investor/RT 14.1.6 showing symbol: @ES#.
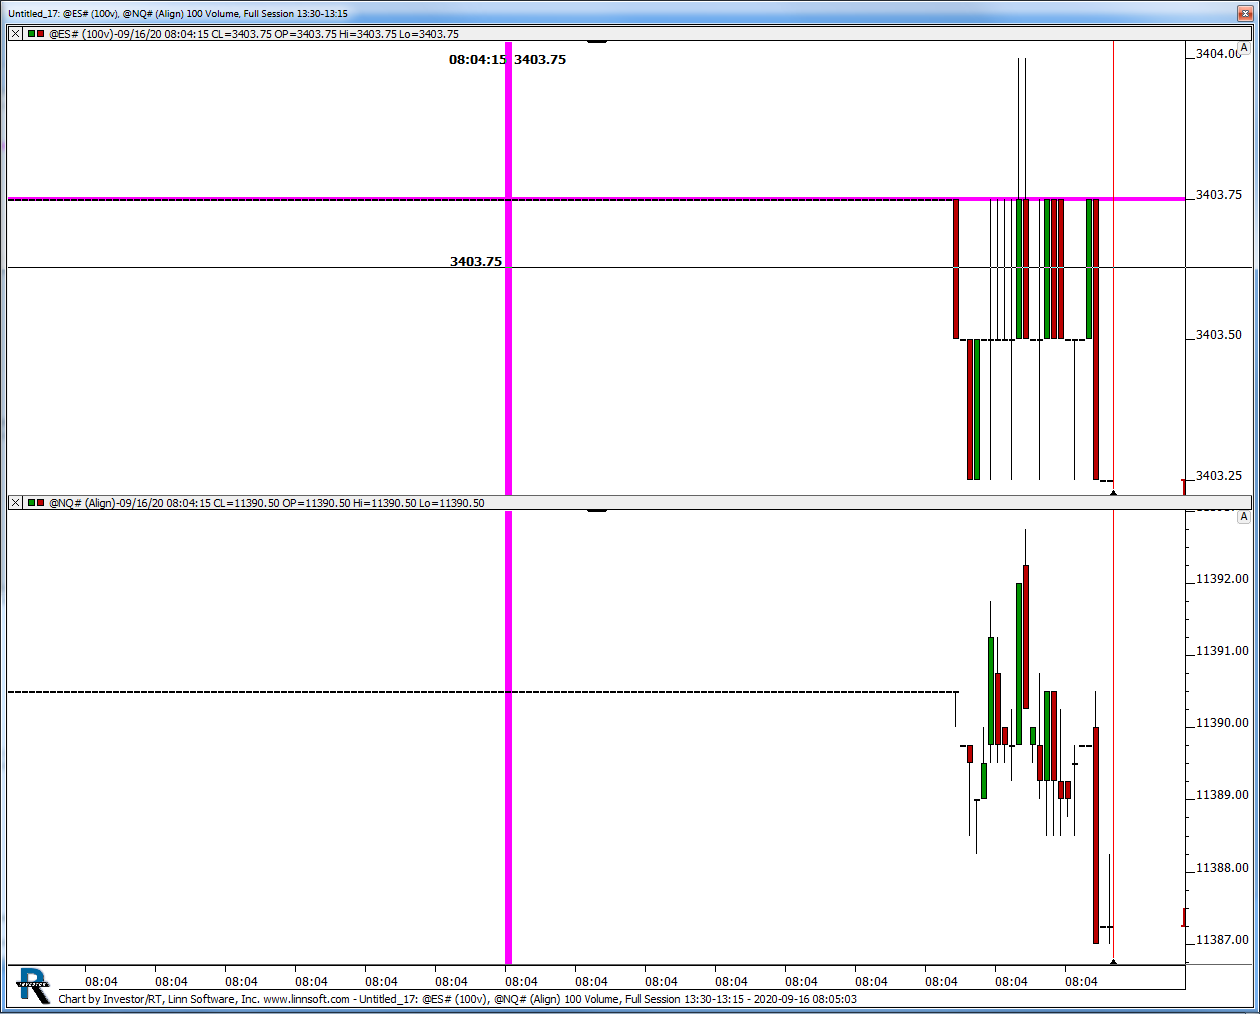
ES 100V. This chart was uploaded by Investor/RT 14.1.6 showing symbol: @ES#.