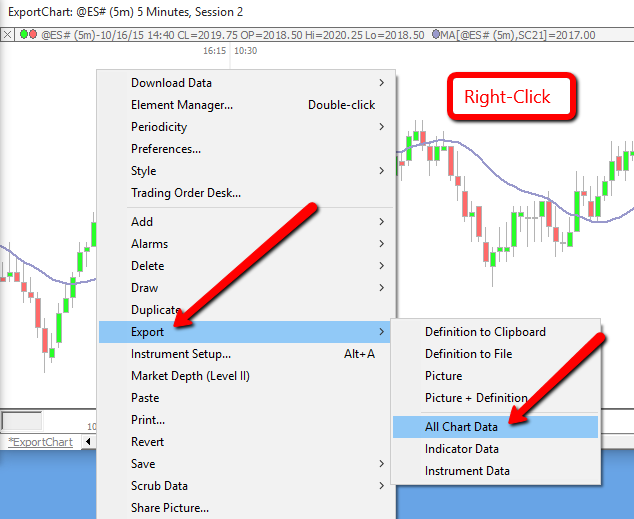
Users may right-click in a multi-pane chart and choose "Export: All Chart Data" as seen below.

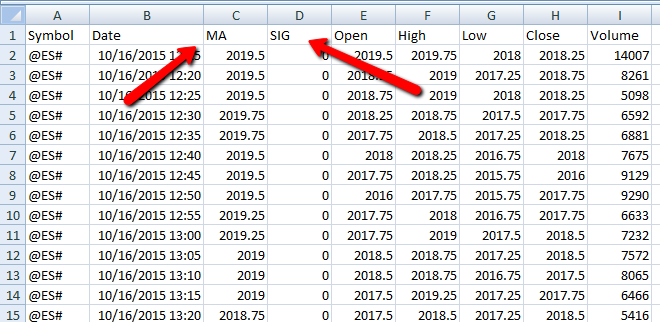
...and get a resulting .csv file that opens up in Excel automatically and includes the instrument data (open, high, low, close, volume) along with the data for each indicator, on each bar. Each indicator receives it's own column of data, with each row of that column providing the value of that indicator for a particular bar (some indicators have more than one column for more than one array of data). The titles of these columns are somewhat generic, with the title of a Signal Marker bing "SIG" and the title of a Moving Average being "MA".

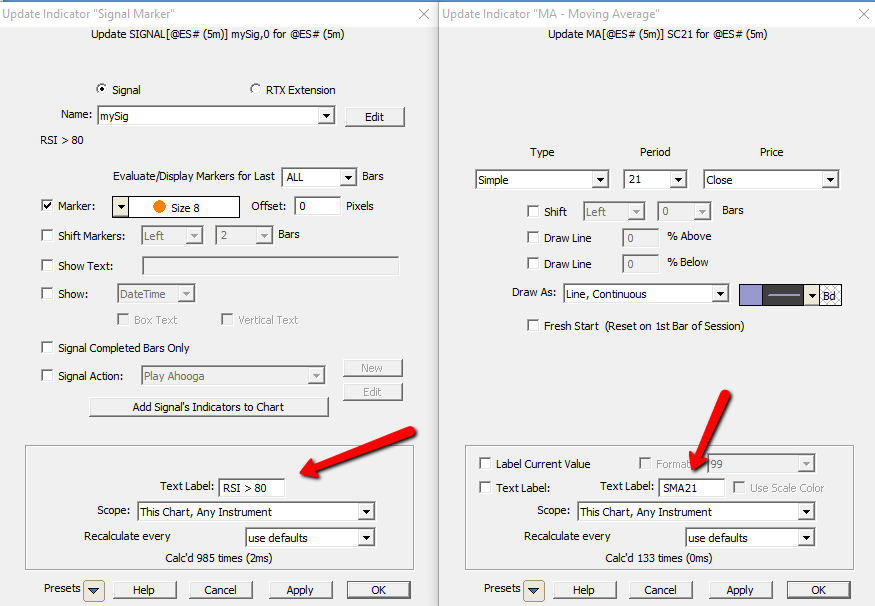
However, users can customize these column titles by bringing up the preferences of each indicator and giving each a custom text label as seen below...

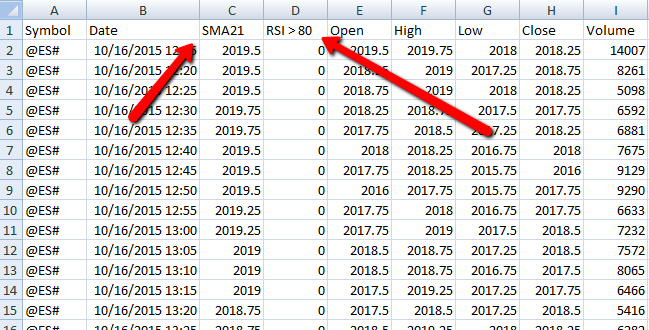
Now when all data is exported again, the indicator columns will be labelled appropriately as seen below.


