Background :
In the Trader's Lab Discord chat room, Tom B is sharing his exhaustive auction market theory knowledge and expertise when it comes to trading the E-Mini S&P. Tom has been using IRT as his main charting platform for the past fifteen years as it provides all the indicator toolkit needed to analyze future markets from a volume profile point of view. This article reviews the chart that Tom B uses to export his essential daily market levels into Bookmap cloud notes.
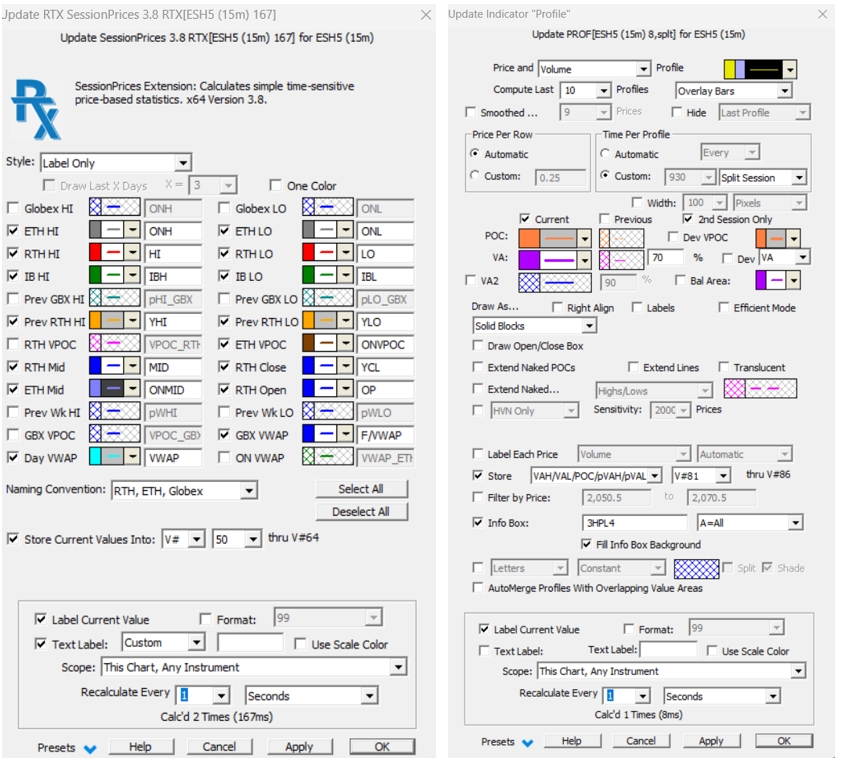
This standalone chart will store into V# variables the spot prices corresponding to the main Key market levels to be exported, using the “Store into V#” features of the following Investor / RT indicators :
- The Session Price indicator (market levels stored in Variables V#50 to V#64)
- The Profile Indicator (VPOC, VAL and VAH values of the current and previous day session are stored in V#81 to V#86)
- Several individual custom indicators for the Settlement price and various Initial balance related levels not included in the Session Price indicators (Initial Balance Low and High set after 30 minutes, 1.5 and 2x IB extension based on the 1 hour IB Low and High values..).V#43 to V#49 are used for these values.
Using the Exportdata indicator features, the same chart will then generate the csv files with the required Bookmap format.
Quick setup instructions :
- Step 1 : Make sure you have reviewed Tom B global Investor/RT settings on this forum post
- Step 2 : Download the chart definition (and the corresponding input csv files needed for the Export data indicator to generate cash files as per Bookmap cloud notes specification)
- Step 3 : Import the chart definition into your own Investor/RT instance – Double click anywhere on an empty space of the chart to open the chart element manager,
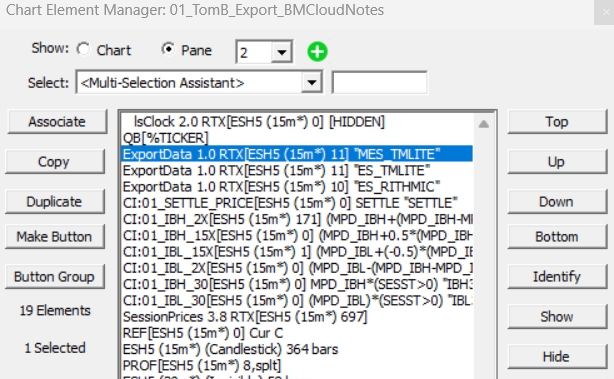
Select within that list the relevant export data indicator and modify the actual path to the input and output csv files as per your PC (or cloud drive) directory (and update accordingly the Bookmap Cloud Notes URL)
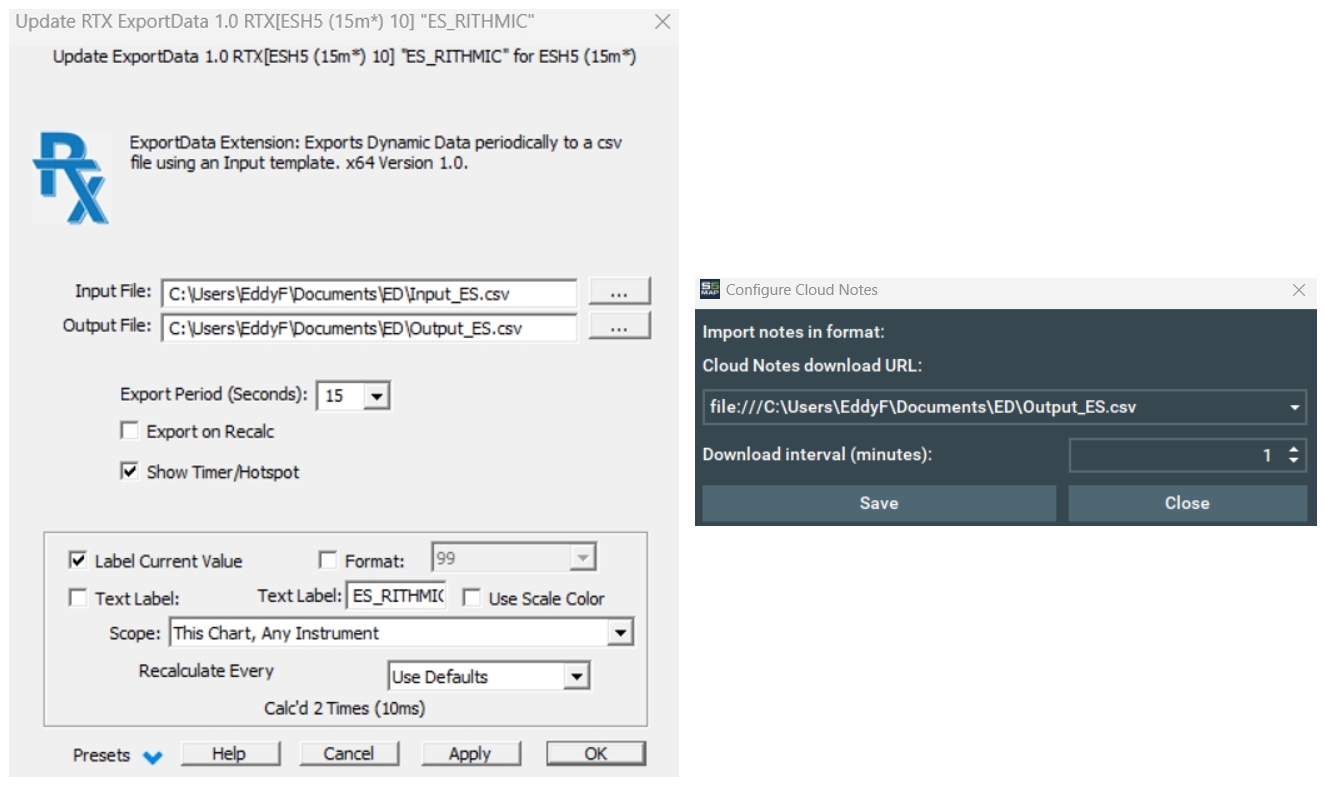
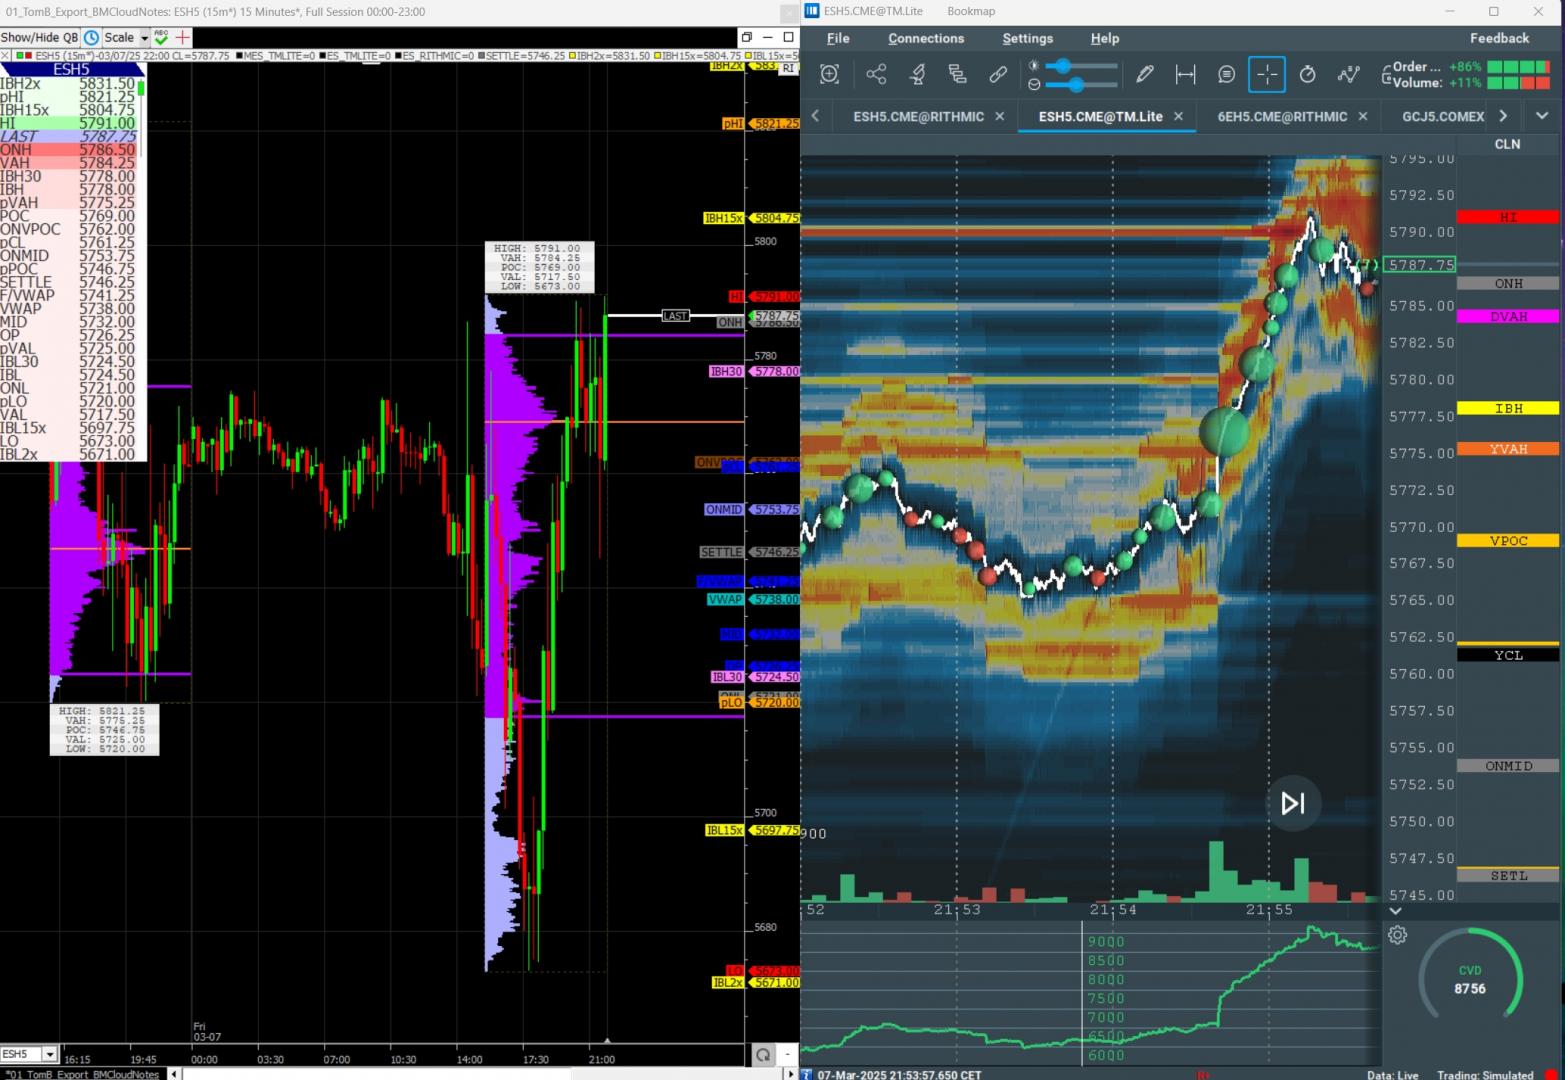
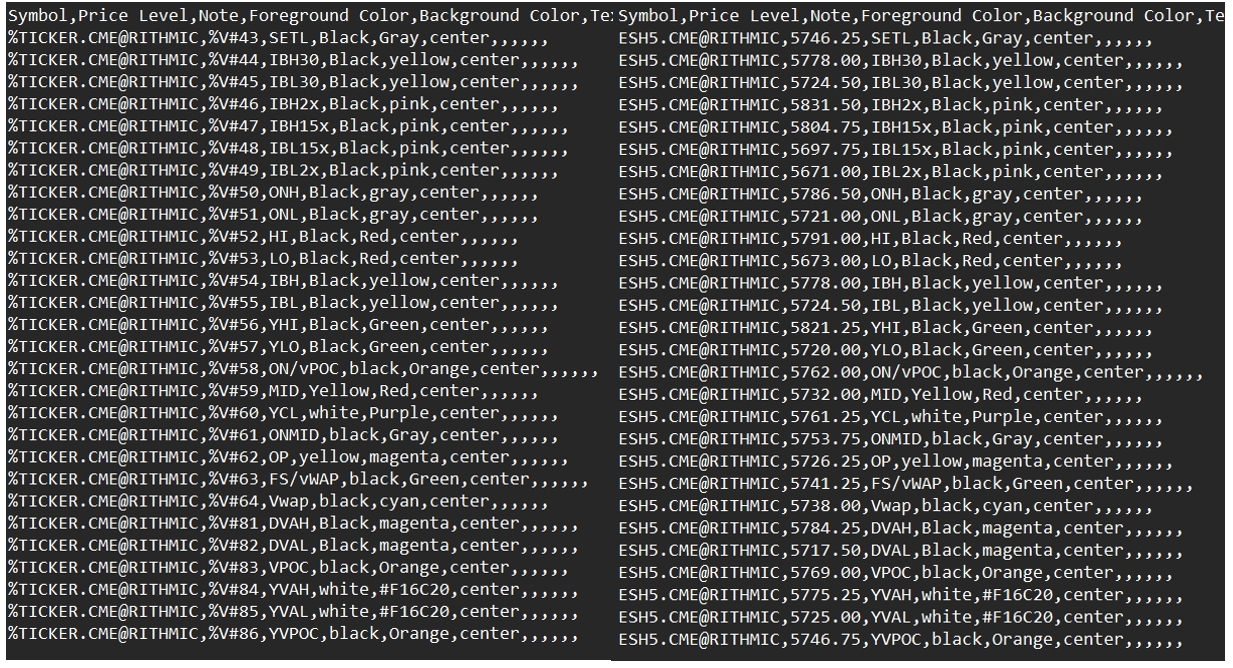
In the above screenshot, the output_ES csv files are automatically generated by the Exportdata indicators whenever the chart gets updated with live data. There is one Exportdata indicator for each single cloudnote and symbol pair. The current values being exported are displayed in the Quoteboard indicator (as they would appear in the Bookmap cloud notes)
Reminder: The chart generates cloud notes that can be added to the ES Rithmic symbol (in Bookmap) but also versions for both the corresponding ES and MES TM Lite symbols. (Delete the exportdata indicator you won't use to avoid unnecessary csv file generation).
Additional information :
- For demonstration purposes, we have included in the same chart both the indicators updating the V# variables and the exportdata indicator. This doesn't necessarily need to be the case, ie V# variables being exported can be generated in any chart (or Investor/RT object) as the exportdata indicator will recover the current V# values from I/RT database. For example, if you want to export in the same cloudnote LVN or HVN levels being stored in another profile chart (see this tip), then just add additional rows to the input csv
- Herebelow the screenshot illustrating the file content of both the Input ES CSV file, and the resulting output file generated by I/RT.
Creating cloud notes for other markets
Let's assume you want to export levels for NQ. The process is very simple : first, create a copy of the input ES csv file and rename it input_NQ for example. Then duplicate the chart (right click Duplicate chart or File : save as) and update the settings of the Export data indicator so that it will point to the newly created Input_NQ.csv (and indicate a location for the Output NQ csv file). That's it. You do not need to modify anything within the input csv files as long as you are using the same V# variables and as the Symbol name will be automatically updated in the output csv file thanks to the "dynamic" Ticker token.
Conclusion:
This export process is fully transparent and can be adjusted to your specific requirements, as any spot price levels being displayed on an IRT chart (Weekly VPOC or VAL, VWAP standard deviations bands, etc) may be included in the export process. Just add additional rows at the end of the input CSV file, with a format similar to the previous lines, but refer to the V# variable used for storing these additional market levels. We do recommend to edit such files with a text editor and make sure there is no invisible "empty" line as the last line.
Note : Efficiency wise, it is best to have this chart (which is running the csv file creation process through one or multiple Exportdata indicators) "minimized" on your desktop and keep it at such (ie keep same chart periodicity). If you need to display on another chart some key spot mkt levels, just copy and paste the quoteboard indicator on that new chart, or add selected reference line indicators (linked to V# variables).
Final tips about using V# variables
- Make sure you don't use twice the same V# variable in 2 separate charts to store different spot values. To review the use of V# variables, you may run the function "User Variable Cross reference" report (Menu File > Functions from the main toolbar). The User Variable Cross Reference is a report showing usage of V# variables within presently open charts and quotepages. This report can be used to diagnose conflicts with user variable usage within charts and quotepage custom columns.
- For the session prices and profile indicators, after importing the chart, corresponding V# variables (V#50 to 64 and V#81 to 86) will be automatically given a title. This will not be the case for V#43 to V#49 which are used to store spot values out of Custom indicators. Corresponding User Variables names can be added in that case through the global User Variables preference menu