Duration:05:00
Variable speed version:
Watch
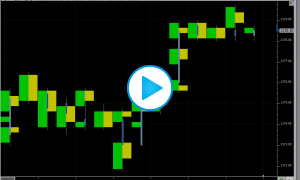
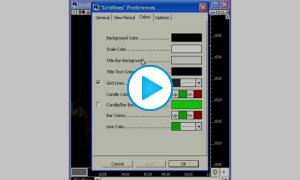
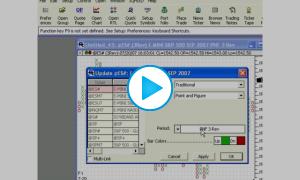
This video demonstrates how to highlight a rectangular region on one chart and have that same region (price range and date/time range) highlighted on other charts containing the same symbol.


