Duration:14:24
Variable speed version:
Watch
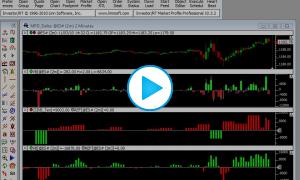
This video demonstrates how to plot the any indicators current value from any chart, on any other chart. In our example, we plotted the daily Volatility Stop on a 3-minute chart as a horizontal reference line.


