 |
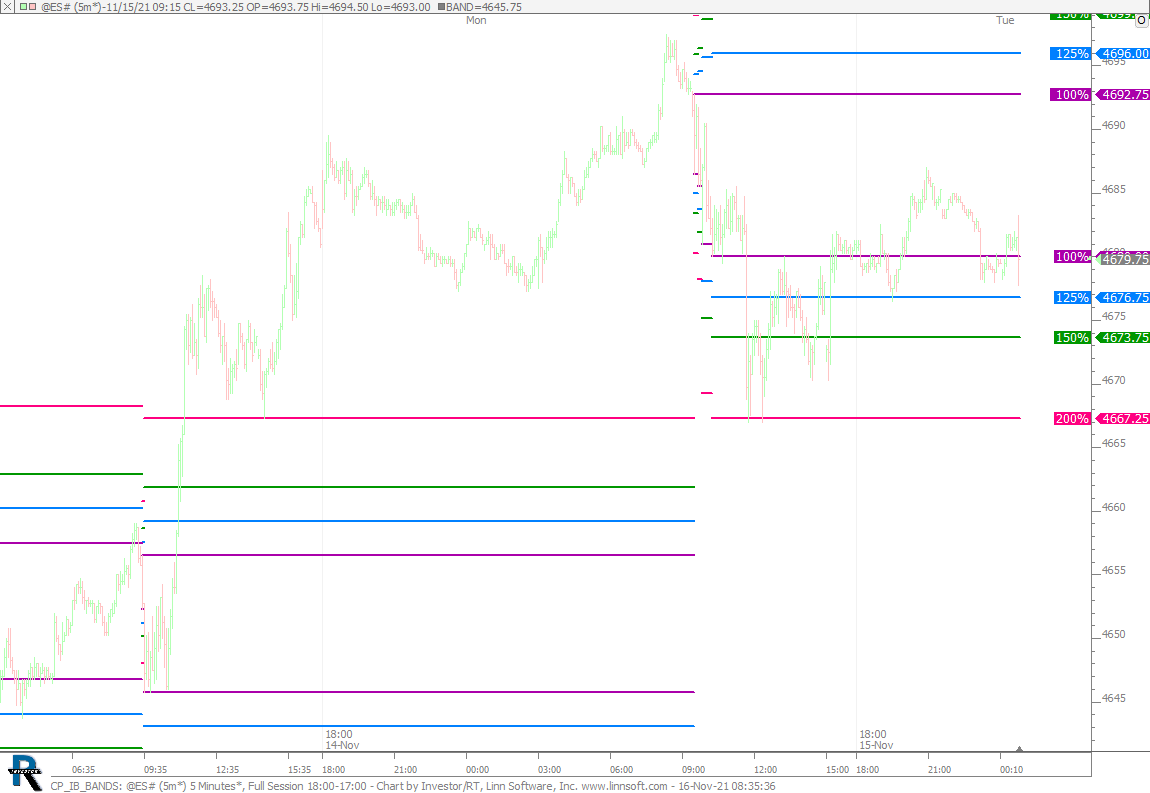
CP IB BANDS (@ES#) cpayne [totalcount]
3 years 5 months ago
Initial Balance Bands. This chart was uploaded by Investor/RT 15.1.1 showing symbol: @ES#. |
View |
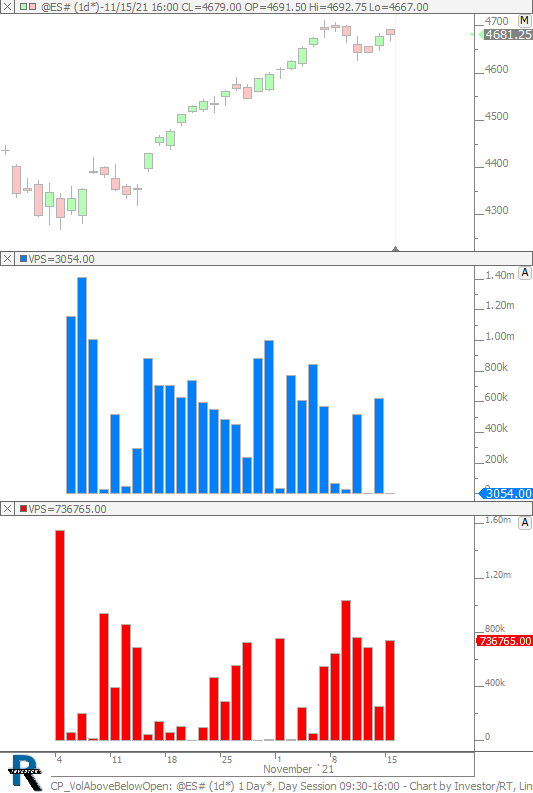 |
CP VolAboveBelowOpen (@ES#) cpayne [totalcount]
3 years 5 months ago
This chart was uploaded by Investor/RT 15.1.1 showing symbol: @ES#. |
View |
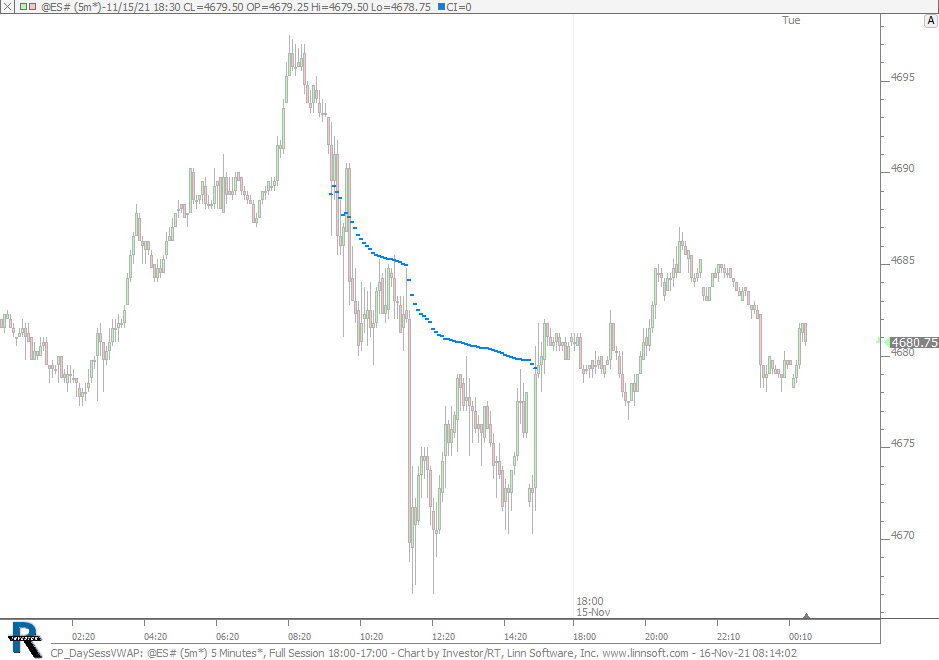 |
CP DaySessVWAP (@ES#) cpayne [totalcount]
3 years 5 months ago
This chart was uploaded by Investor/RT 15.1.1 showing symbol: @ES#. |
View |
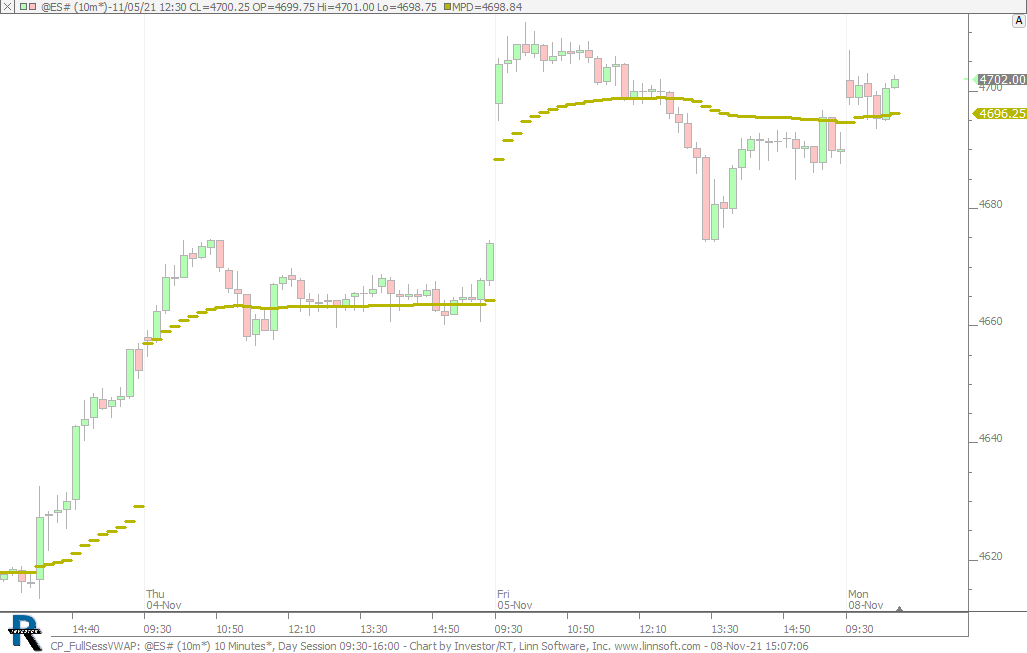 |
CP FullSessVWAP (@ES#) cpayne [totalcount]
3 years 5 months ago
Full Session VWAP on Day Session Chart. This chart was uploaded by Investor/RT 15.1.1 showing symbol: @ES#. |
View |
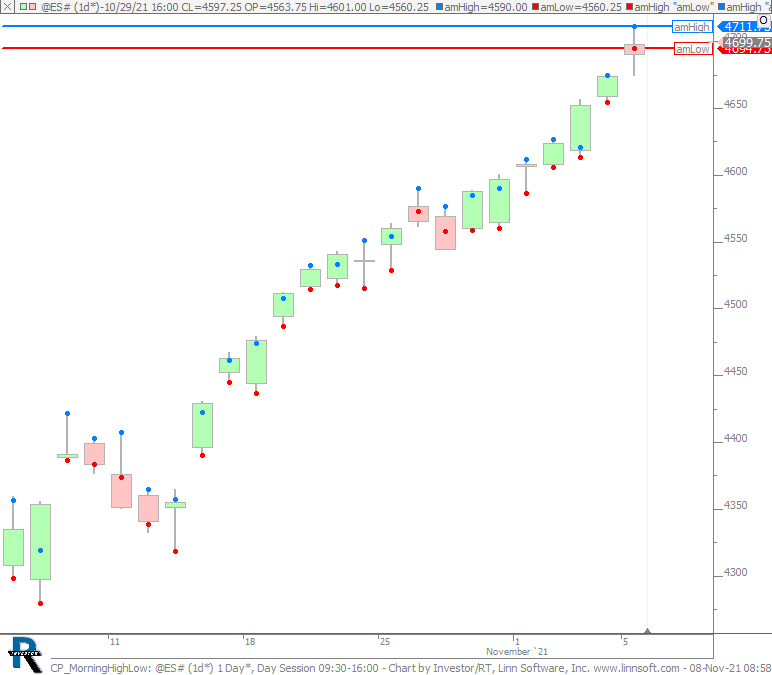 |
CP MorningHighLow (@ES#) cpayne [totalcount]
3 years 5 months ago
This chart was uploaded by Investor/RT 15.1.1 showing symbol: @ES#. |
View |
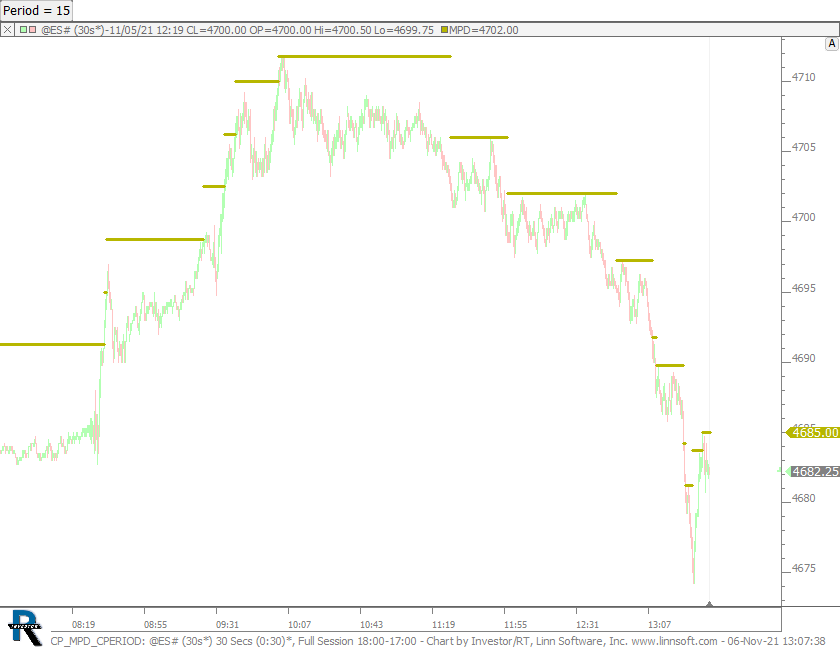 |
CP MPD CPERIOD (@ES#) cpayne [totalcount]
3 years 5 months ago
This chart was uploaded by Investor/RT 15.1.1 showing symbol: @ES#. |
View |
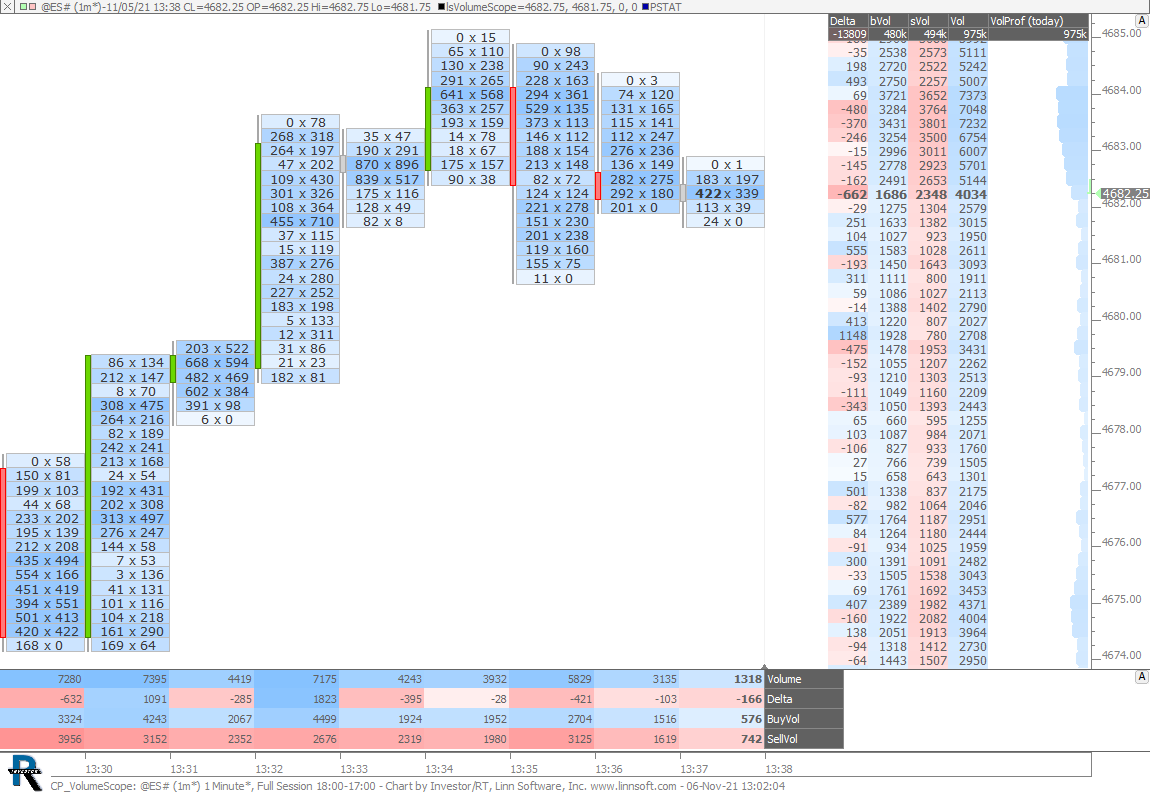 |
CP VolumeScope (@ES#) cpayne [totalcount]
3 years 5 months ago
This chart was uploaded by Investor/RT 15.1.1 showing symbol: @ES#. |
View |
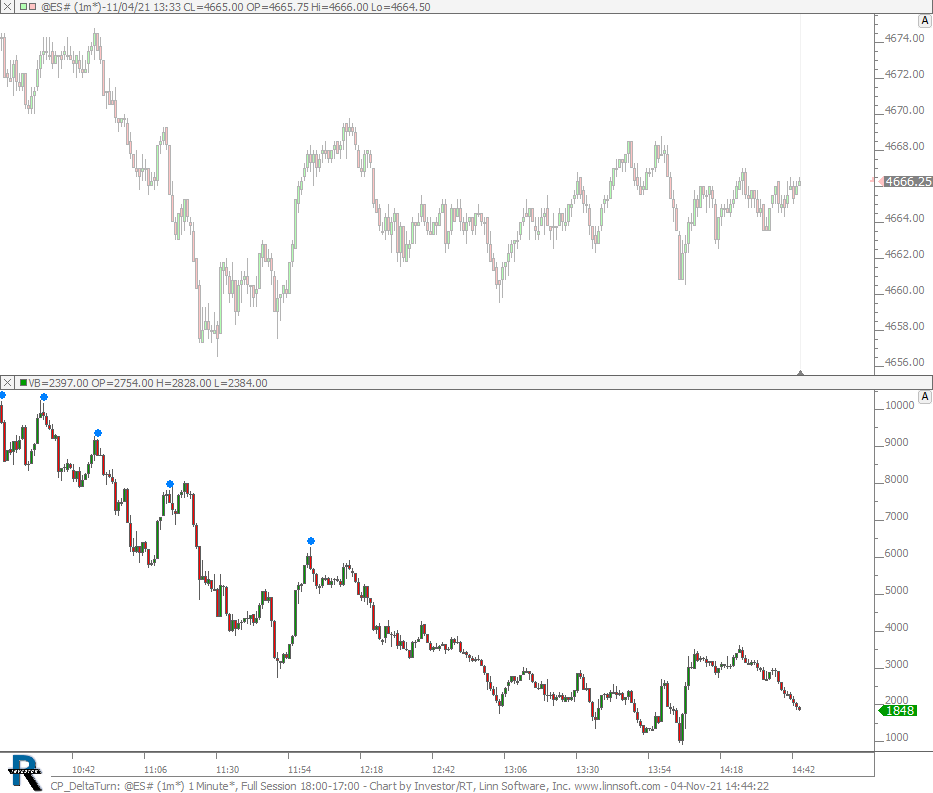 |
CP DeltaTurn (@ES#) cpayne [totalcount]
3 years 5 months ago
5 Up Delta Bars followed by 1 Down Delta Bar. This chart was uploaded by Investor/RT 15.1.1 showing symbol: @ES#. |
View |
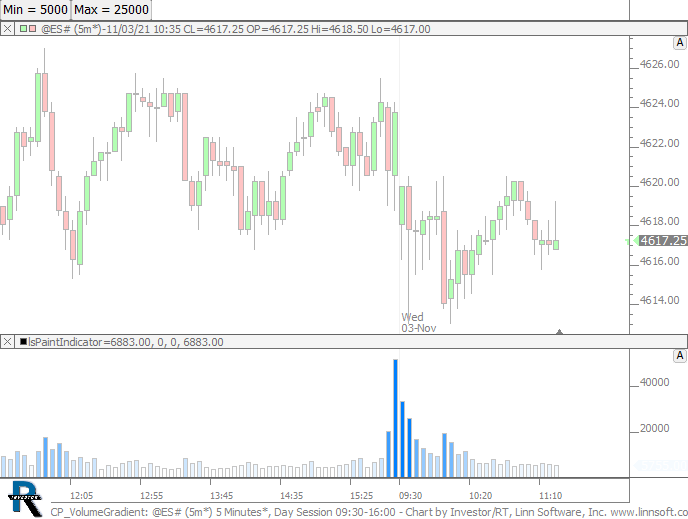 |
CP VolumeGradient (@ES#) cpayne [totalcount]
3 years 5 months ago
This chart was uploaded by Investor/RT 15.1.1 showing symbol: @ES#. |
View |
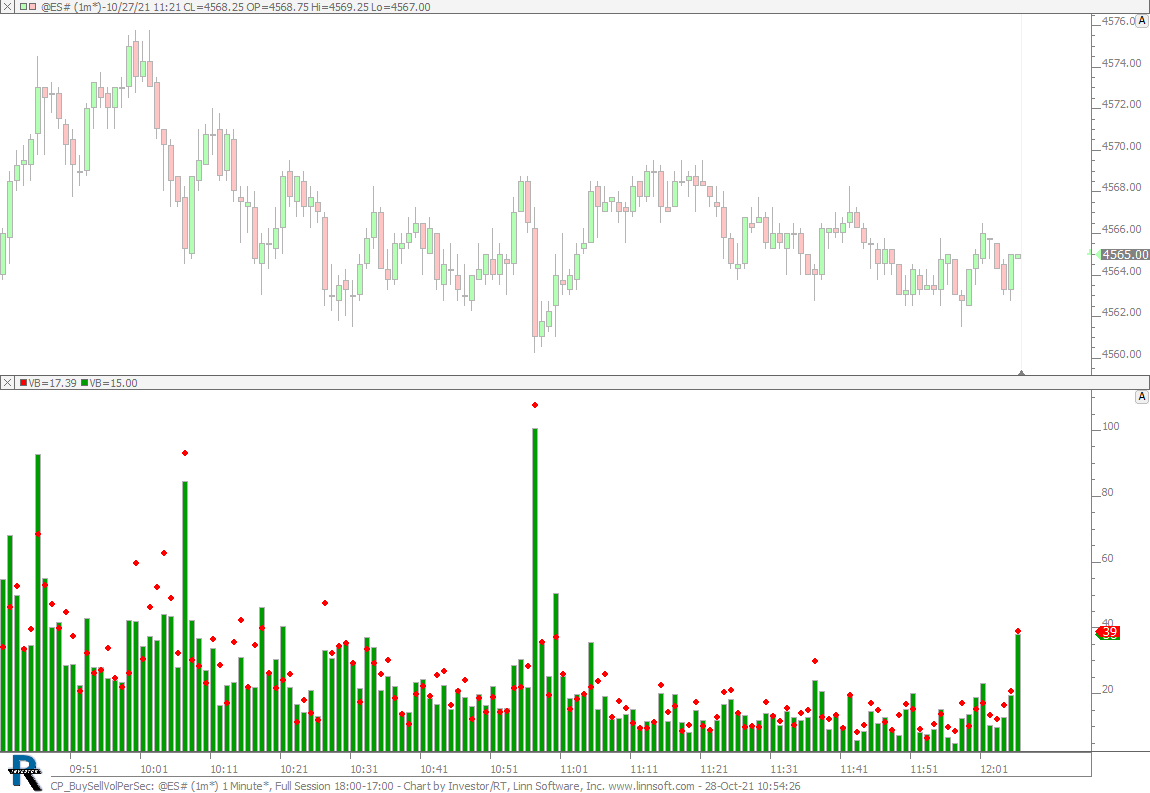 |
CP BuySellVolPerSec (@ES#) cpayne [totalcount]
3 years 6 months ago
This chart was uploaded by Investor/RT 15.1.1 showing symbol: @ES#. |
View |
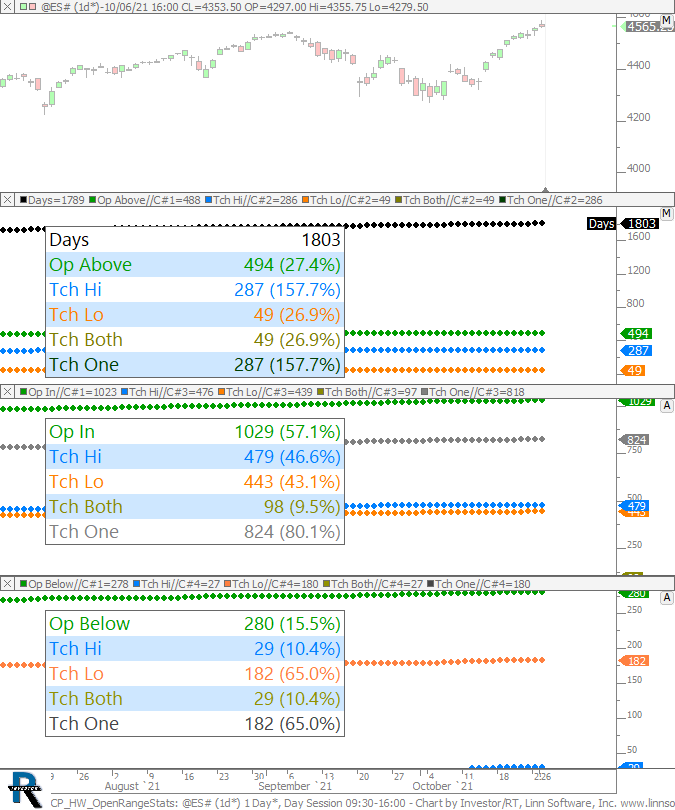 |
CP HW OpenRangeStats (@ES#) cpayne [totalcount]
3 years 6 months ago
This chart was uploaded by Investor/RT 15.1.1 showing symbol: @ES#. |
View |
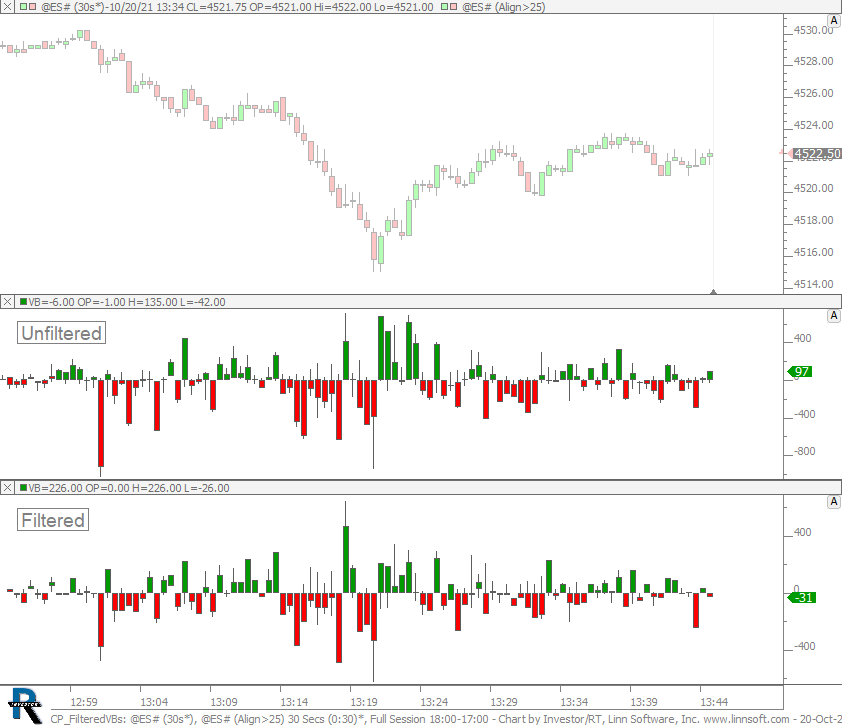 |
CP FilteredVBs (@ES#) cpayne [totalcount]
3 years 6 months ago
This chart was uploaded by Investor/RT 15.1.1 showing symbol: @ES#. |
View |
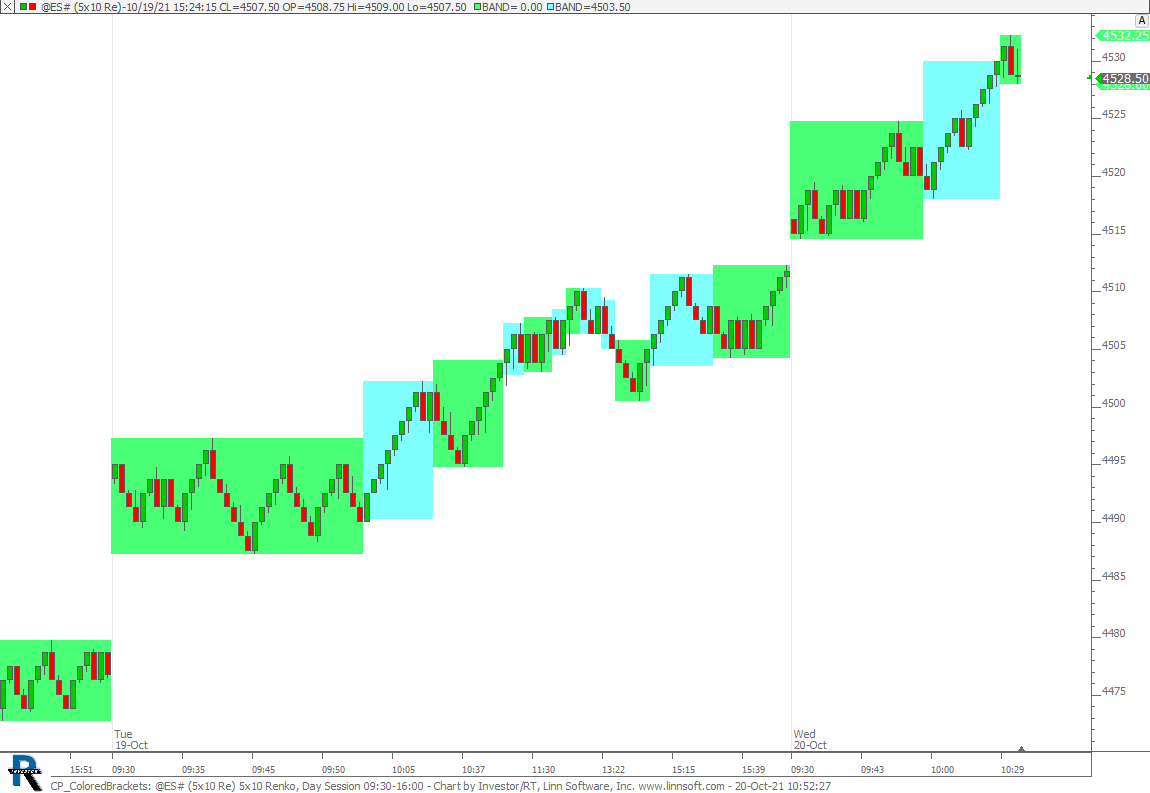 |
CP ColoredBrackets (@ES#) cpayne [totalcount]
3 years 6 months ago
This chart was uploaded by Investor/RT 15.1.1 showing symbol: @ES#. |
View |
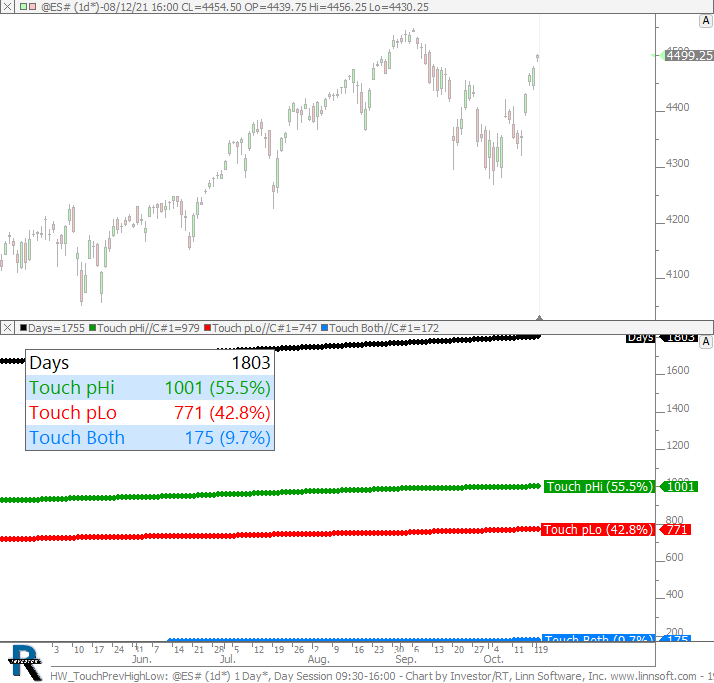 |
HW TouchPrevHighLow (@ES#) cpayne [totalcount]
3 years 6 months ago
How often did we touch previous days high, low, or both looking at the ES Day Session only. This chart was uploaded by Investor/RT 15.1.1 showing symbol: @ES#. |
View |
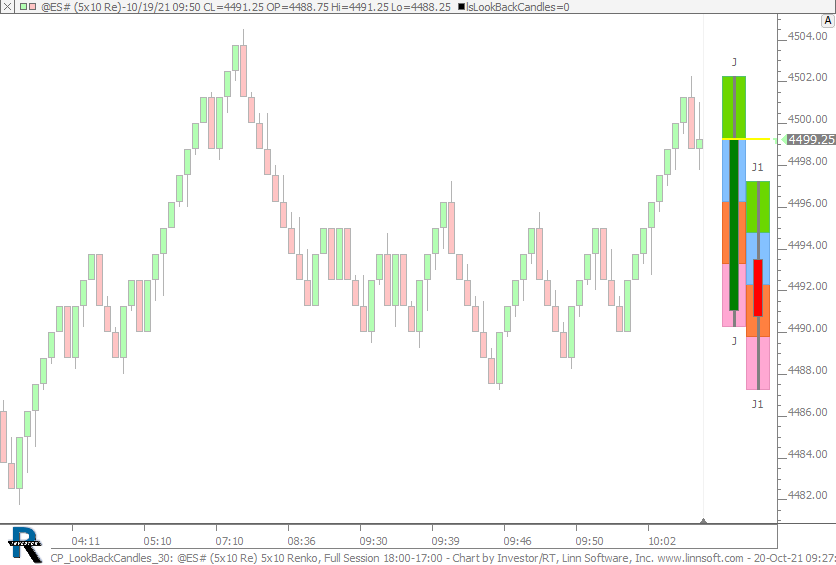 |
CP LookBackCandles 30 (@ES#) cpayne [totalcount]
3 years 6 months ago
LookBackCandles - 30 Minutes. This chart was uploaded by Investor/RT 15.1.1 showing symbol: @ES#. |
View |
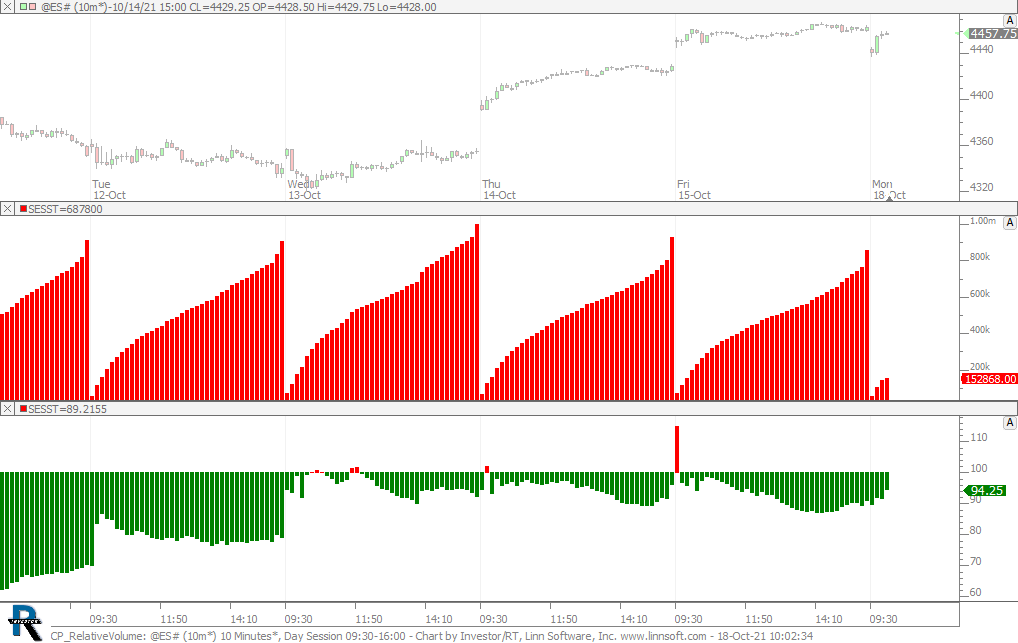 |
CP RelativeVolume (@ES#) cpayne [totalcount]
3 years 6 months ago
Relative Volume. This chart was uploaded by Investor/RT 14.1.7 showing symbol: @ES#. |
View |
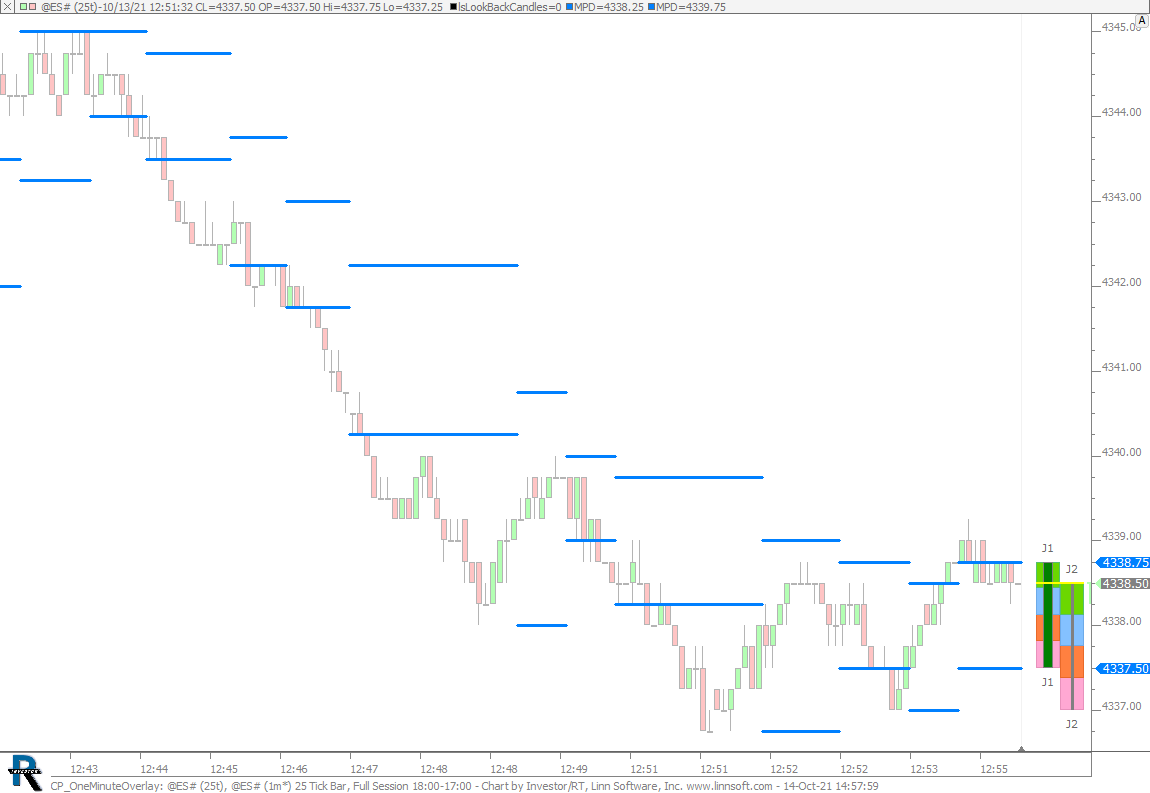 |
CP OneMinuteOverlay (@ES#) cpayne [totalcount]
3 years 6 months ago
This chart was uploaded by Investor/RT 15.1.1 showing symbol: @ES#. |
View |
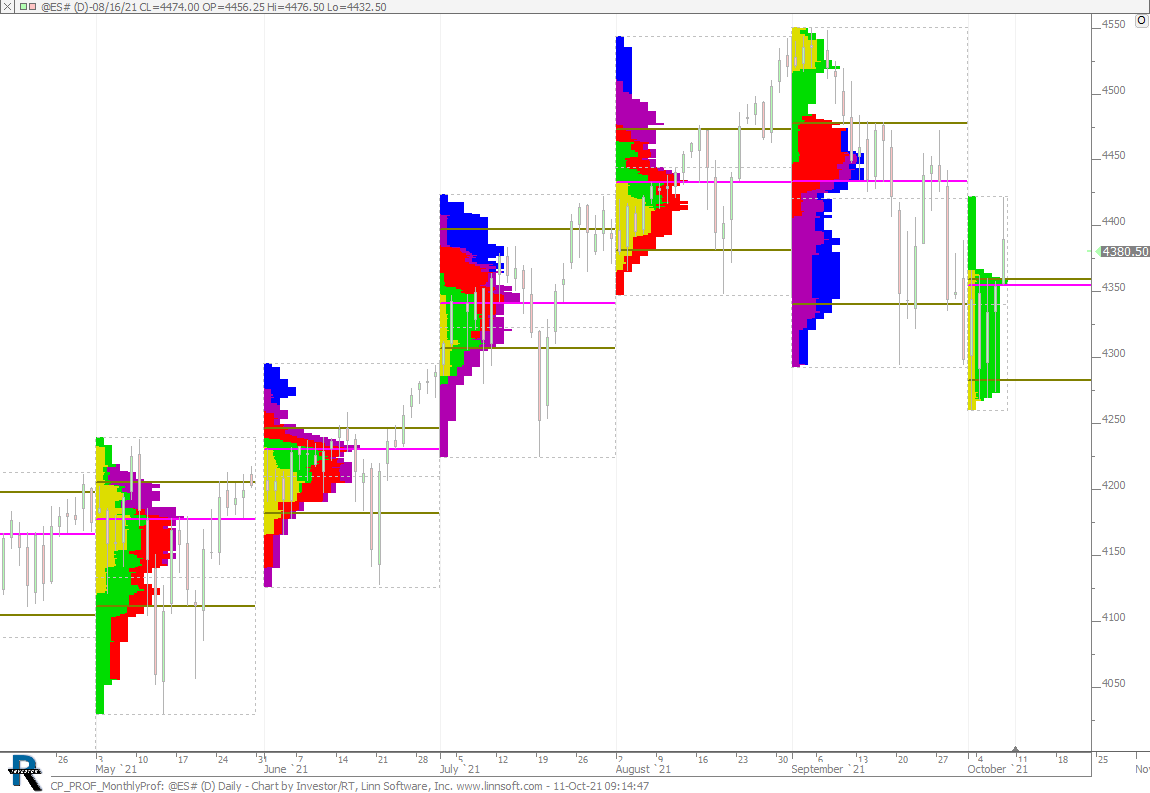 |
CP PROF MonthlyProf (@ES#) cpayne [totalcount]
3 years 6 months ago
This chart was uploaded by Investor/RT 15.1.1 showing symbol: @ES#. |
View |
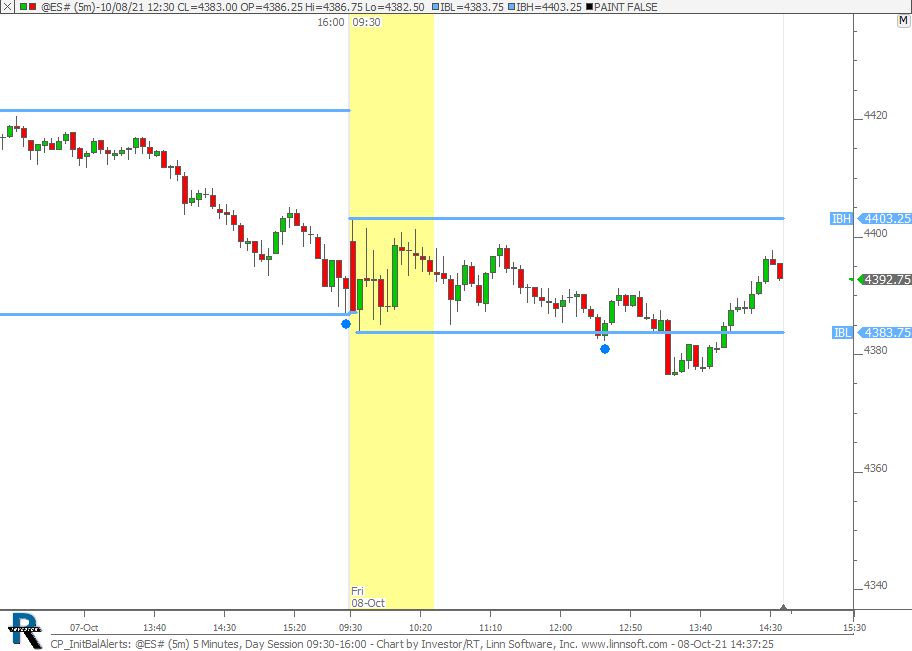 |
CP InitBalAlerts (@ES#) cpayne [totalcount]
3 years 6 months ago
Initial Balance Break Alert. This chart was uploaded by Investor/RT 15.1.1 showing symbol: @ES#. |
View |
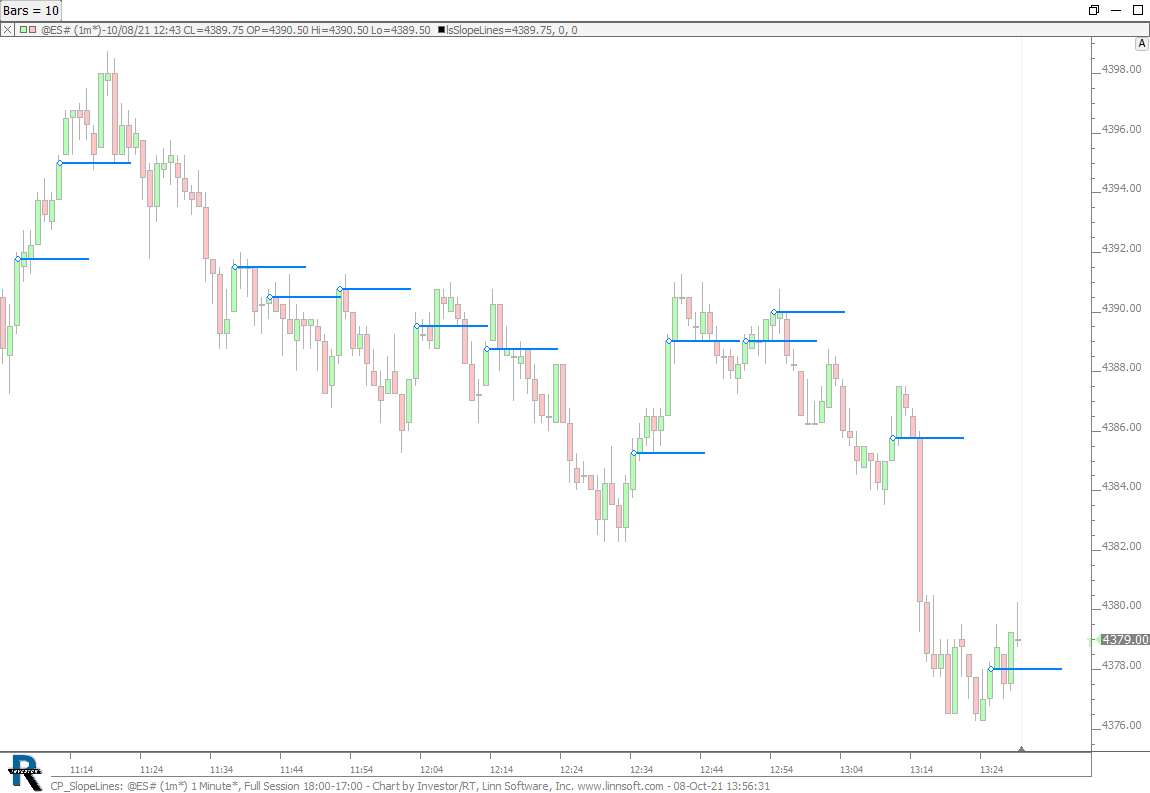 |
CP SlopeLines (@ES#) cpayne [totalcount]
3 years 6 months ago
This chart was uploaded by Investor/RT 15.1.1 showing symbol: @ES#. |
View |
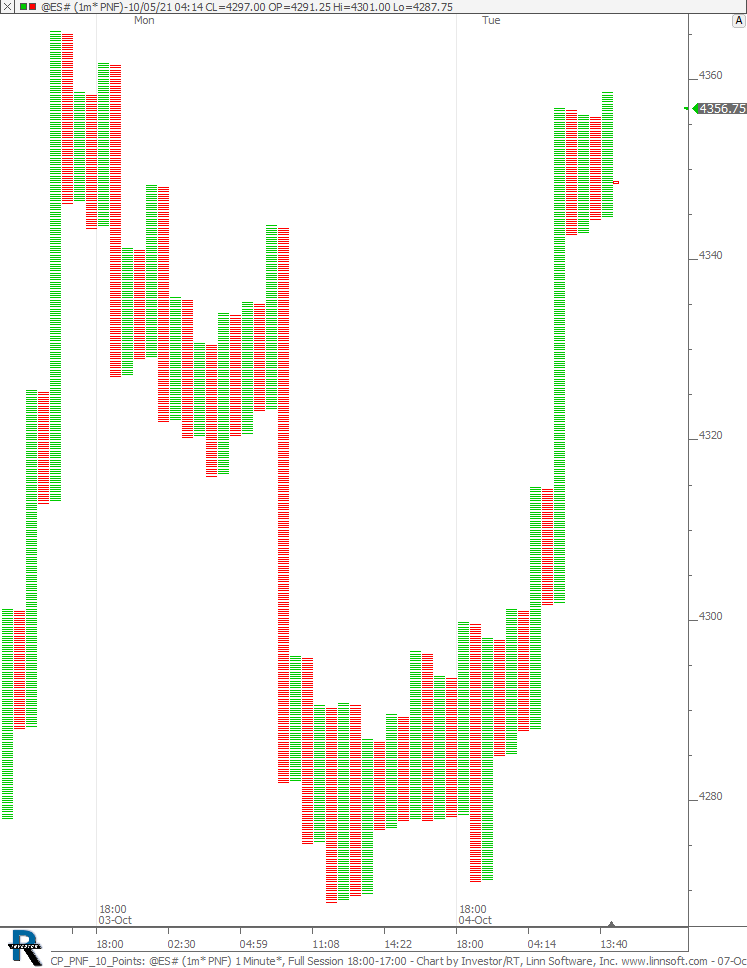 |
CP PNF 10 Points (@ES#) cpayne [totalcount]
3 years 6 months ago
This chart was uploaded by Investor/RT 15.1.1 showing symbol: @ES#. |
View |
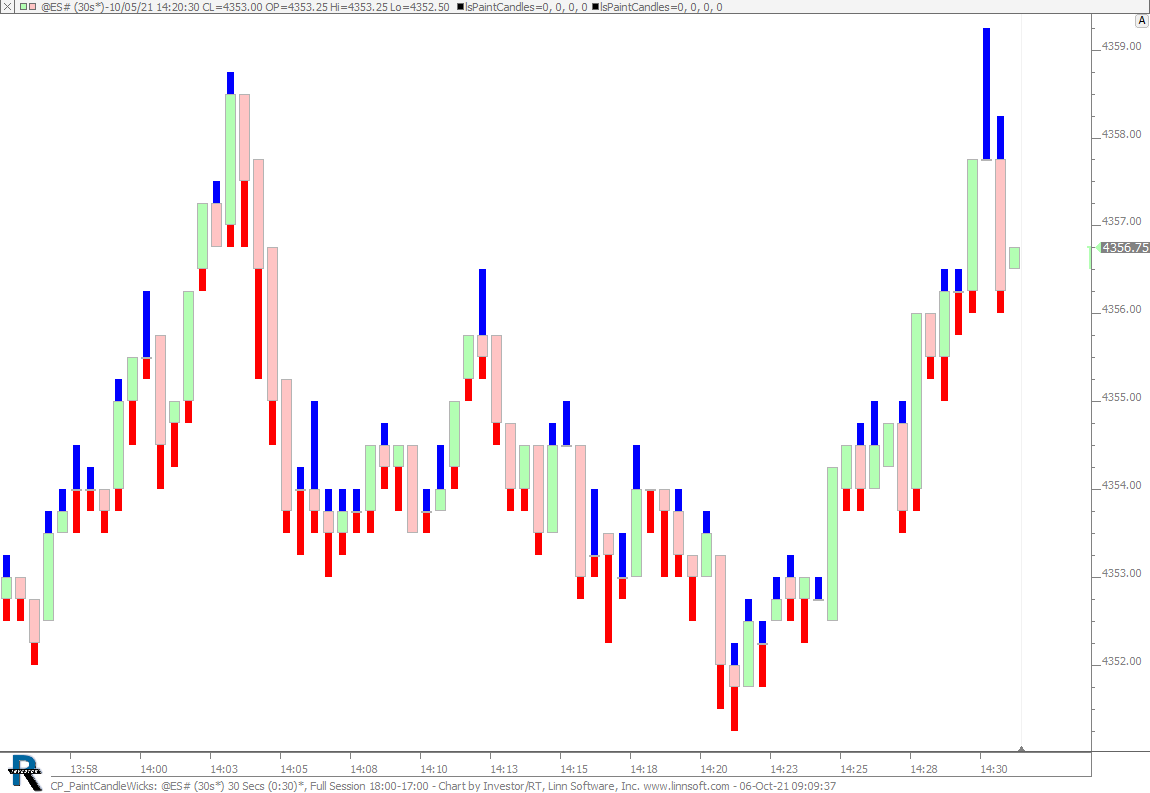 |
CP PaintCandleWicks (@ES#) cpayne [totalcount]
3 years 6 months ago
This chart was uploaded by Investor/RT 15.1.1 showing symbol: @ES#. |
View |
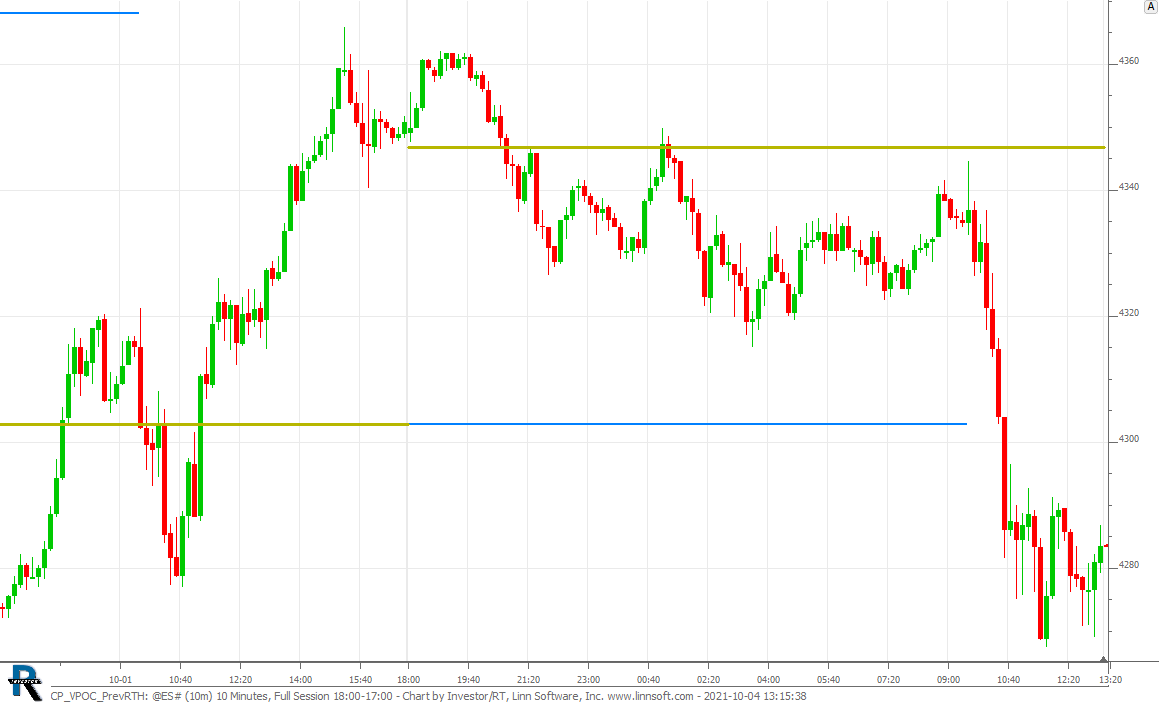 |
CP VPOC PrevRTH (@ES#) cpayne [totalcount]
3 years 6 months ago
RTH and Fulll Session VPOC from Prev Day. This chart was uploaded by Investor/RT 15.1.1 showing symbol: @ES#. |
View |
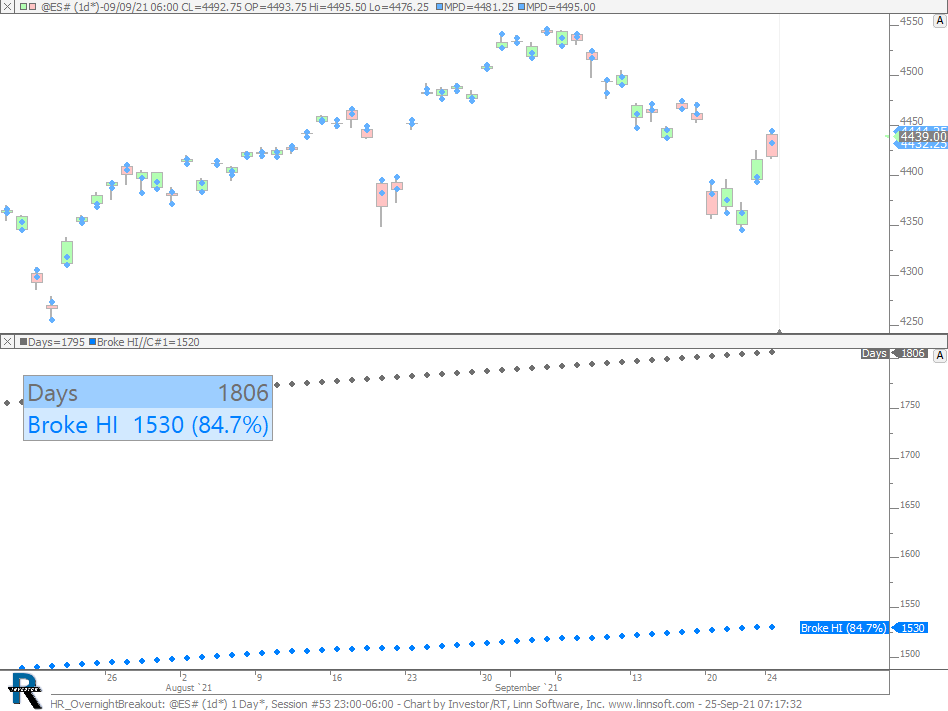 |
HR OvernightBreakout (@ES#) cpayne [totalcount]
3 years 7 months ago
This chart was uploaded by Investor/RT 15.1.1 showing symbol: @ES#. |
View |
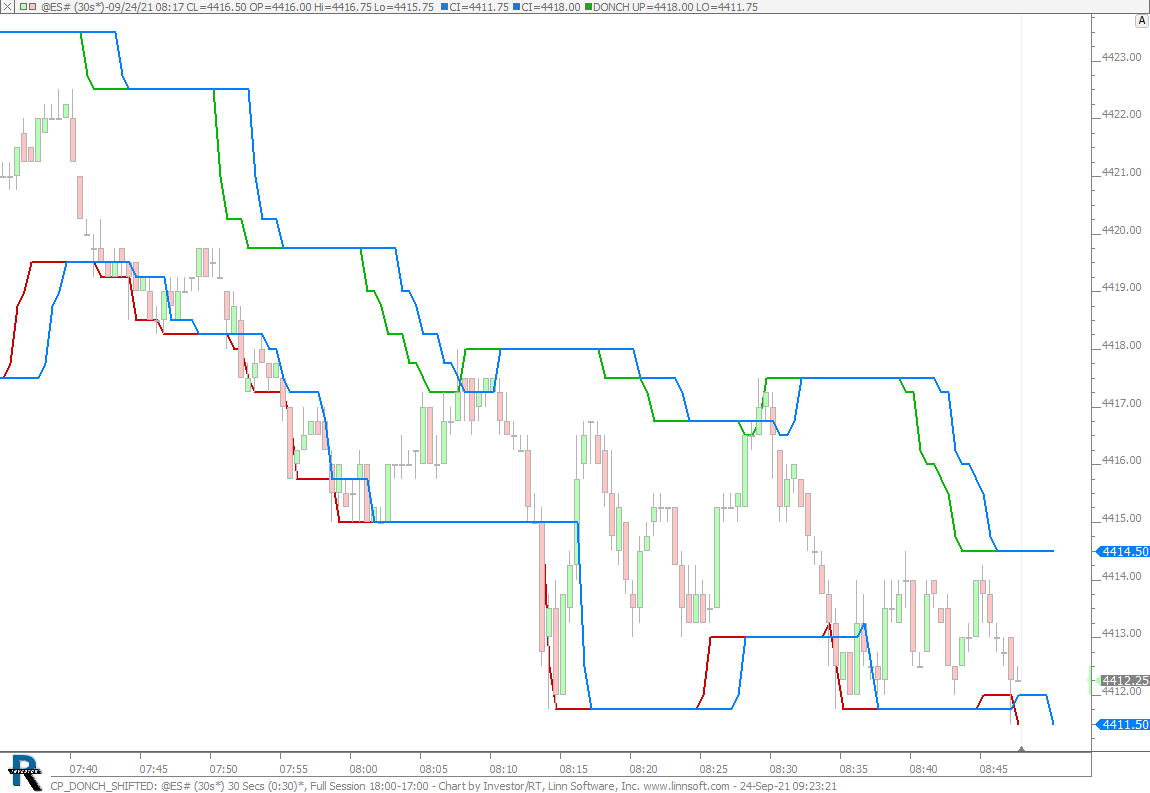 |
CP DONCH SHIFTED (@ES#) cpayne [totalcount]
3 years 7 months ago
Donchian Shifted Right 5 Bars. This chart was uploaded by Investor/RT 15.1.1 showing symbol: @ES#. |
View |