 |
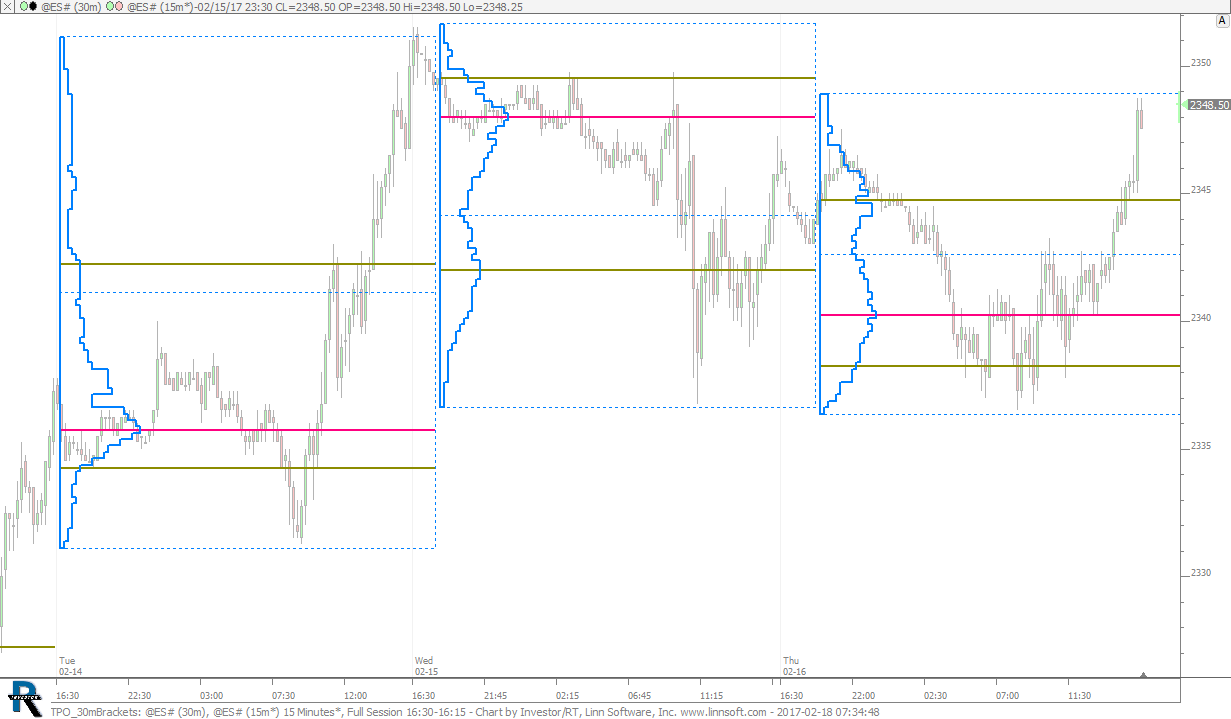
TPO 30mBrackets (@ES#) cpayne [totalcount]
8 years 2 months ago
30m Bracket TPO plotted on 15 minute bars. This chart was uploaded by Investor/RT 12.7.1 showing symbol: @ES#. |
View |
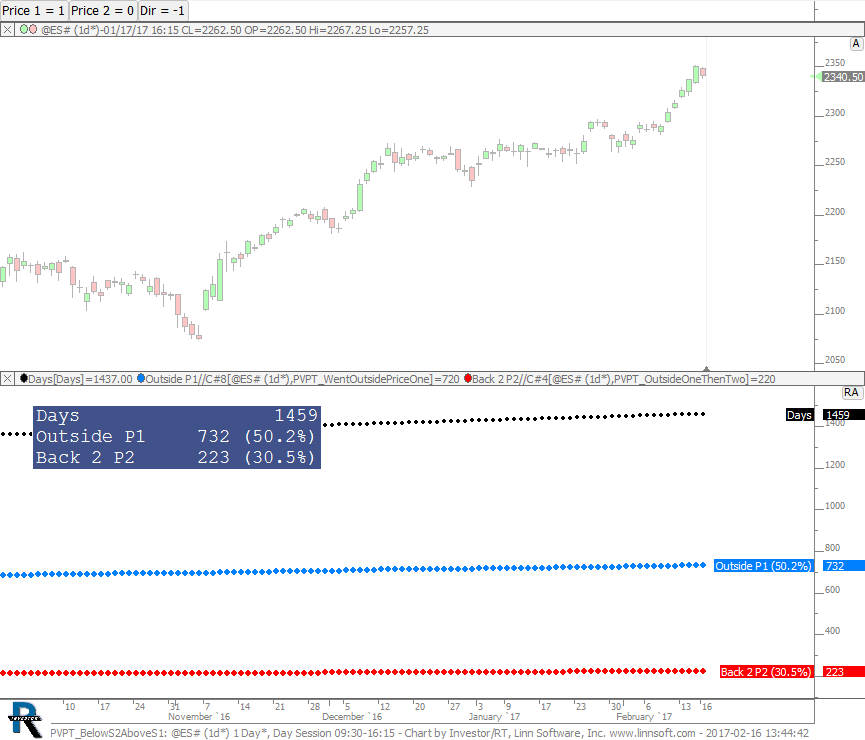 |
PVPT BelowS2AboveS1 (@ES#) cpayne [totalcount]
8 years 2 months ago
Pivot Point - Below S2 then Above S1. This chart was uploaded by Investor/RT 12.7.1 showing symbol: @ES#. |
View |
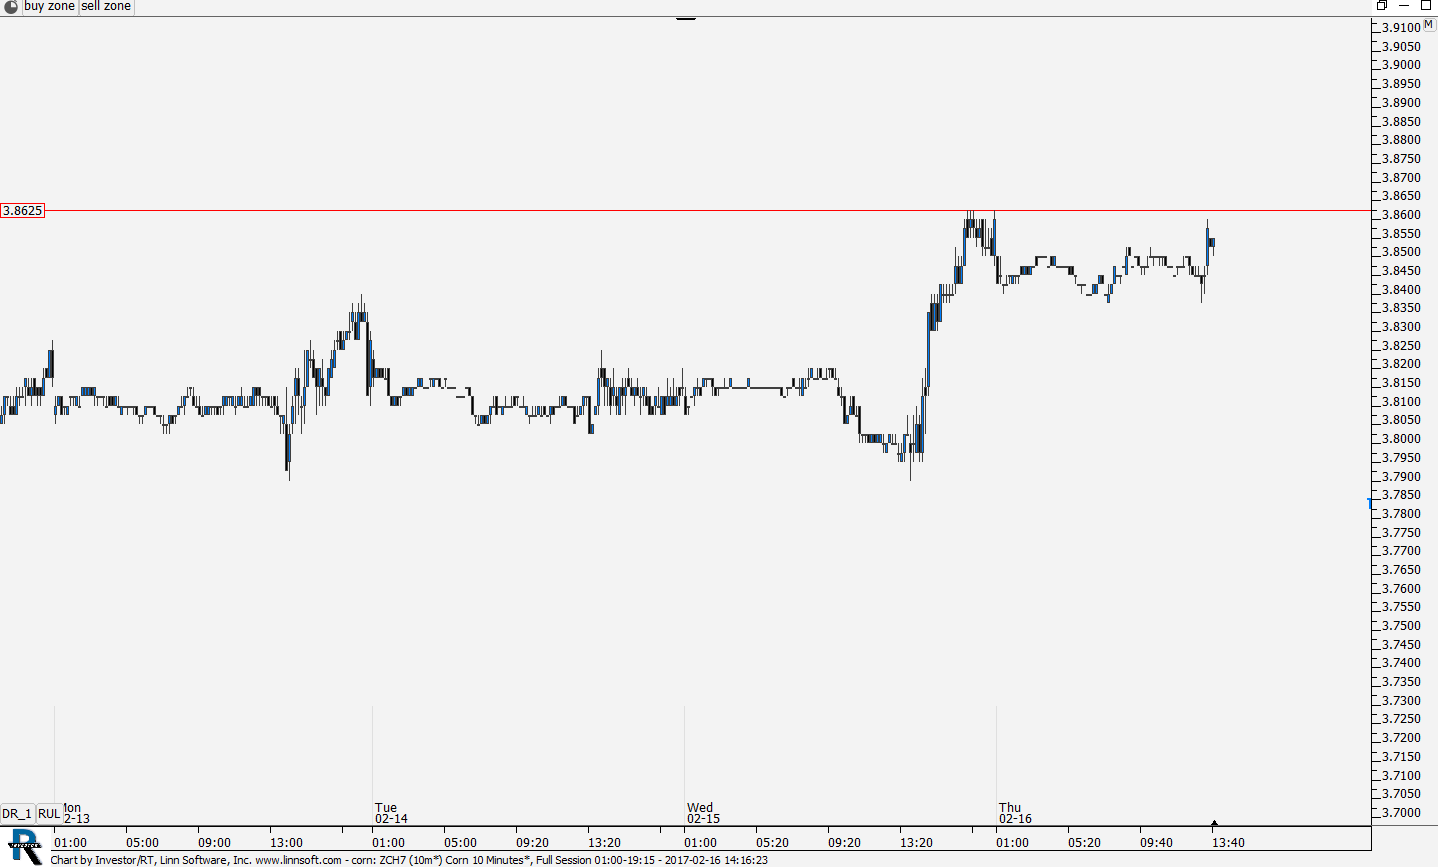 |
corn (ZCH7) adrianfaiers [totalcount]
8 years 2 months ago
adeyf as per forum post. This chart was uploaded by Investor/RT 12.7.1 showing symbol: ZCH7. |
View |
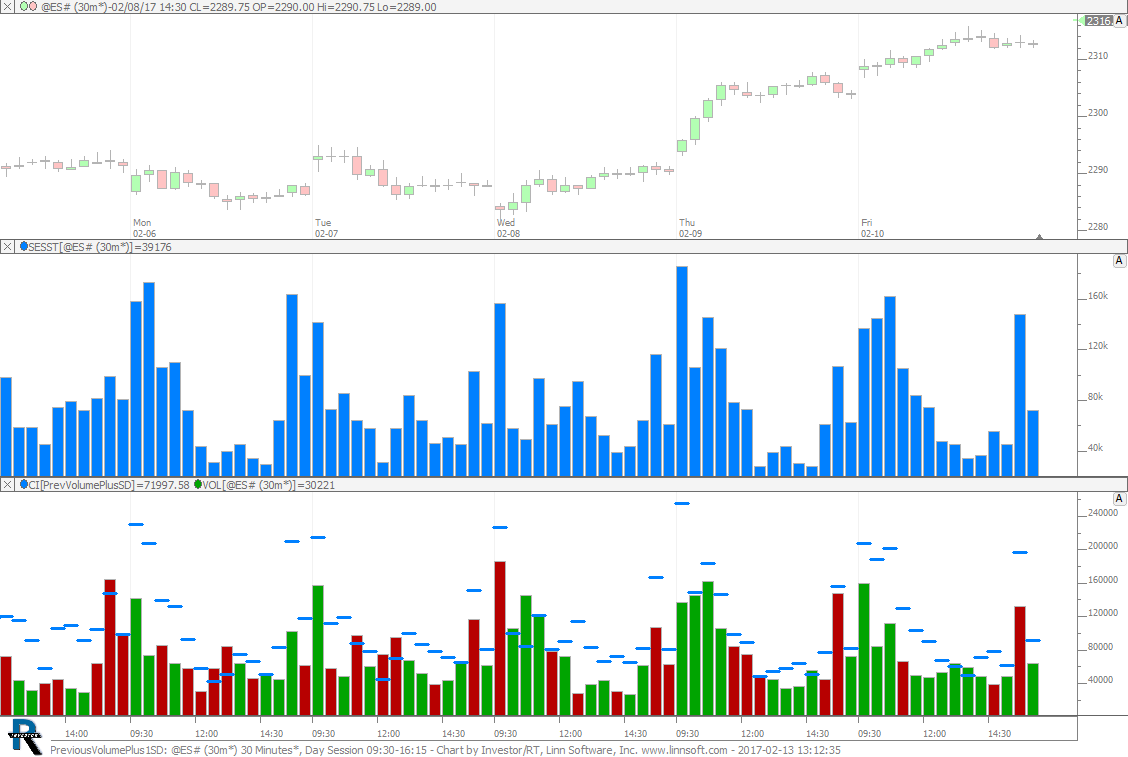 |
PreviousVolumePlus1SD (@ES#) cpayne [totalcount]
8 years 2 months ago
Previous Volume (Time of Day) Plus One Standard Deviation. This chart was uploaded by Investor/RT 12.7.1 showing symbol: @ES#. |
View |
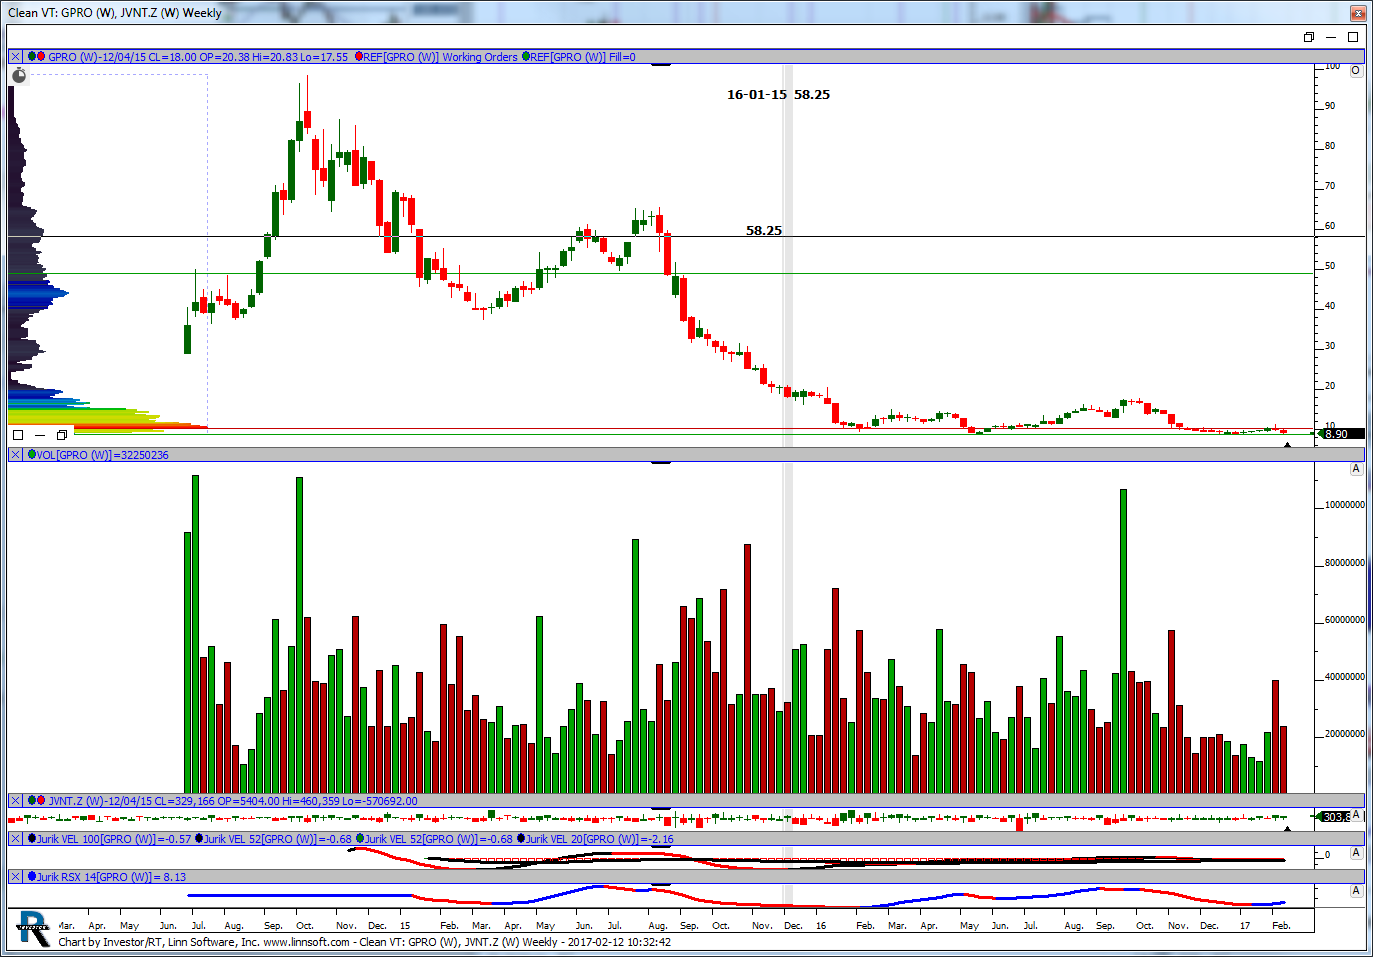 |
Clean VT (GPRO) justin-detray [totalcount]
8 years 2 months ago
This chart was uploaded by Investor/RT 12.6.8 showing symbol: GPRO. |
View |
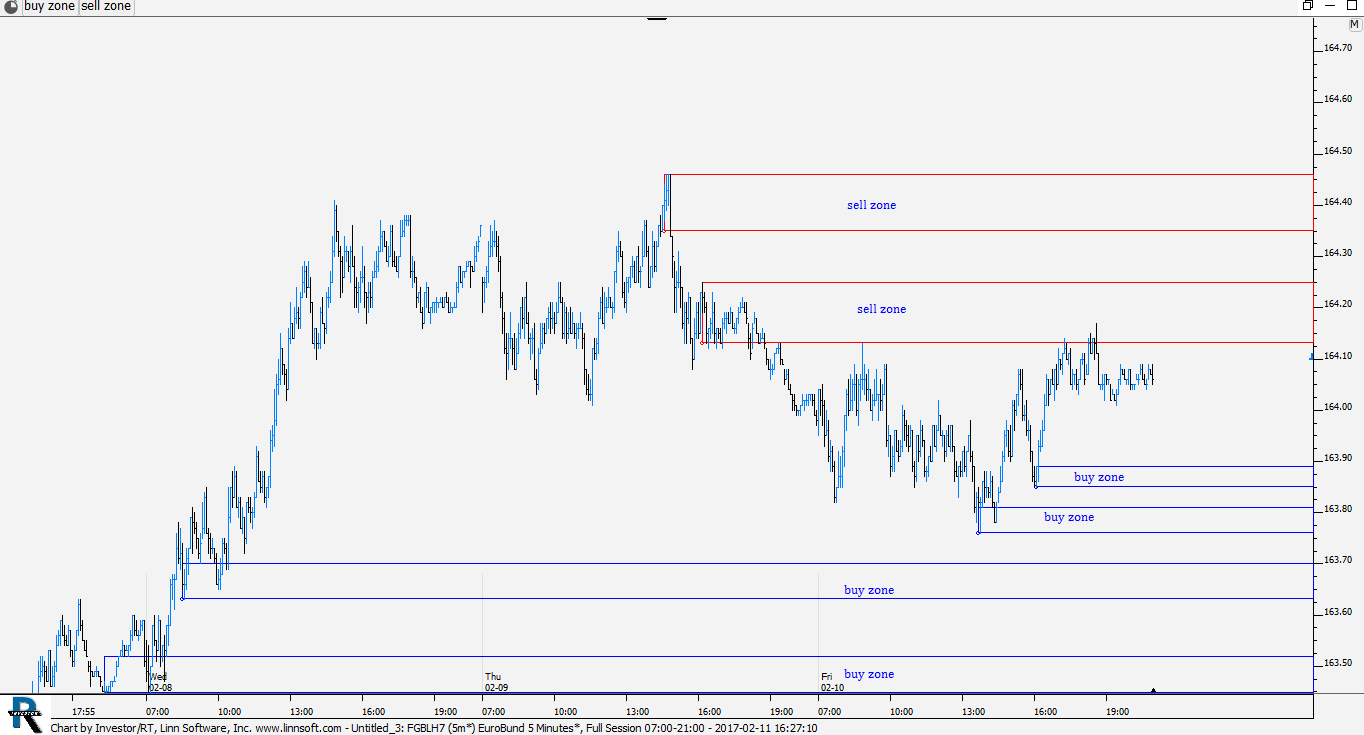 |
Untitled (FGBLH7) adrianfaiers [totalcount]
8 years 2 months ago
adeyf as per forum post. This chart was uploaded by Investor/RT 12.7.1 showing symbol: FGBLH7. |
View |
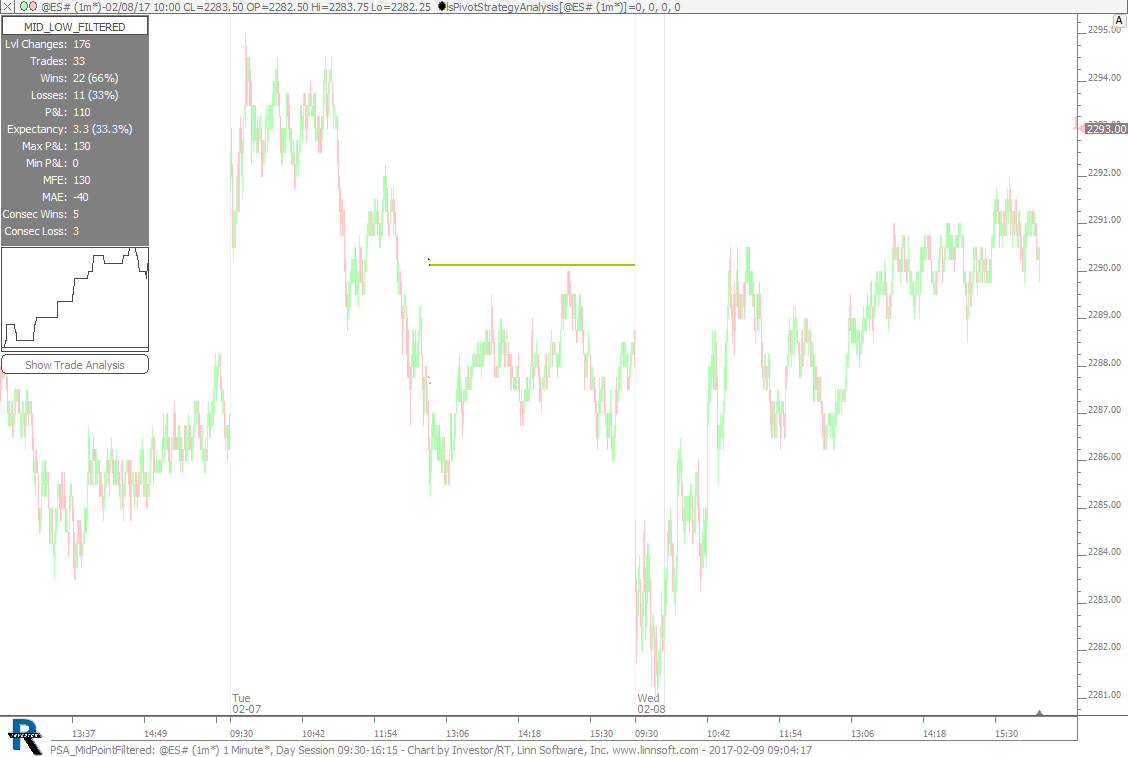 |
PSA MidPointFiltered (@ES#) cpayne [totalcount]
8 years 2 months ago
PSA - Midpoint approached from 2xIBL. This chart was uploaded by Investor/RT 12.7.1 showing symbol: @ES#. |
View |
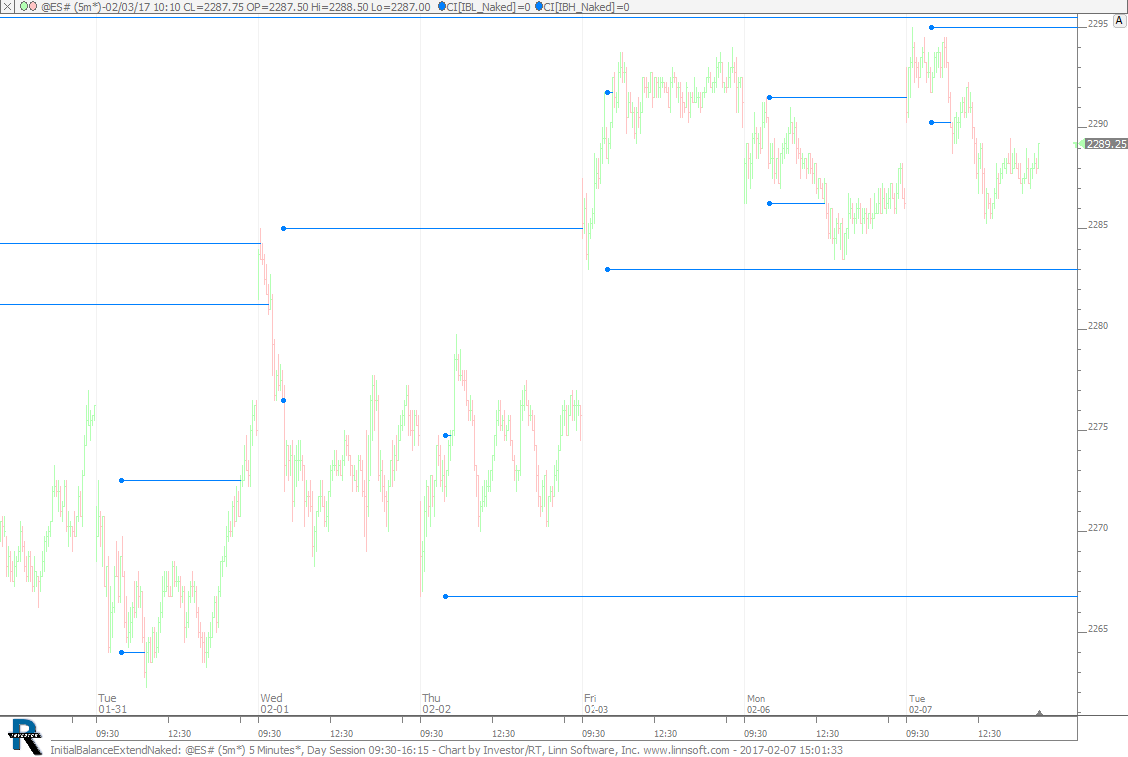 |
InitialBalanceExtendNaked (@ES#) cpayne [totalcount]
8 years 2 months ago
Naked Initial Balance Extension. This chart was uploaded by Investor/RT 12.7.1 showing symbol: @ES#. |
View |
 |
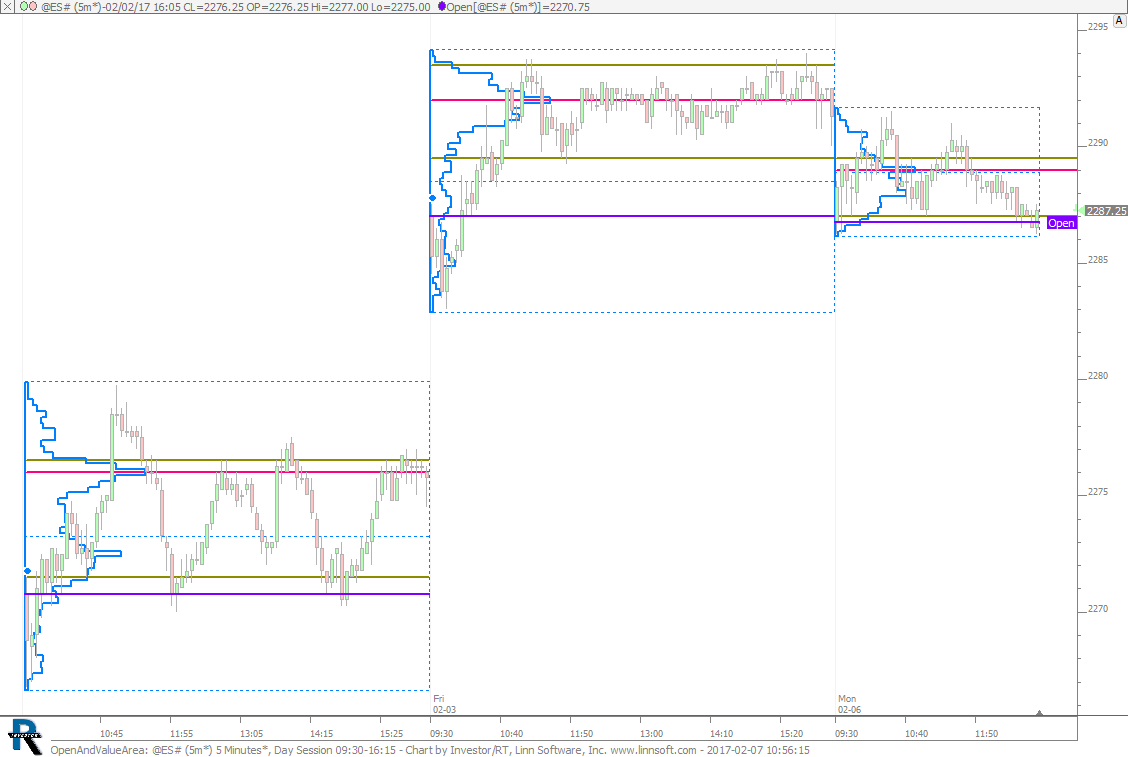
OpenAndValueArea (@ES#) scooke [totalcount]
8 years 2 months ago
This chart was uploaded by Investor/RT 12.7.1 showing symbol: @ES#. |
View |
 |
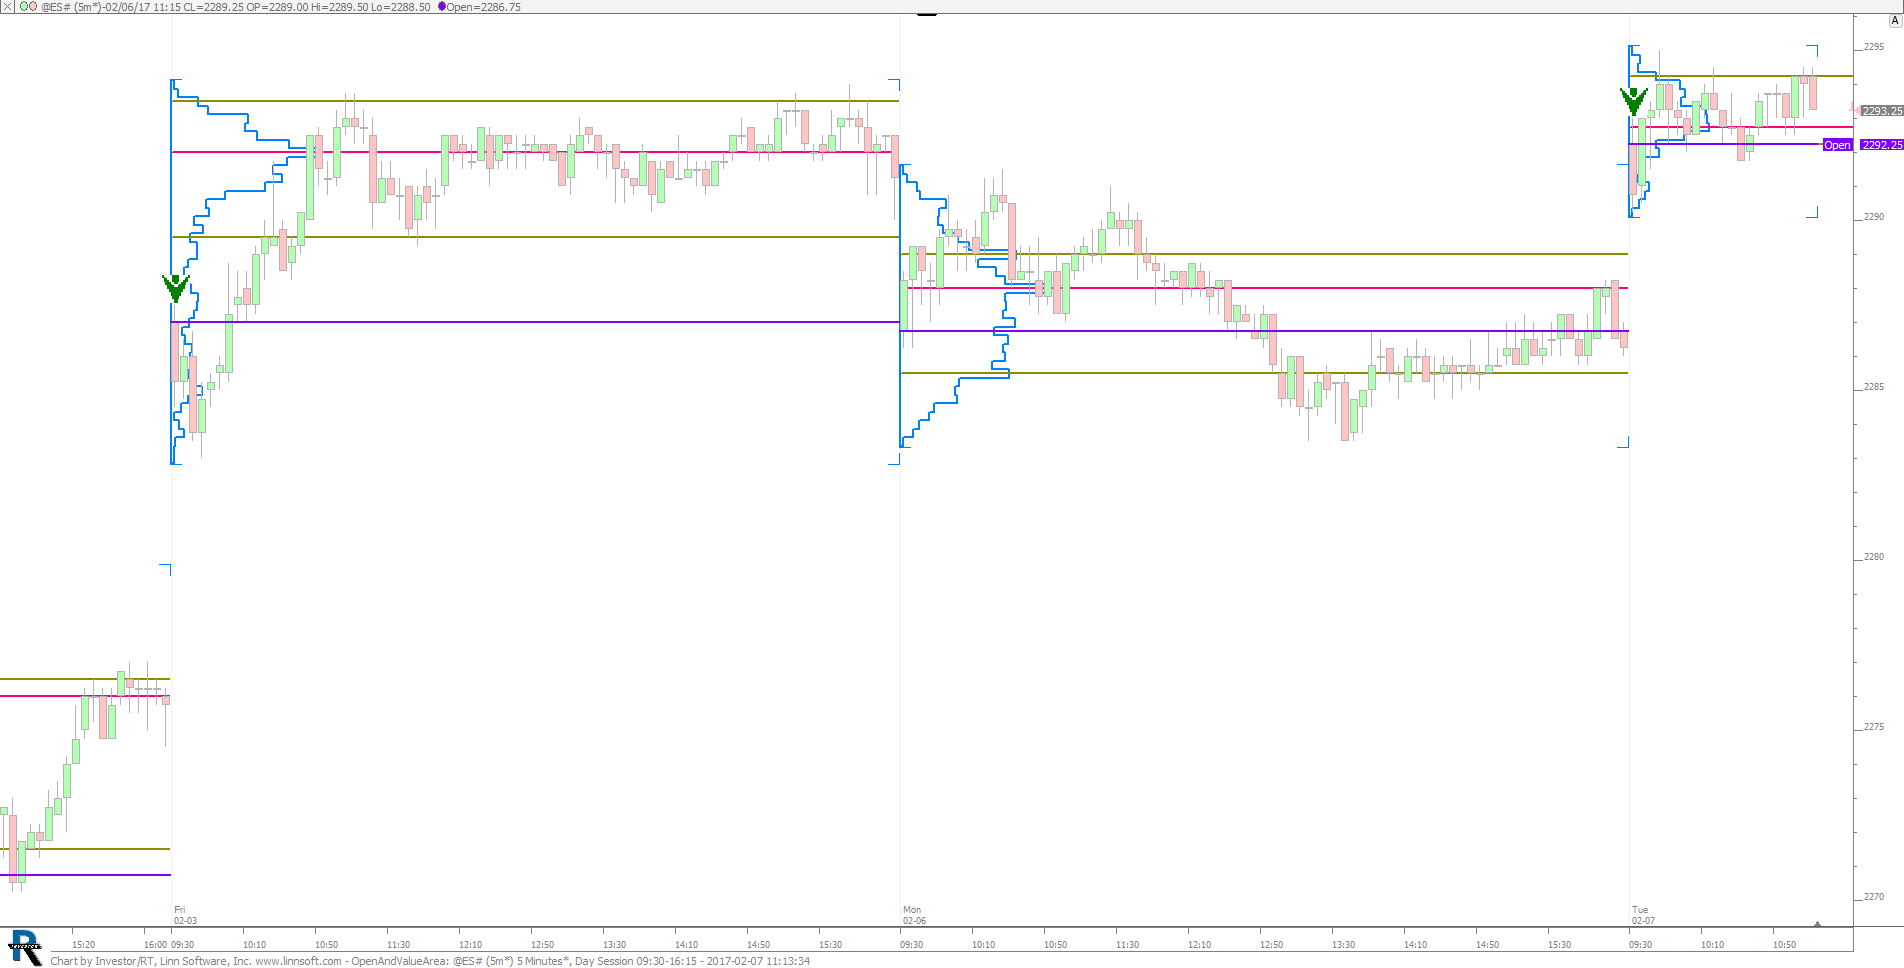
OpenAndValueArea (@ES#) cpayne [totalcount]
8 years 2 months ago
Open Relative to VAH / VAL. This chart was uploaded by Investor/RT 12.7.1 showing symbol: @ES#. |
View |
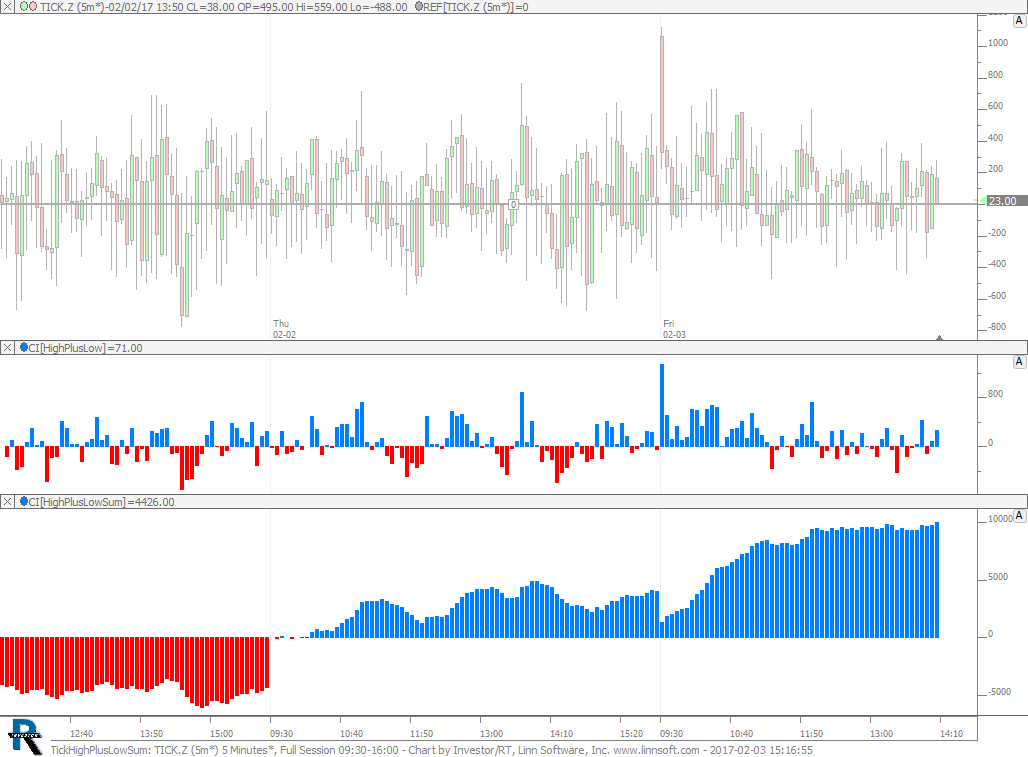 |
TickHighPlusLowSum (TICK.Z) cpayne [totalcount]
8 years 2 months ago
Tick High Plus Low Summed. This chart was uploaded by Investor/RT 12.7.1 showing symbol: TICK.Z. |
View |
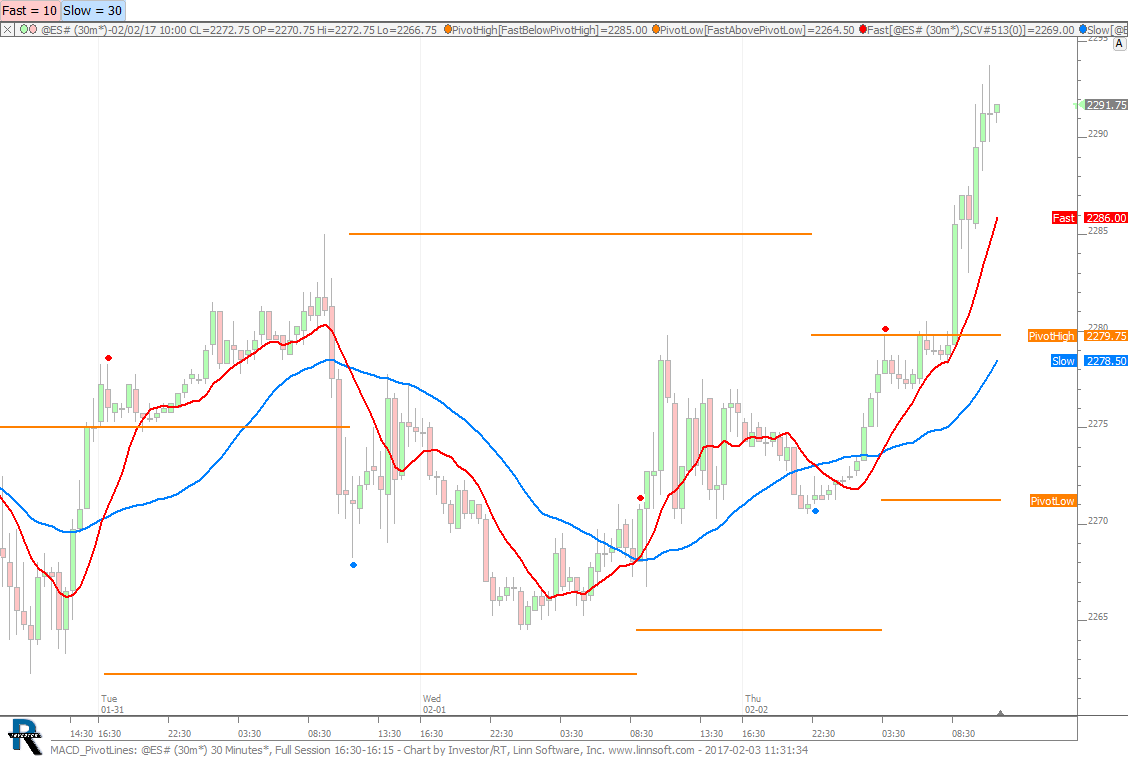 |
MACD PivotLines (@ES#) cpayne [totalcount]
8 years 2 months ago
MACD Pivot Lines. This chart was uploaded by Investor/RT 12.7.1 showing symbol: @ES#. |
View |
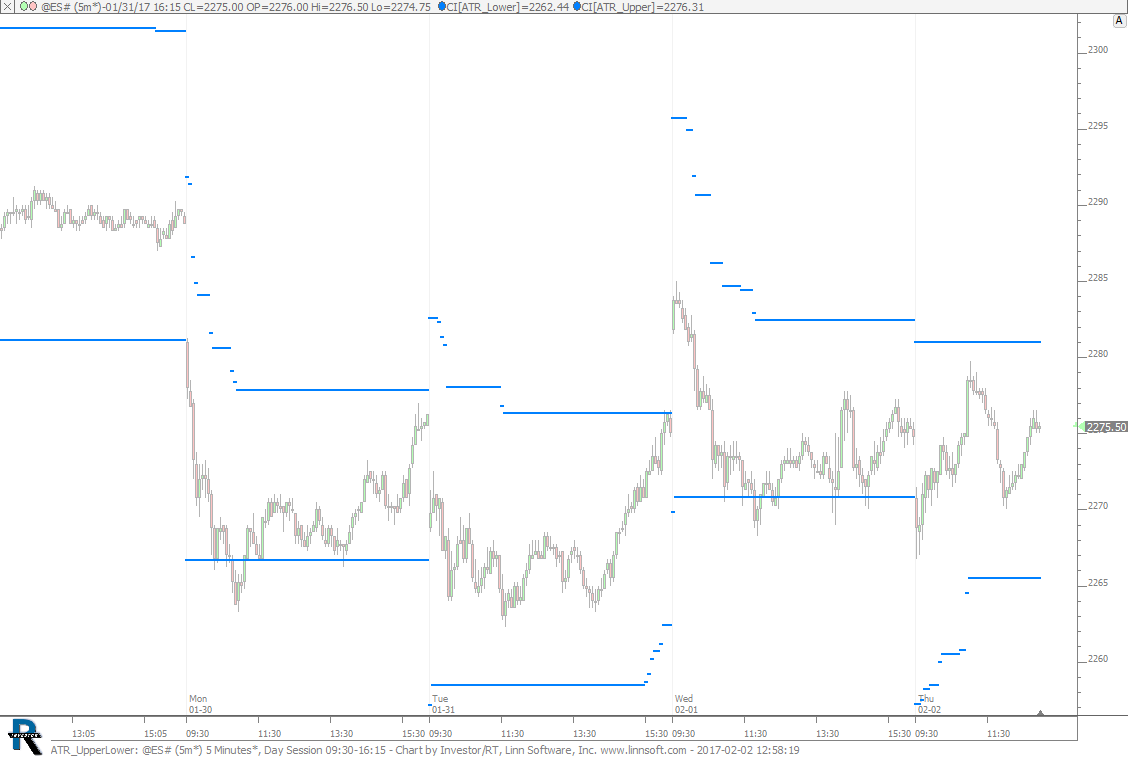 |
ATR UpperLower (@ES#) cpayne [totalcount]
8 years 2 months ago
ATR Upper and Lower Bands. This chart was uploaded by Investor/RT 12.7.1 showing symbol: @ES#. |
View |
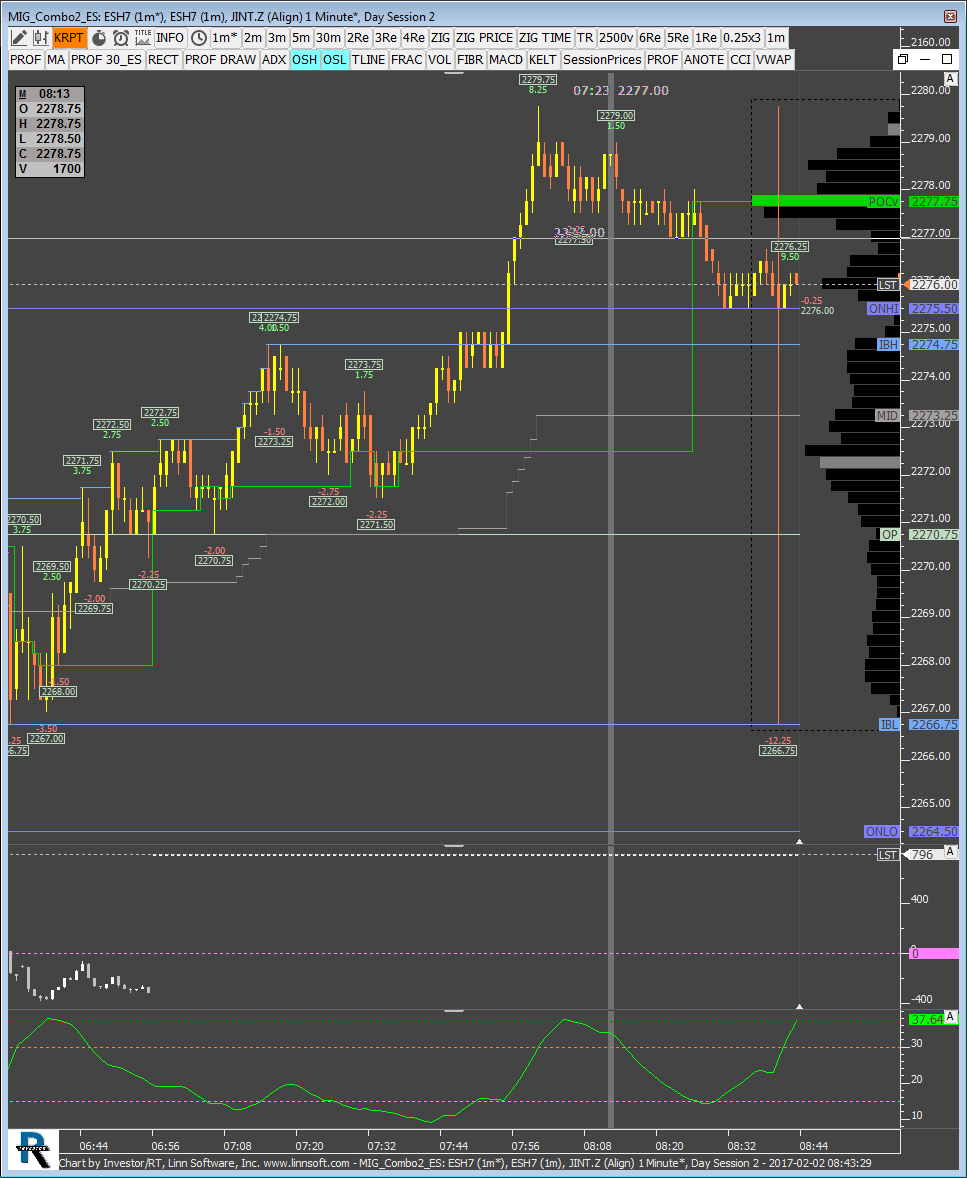 |
MIG Combo2 ES (ESH7) MPTrader [totalcount]
8 years 2 months ago
When I do a download - this happens ALL THE TIME. This chart was uploaded by Investor/RT 12.6.8 showing symbol: ESH7. |
View |
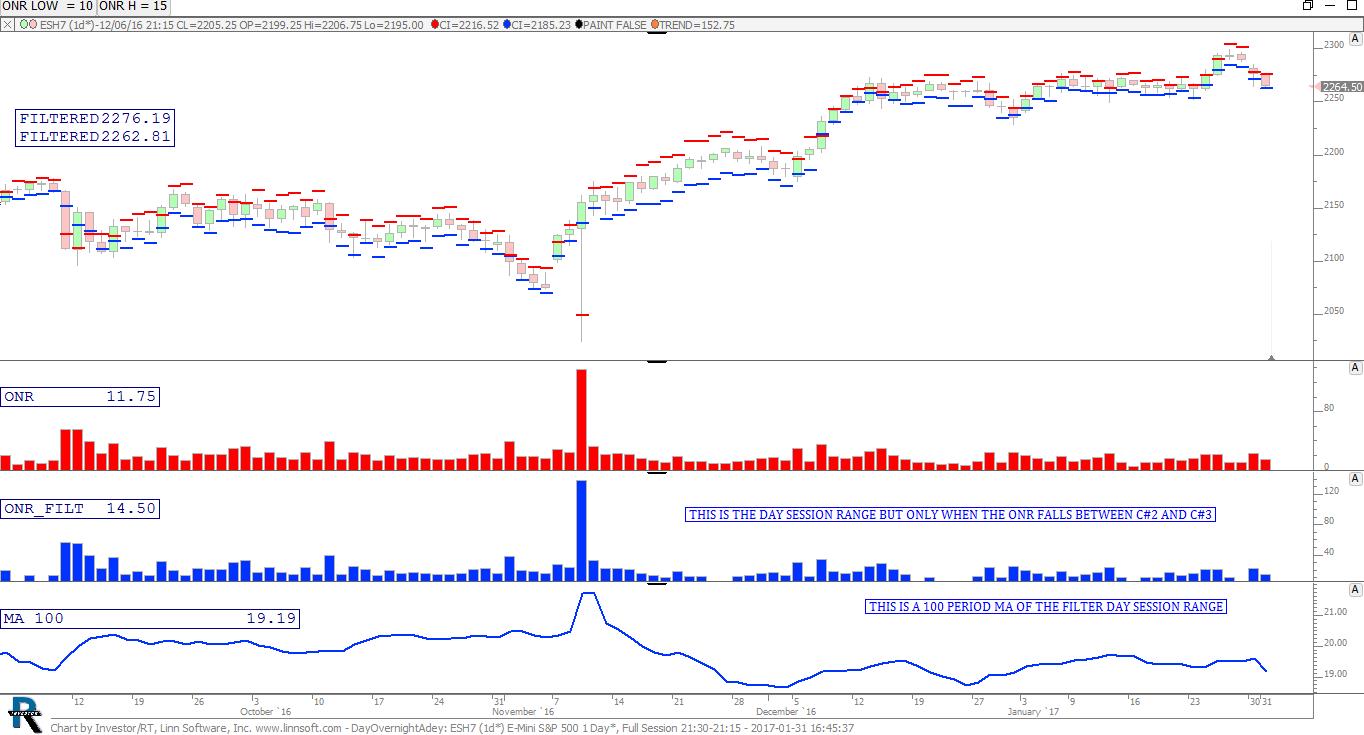 |
DayOvernightAdey (ESH7) adrianfaiers [totalcount]
8 years 2 months ago
adeyf as per forum post. This chart was uploaded by Investor/RT 12.7.1 showing symbol: ESH7. |
View |
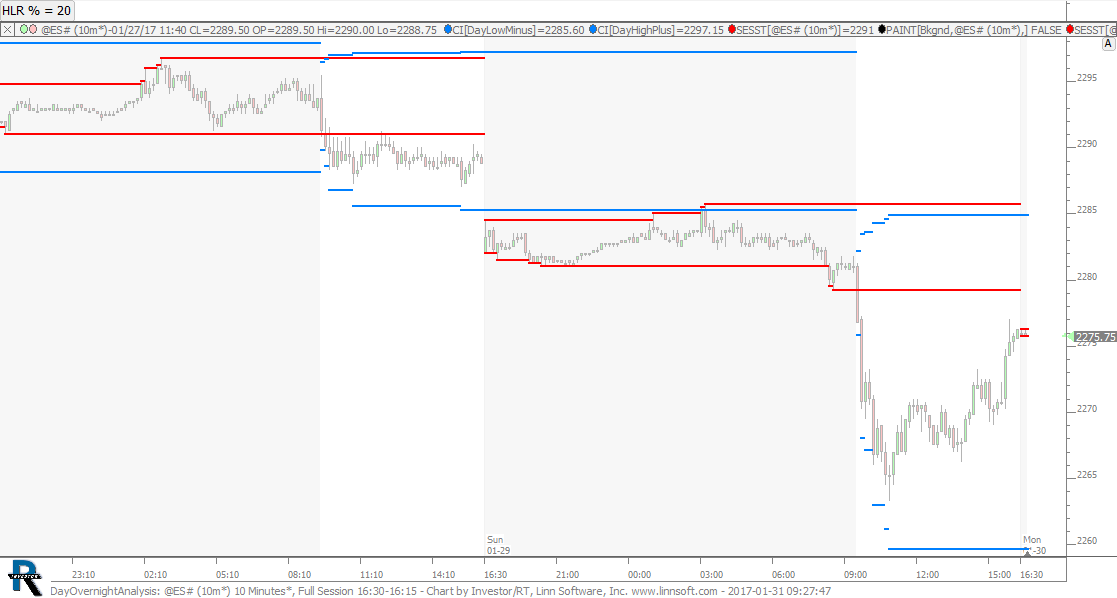 |
DayOvernightAnalysis (@ES#) cpayne [totalcount]
8 years 2 months ago
Day and Overnight Analysis. This chart was uploaded by Investor/RT 12.7.1 showing symbol: @ES#. |
View |
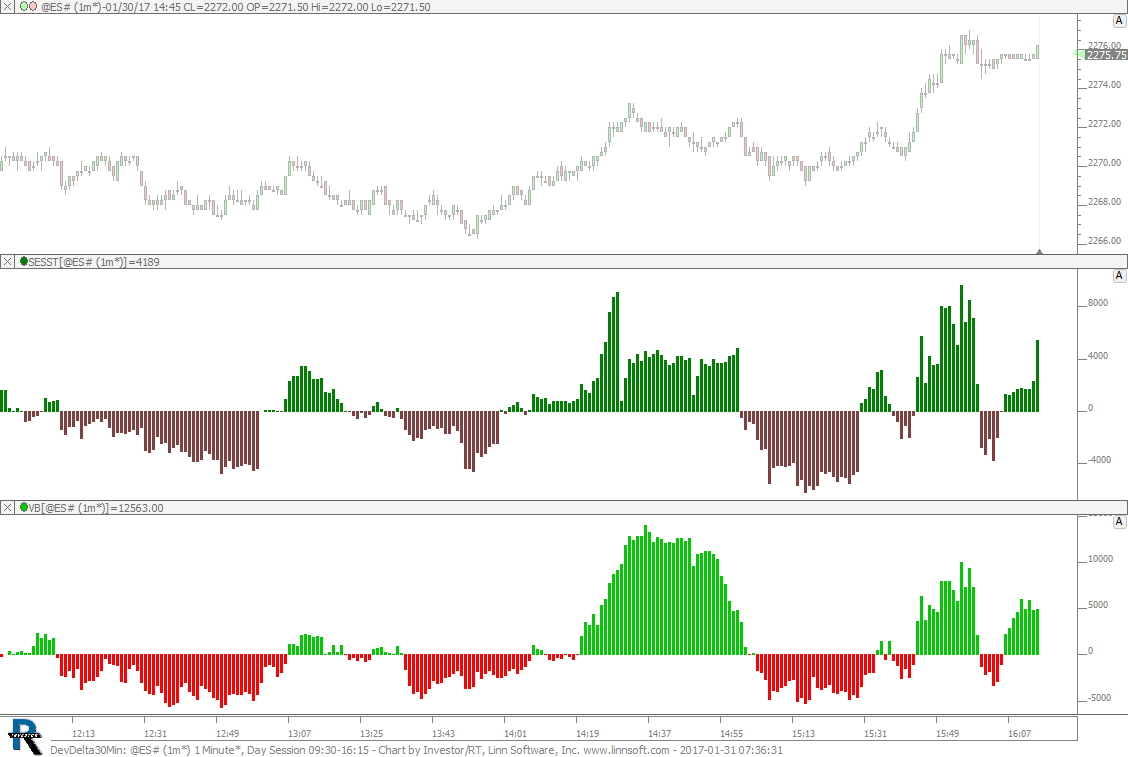 |
DevDelta30Min (@ES#) cpayne [totalcount]
8 years 2 months ago
Developing Delta 30 Minute Periods. This chart was uploaded by Investor/RT 12.7.1 showing symbol: @ES#. |
View |
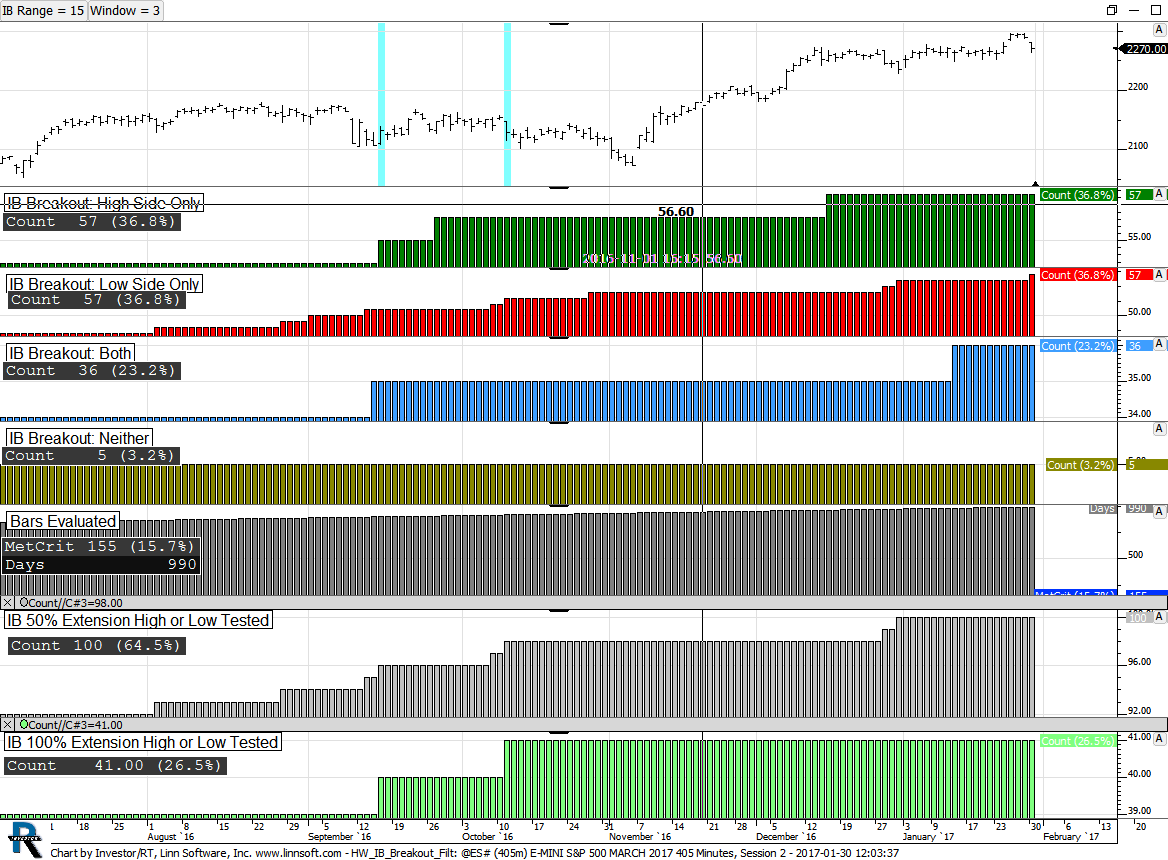 |
HW IB Breakout Filt (@ES#) tradercrm [totalcount]
8 years 2 months ago
This chart was uploaded by Investor/RT 12.6.8 showing symbol: @ES#. |
View |
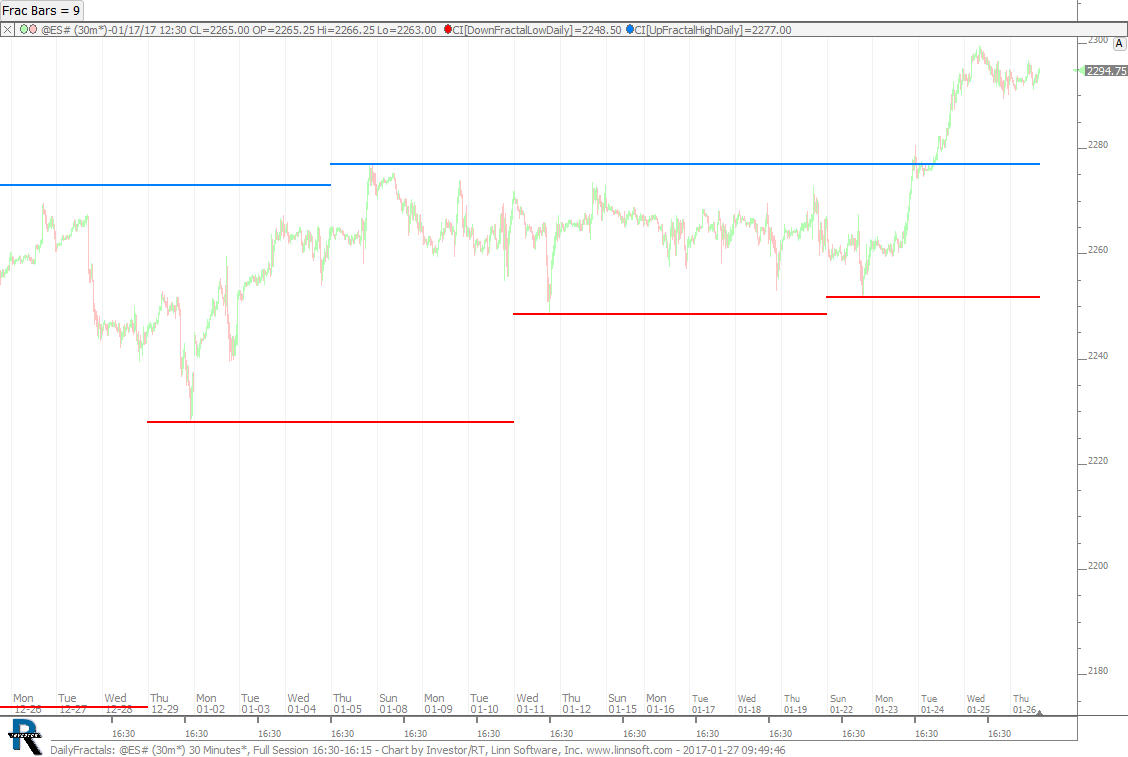 |
DailyFractals (@ES#) cpayne [totalcount]
8 years 2 months ago
Daily Fractals on Intraday Chart. This chart was uploaded by Investor/RT 12.7.1 showing symbol: @ES#. |
View |
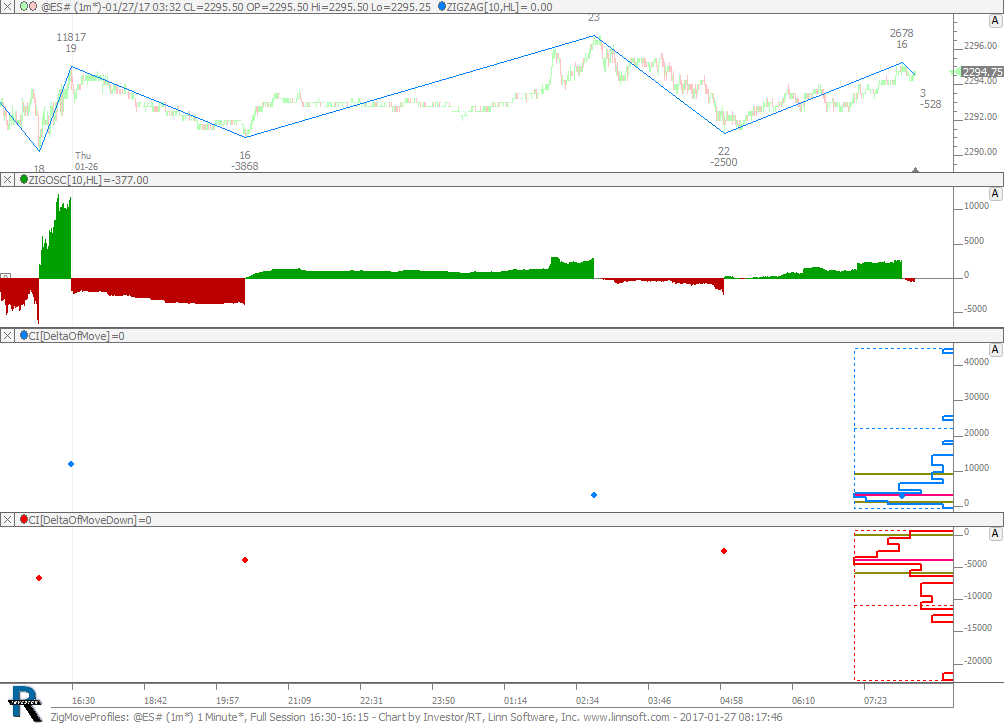 |
ZigMoveProfiles (@ES#) cpayne [totalcount]
8 years 2 months ago
Zig Zag Moves Profiled. This chart was uploaded by Investor/RT 12.7.1 showing symbol: @ES#. |
View |
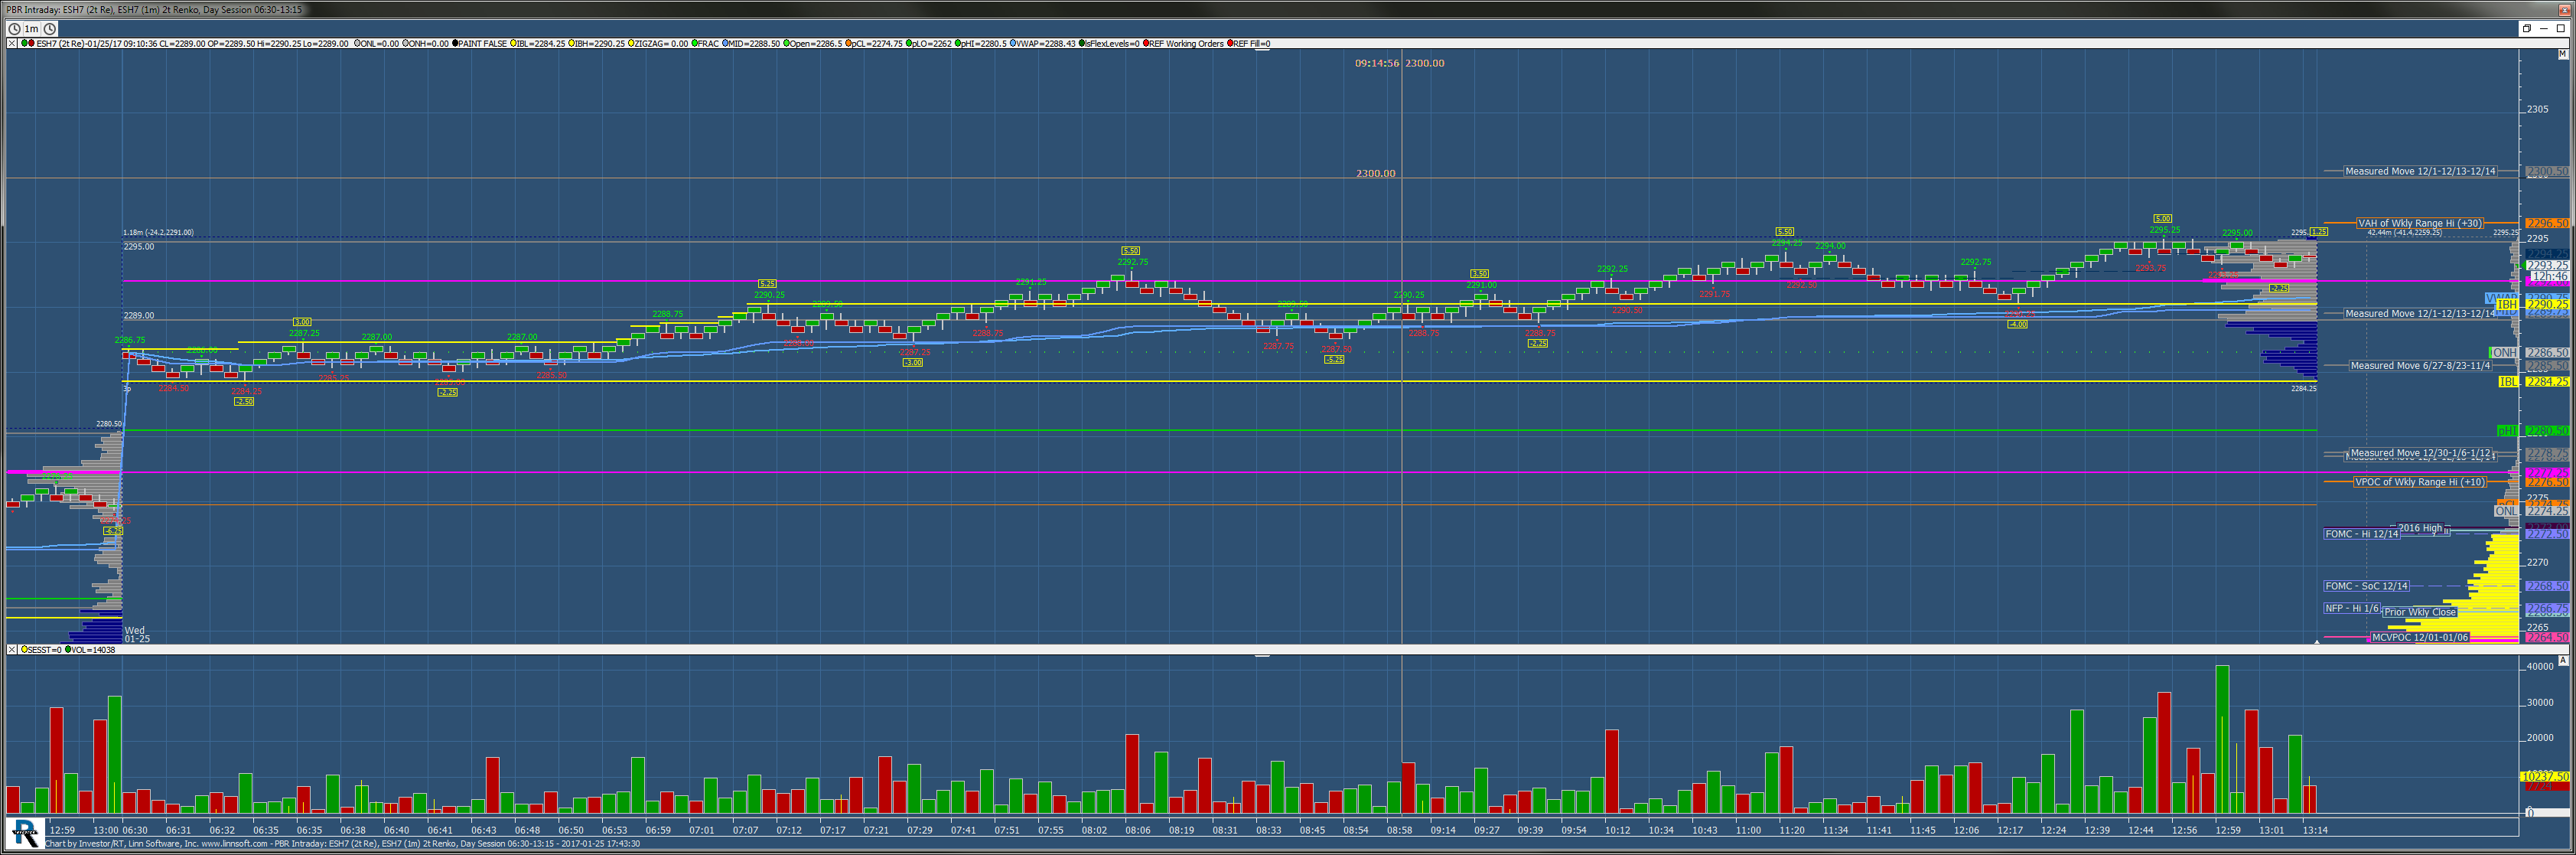 |
PBR Intraday (ESH7) PRabay [totalcount]
8 years 2 months ago
PBR Intraday. This chart was uploaded by Investor/RT 12.6.9 showing symbol: ESH7. |
View |
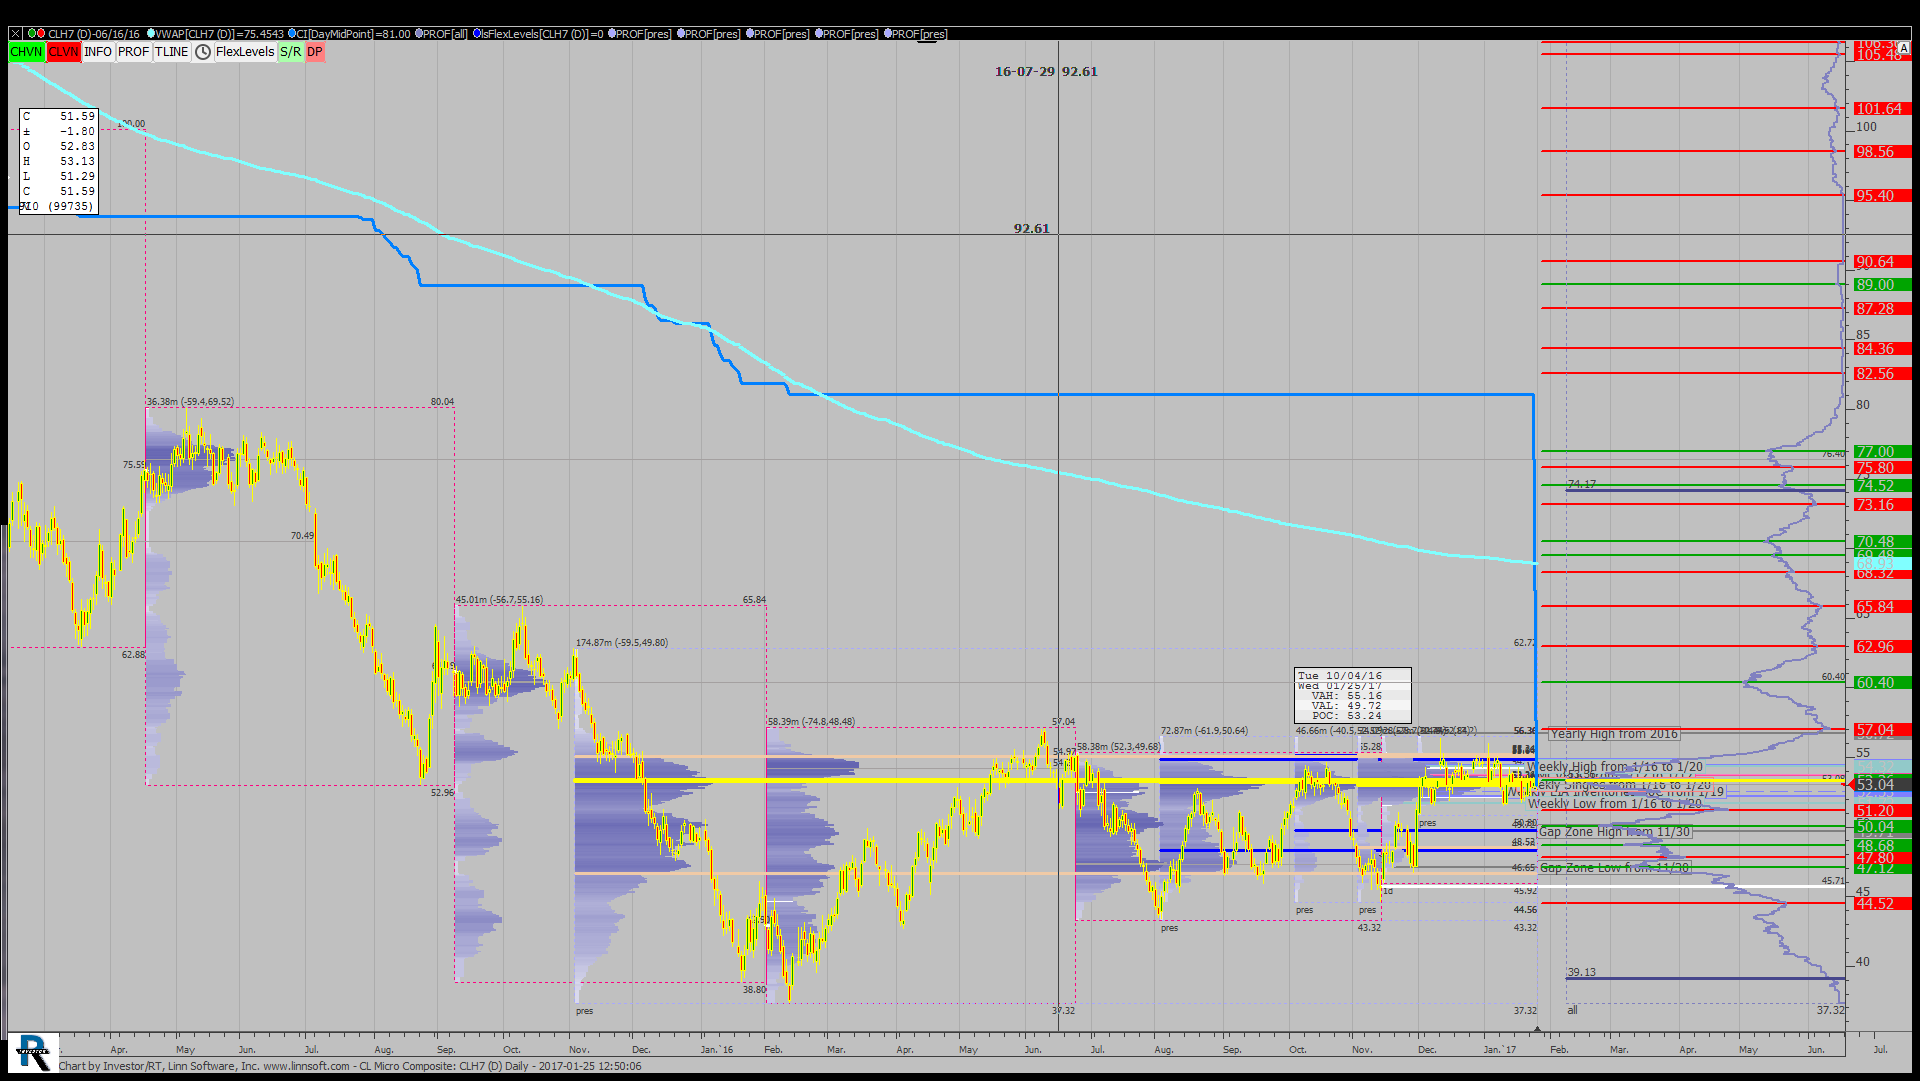 |
CL Micro Composite (CLH7) scottz46 [totalcount]
8 years 2 months ago
This chart was uploaded by Investor/RT 12.6.8 showing symbol: CLH7. |
View |
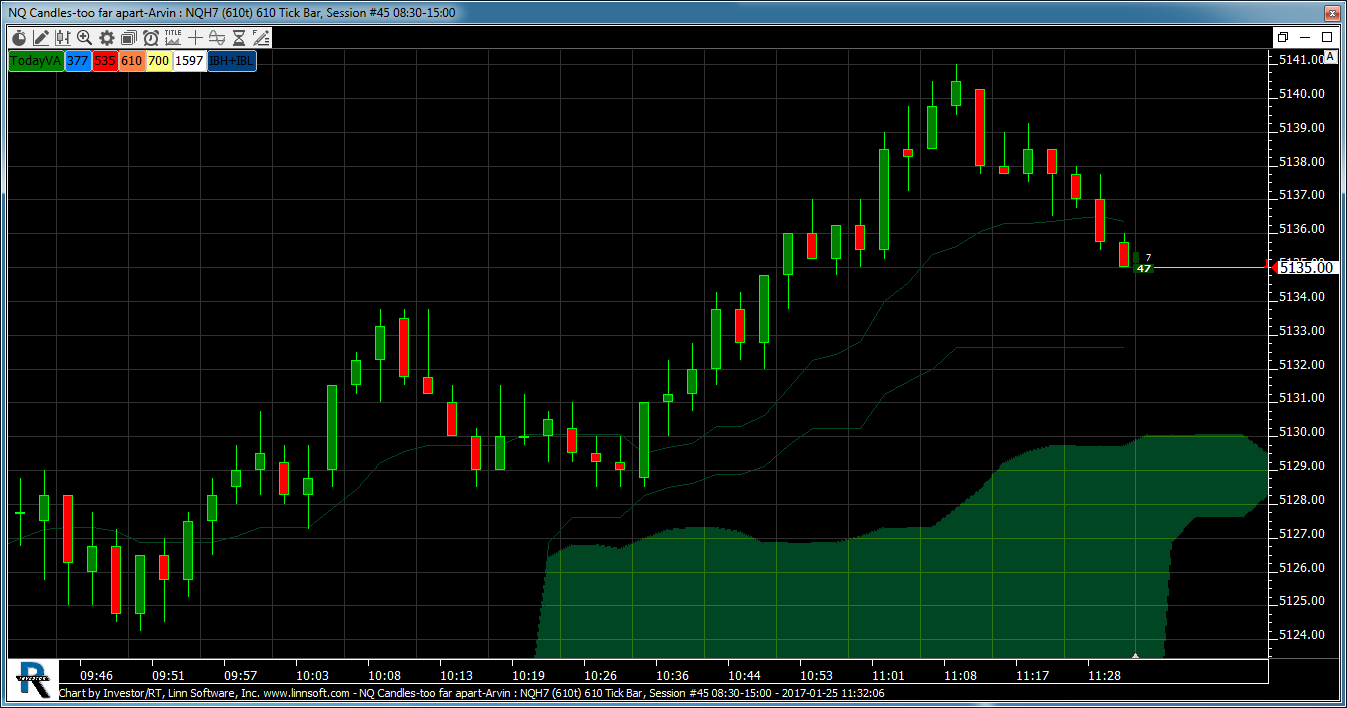 |
NQ Candles too far apart Arvin (NQH7) arvins [totalcount]
8 years 2 months ago
NQ Candles at 24:10 want Bars much closer together. This chart was uploaded by Investor/RT 12.6.9 showing symbol: NQH7. |
View |
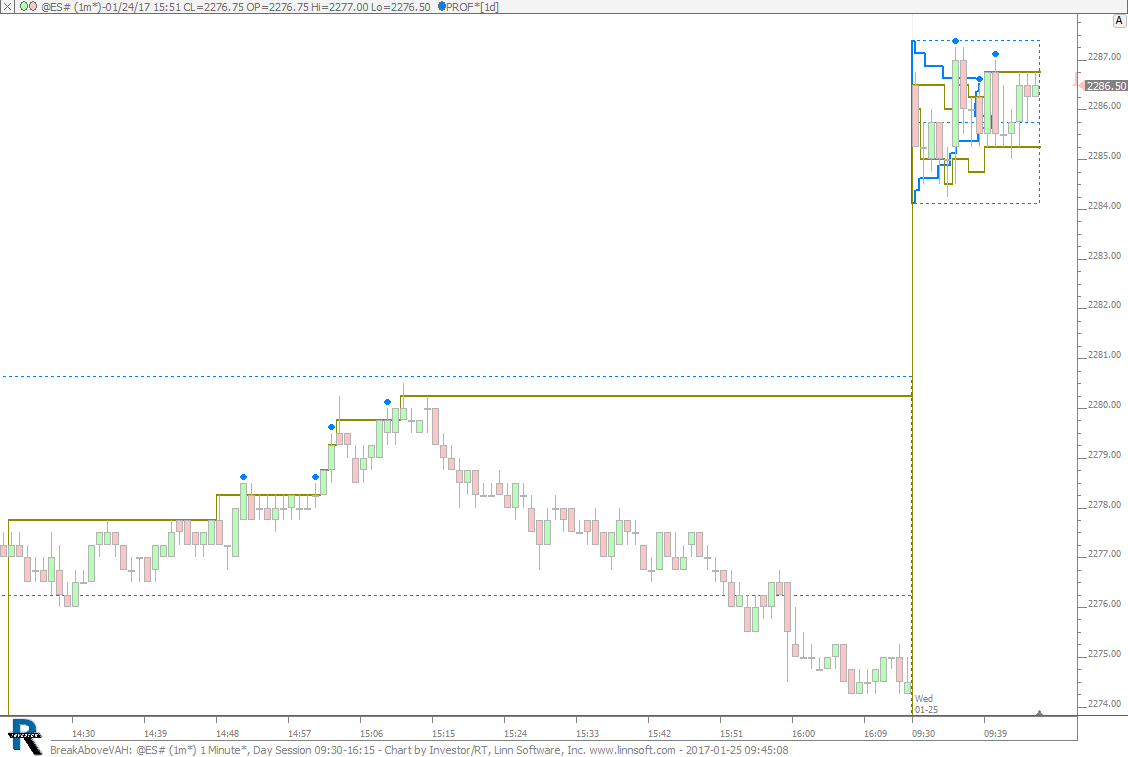 |
BreakAboveVAH (@ES#) cpayne [totalcount]
8 years 2 months ago
Break Above VAH. This chart was uploaded by Investor/RT 12.7.1 showing symbol: @ES#. |
View |
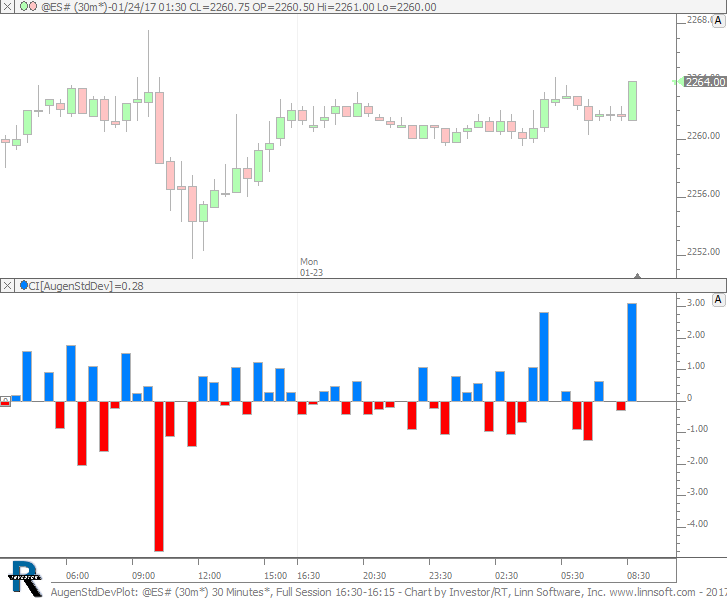 |
AugenStdDevPlot (@ES#) cpayne [totalcount]
8 years 2 months ago
Augen Standard Deviation Plot. This chart was uploaded by Investor/RT 12.7.1 showing symbol: @ES#. |
View |