 |
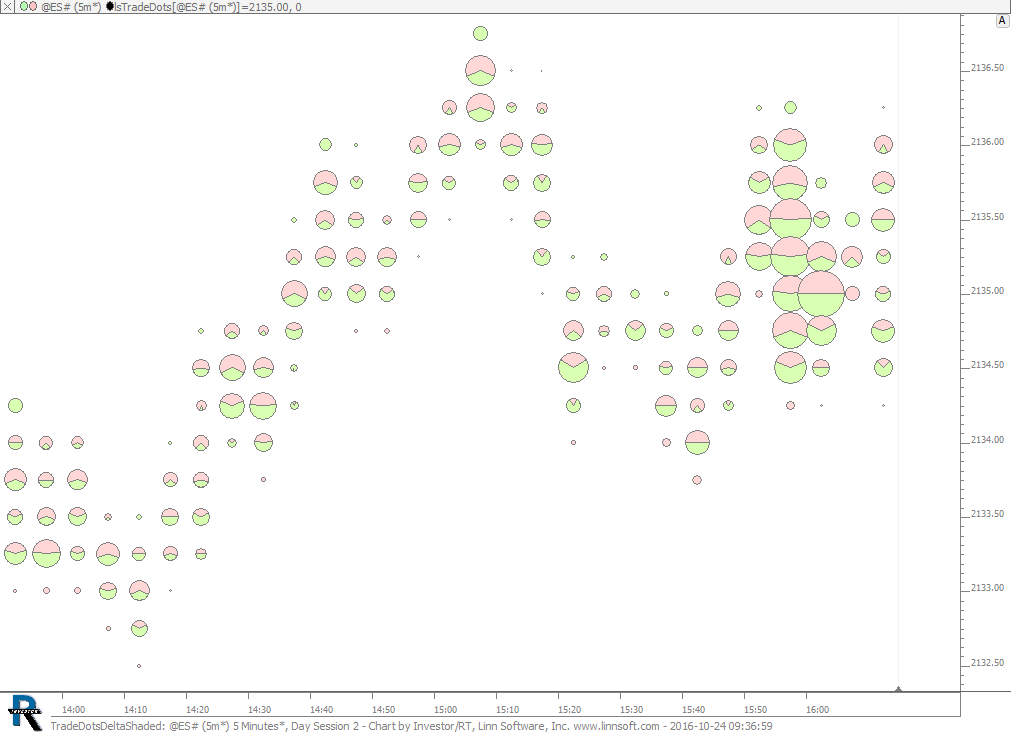
TradeDotsDeltaShaded (@ES#) cpayne [totalcount]
8 years 5 months ago
Trade Dots Delta Pie. This chart was uploaded by Investor/RT 12.6.7 showing symbol: @ES#. |
View |
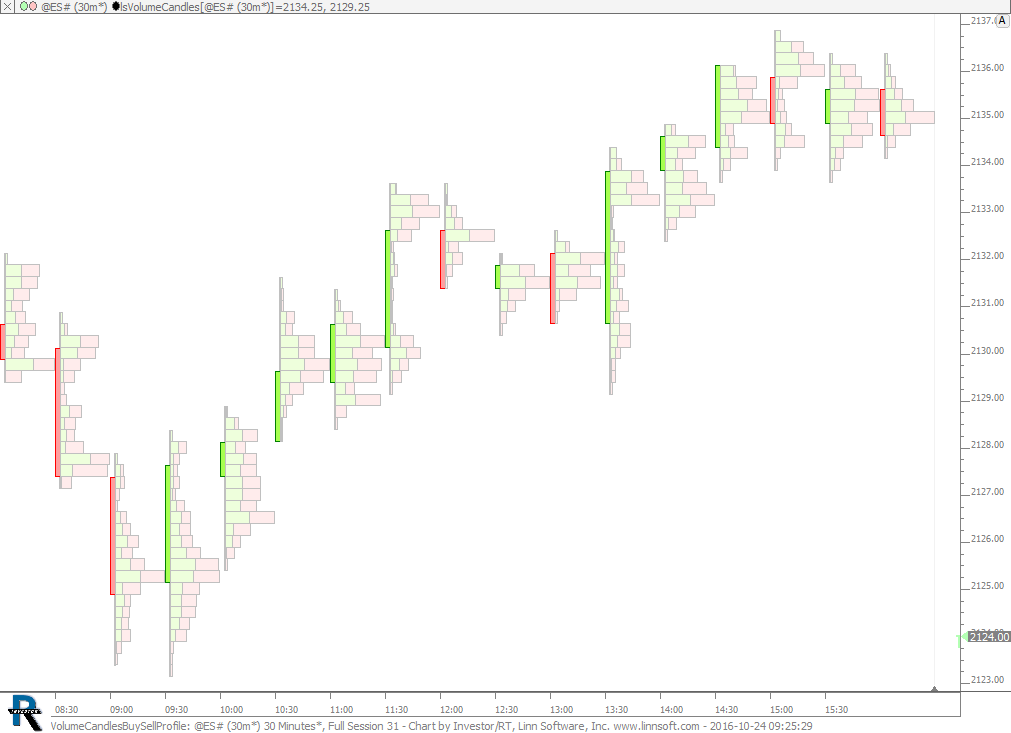 |
VolumeCandlesBuySellProfile (@ES#) cpayne [totalcount]
8 years 5 months ago
Volume Candles with Buy/Sell Profile. This chart was uploaded by Investor/RT 12.6.7 showing symbol: @ES#. |
View |
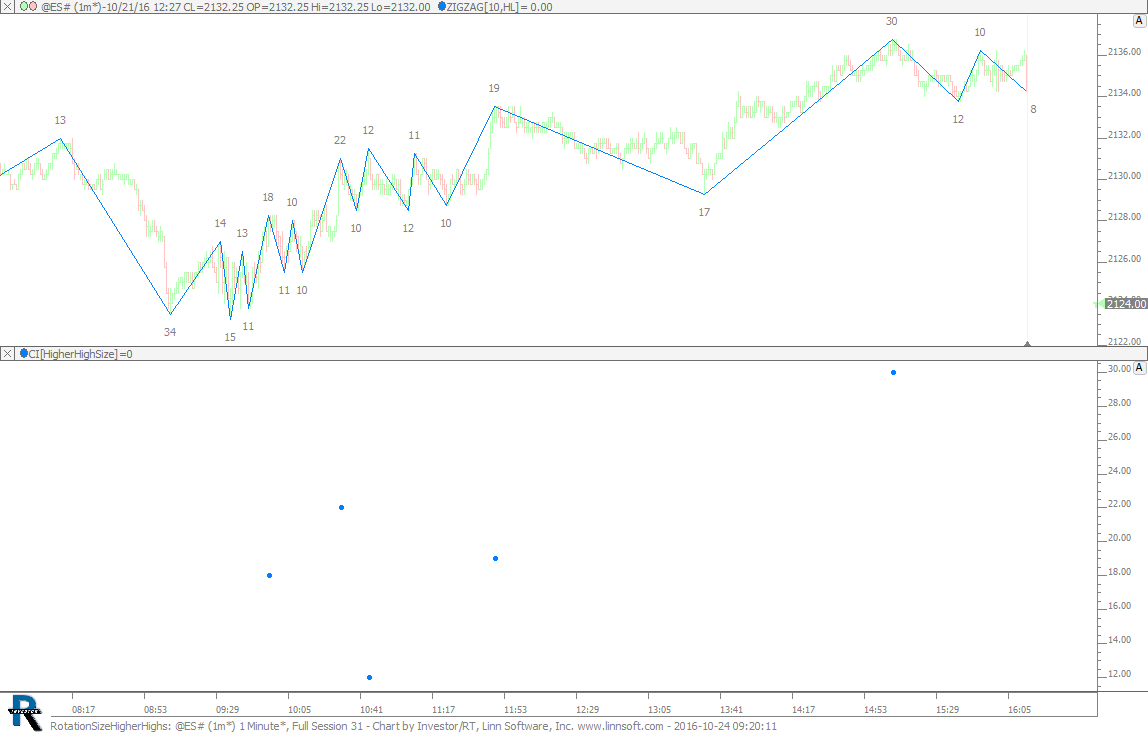 |
RotationSizeHigherHighs (@ES#) cpayne [totalcount]
8 years 5 months ago
Rotation Size of Higher Highs. This chart was uploaded by Investor/RT 12.6.7 showing symbol: @ES#. |
View |
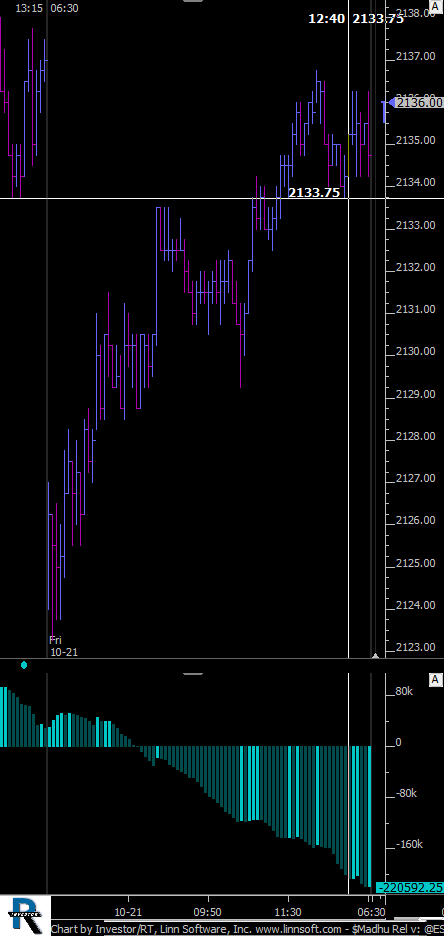 |
Madhu Rel v (@ES#) drms76 [totalcount]
8 years 5 months ago
How do I paint price bars when the underlying relative volume bars increase (compared to the previous bar)?. This chart was uploaded by Investor/RT 12.6.6 showing symbol: @ES#. |
View |
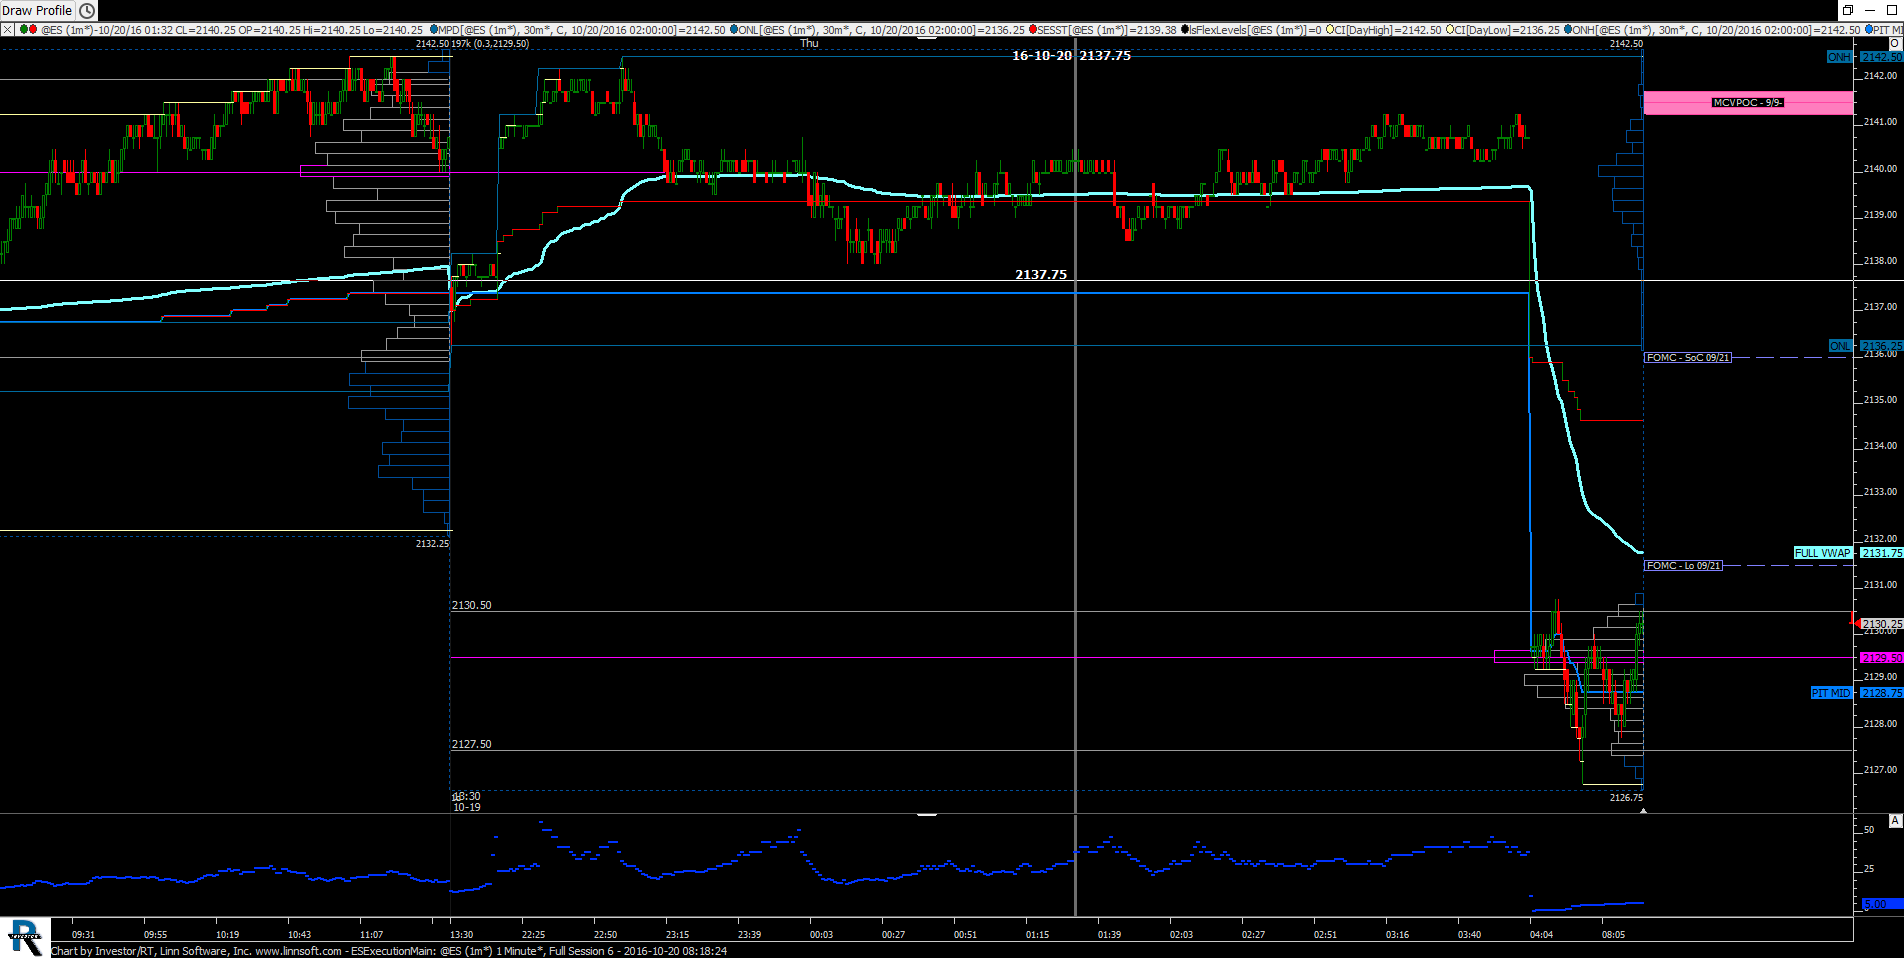 |
ESExecutionMain (@ES) mostafacali [totalcount]
8 years 5 months ago
This chart was uploaded by Investor/RT 12.6.6 showing symbol: @ES. |
View |
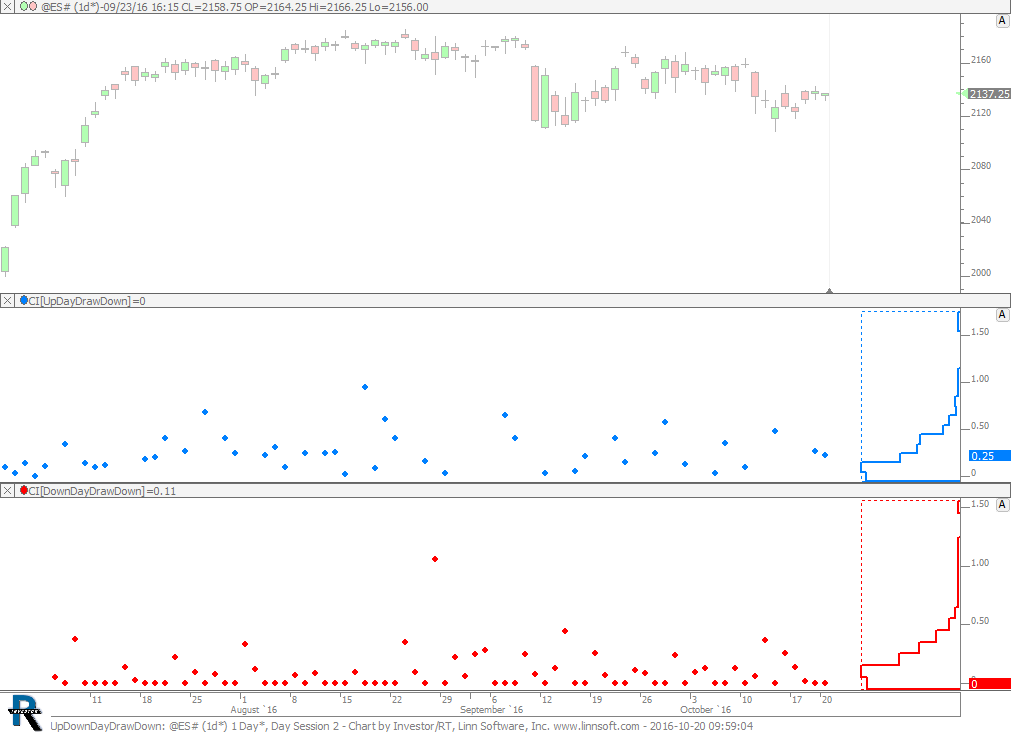 |
UpDownDayDrawDown (@ES#) cpayne [totalcount]
8 years 5 months ago
Up and Down Day Drop Down. This chart was uploaded by Investor/RT 12.6.6 showing symbol: @ES#. |
View |
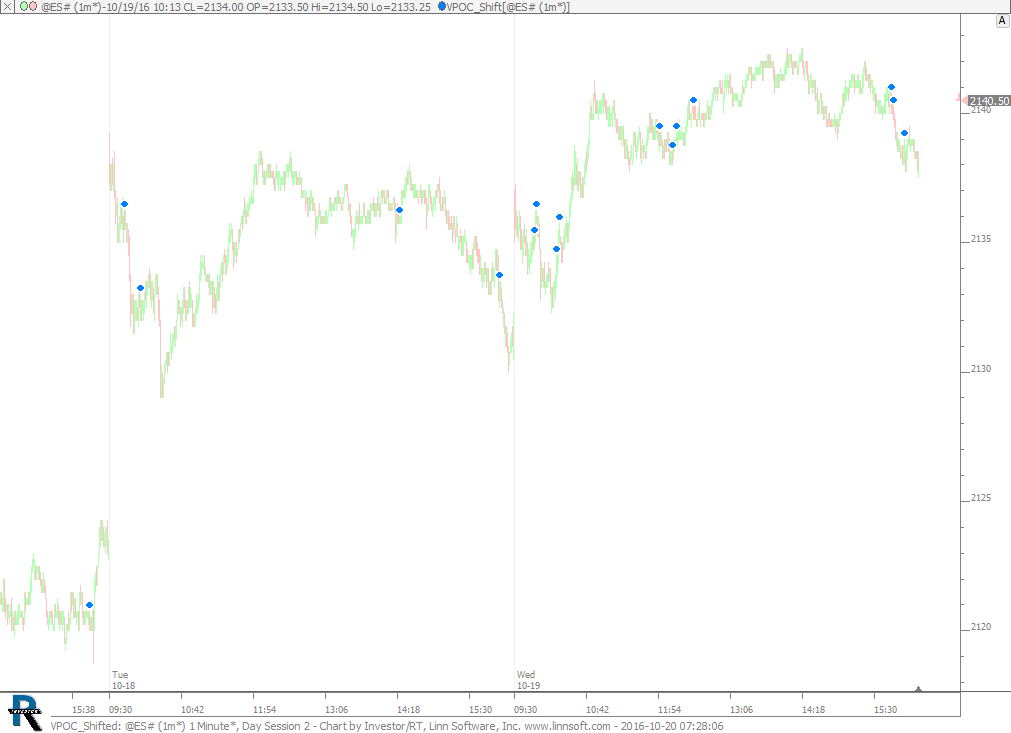 |
VPOC Shifted (@ES#) cpayne [totalcount]
8 years 5 months ago
VPOC Shift Alert. This chart was uploaded by Investor/RT 12.6.6 showing symbol: @ES#. |
View |
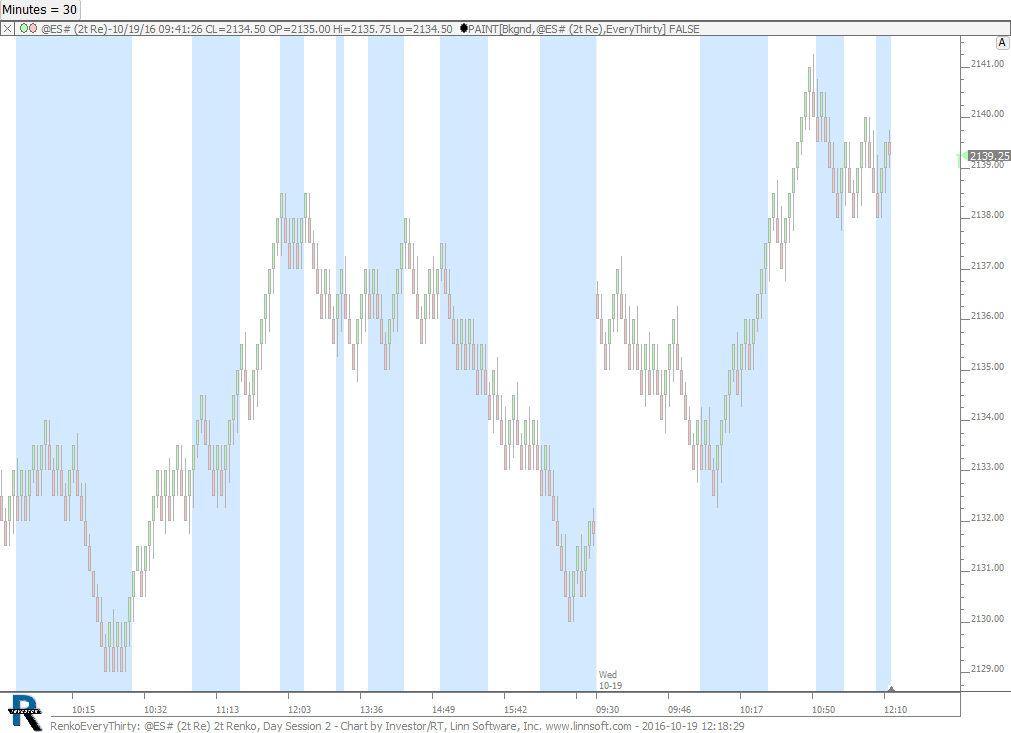 |
RenkoEveryThirty (@ES#) cpayne [totalcount]
8 years 5 months ago
Renko Chart With Every 30 Minute Period Painted. This chart was uploaded by Investor/RT 12.6.6 showing symbol: @ES#. |
View |
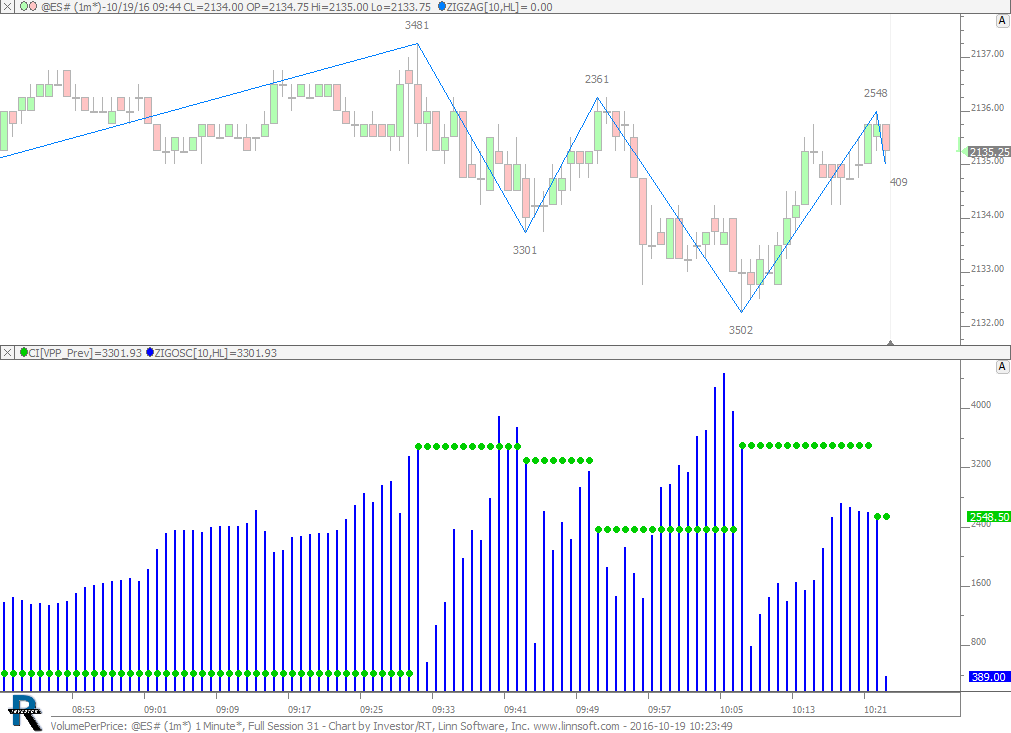 |
VolumePerPrice (@ES#) cpayne [totalcount]
8 years 5 months ago
Volume Per Price of Previous Leg. This chart was uploaded by Investor/RT 12.6.6 showing symbol: @ES#. |
View |
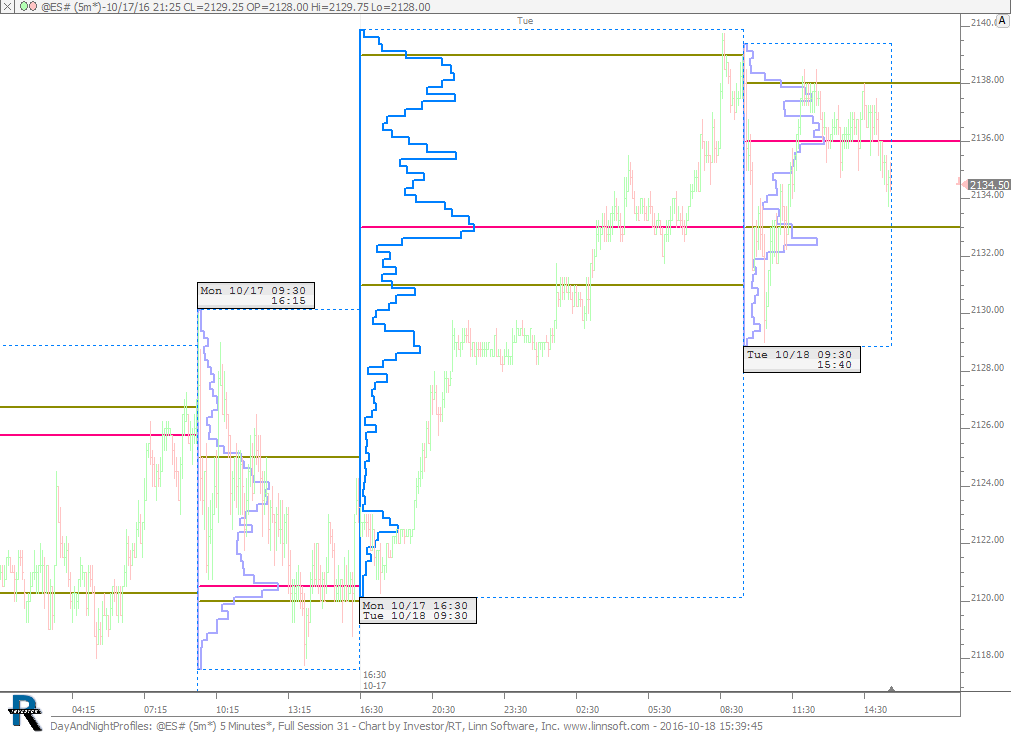 |
DayAndNightProfiles (@ES#) cpayne [totalcount]
8 years 5 months ago
Split Profile - Day and ON Session. This chart was uploaded by Investor/RT 12.6.6 showing symbol: @ES#. |
View |
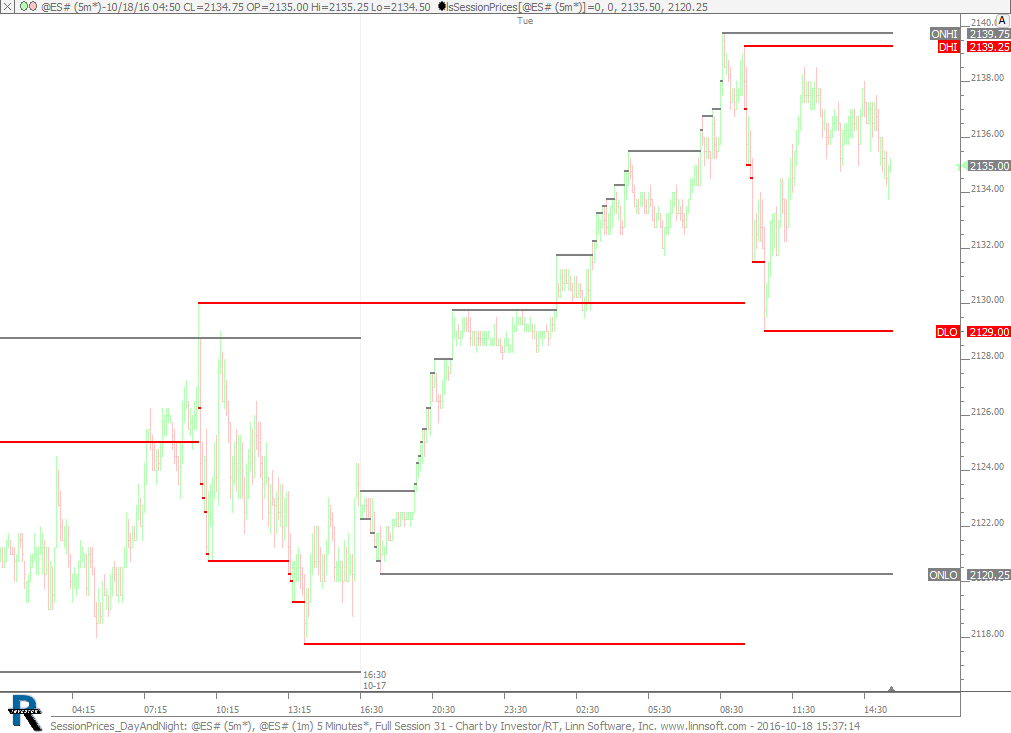 |
SessionPrices DayAndNight (@ES#) cpayne [totalcount]
8 years 5 months ago
Session Prices - Day and Overnight High / Low. This chart was uploaded by Investor/RT 12.6.6 showing symbol: @ES#. |
View |
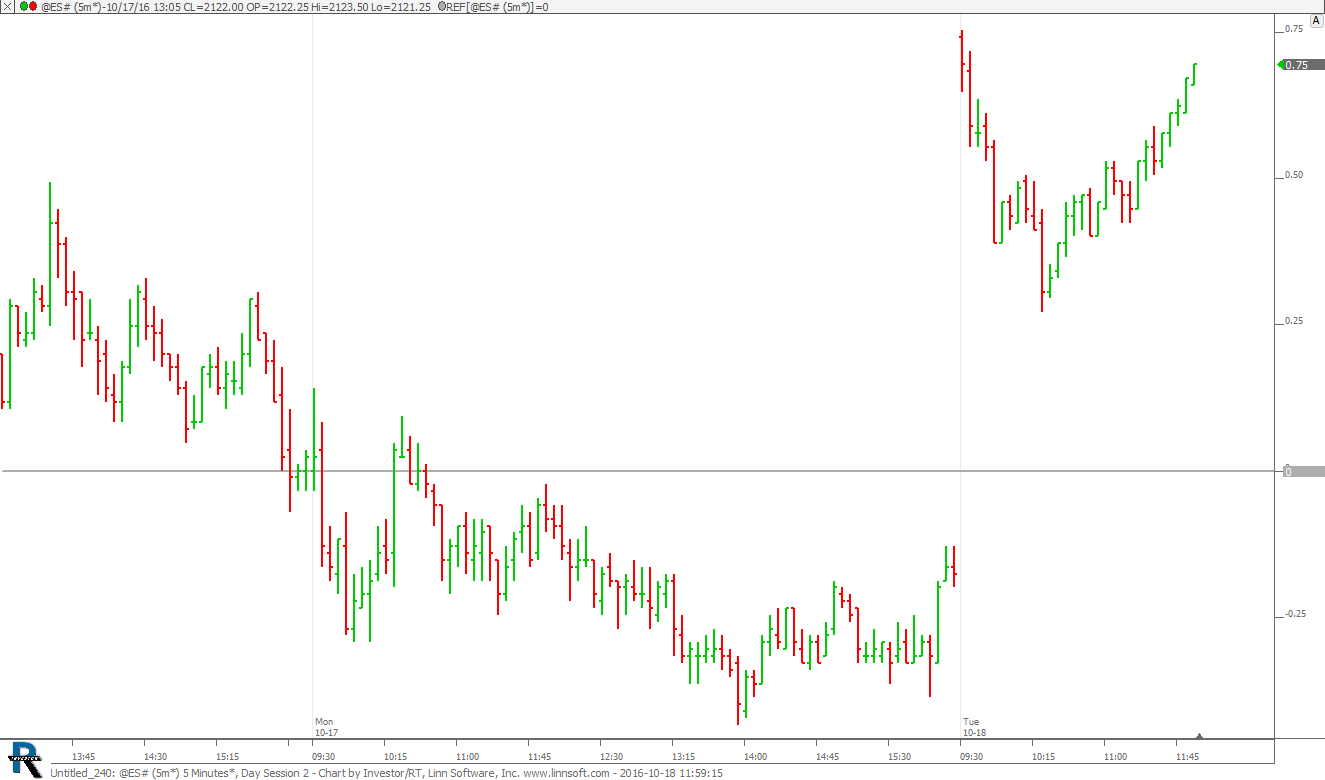 |
Untitled 240 (@ES#) cpayne [totalcount]
8 years 5 months ago
Day % Change from Previous Close. This chart was uploaded by Investor/RT 12.6.6 showing symbol: @ES#. |
View |
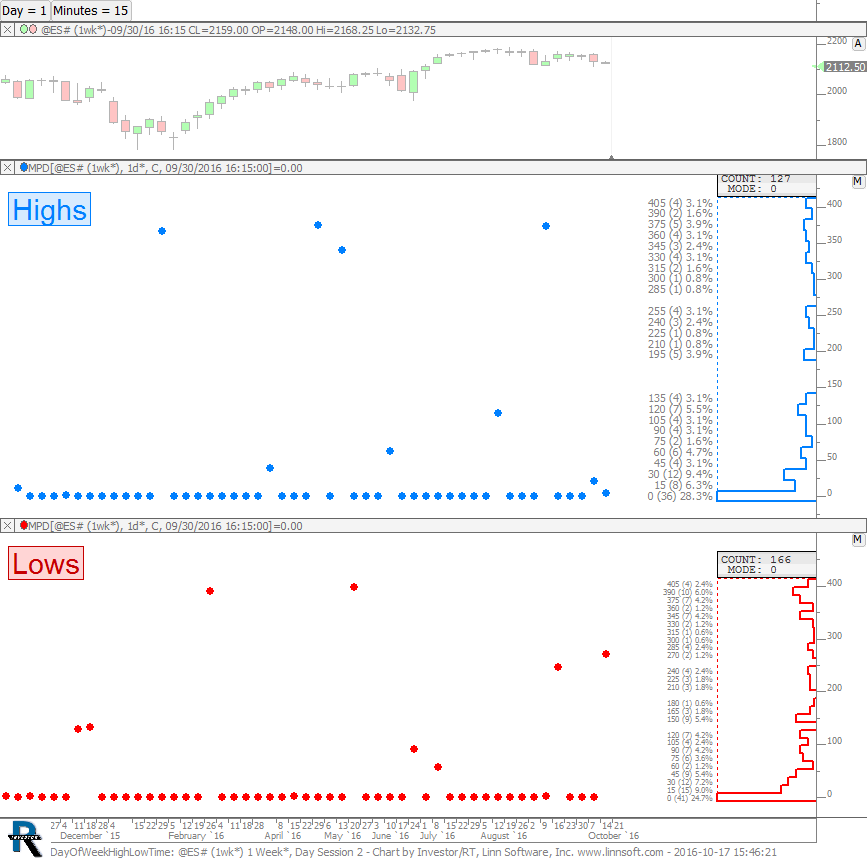 |
DayOfWeekHighLowTime (@ES#) cpayne [totalcount]
8 years 5 months ago
When High of Week was made on any particular day, what time of that day was high made?. This chart was uploaded by Investor/RT 12.6.6 showing symbol: @ES#. |
View |
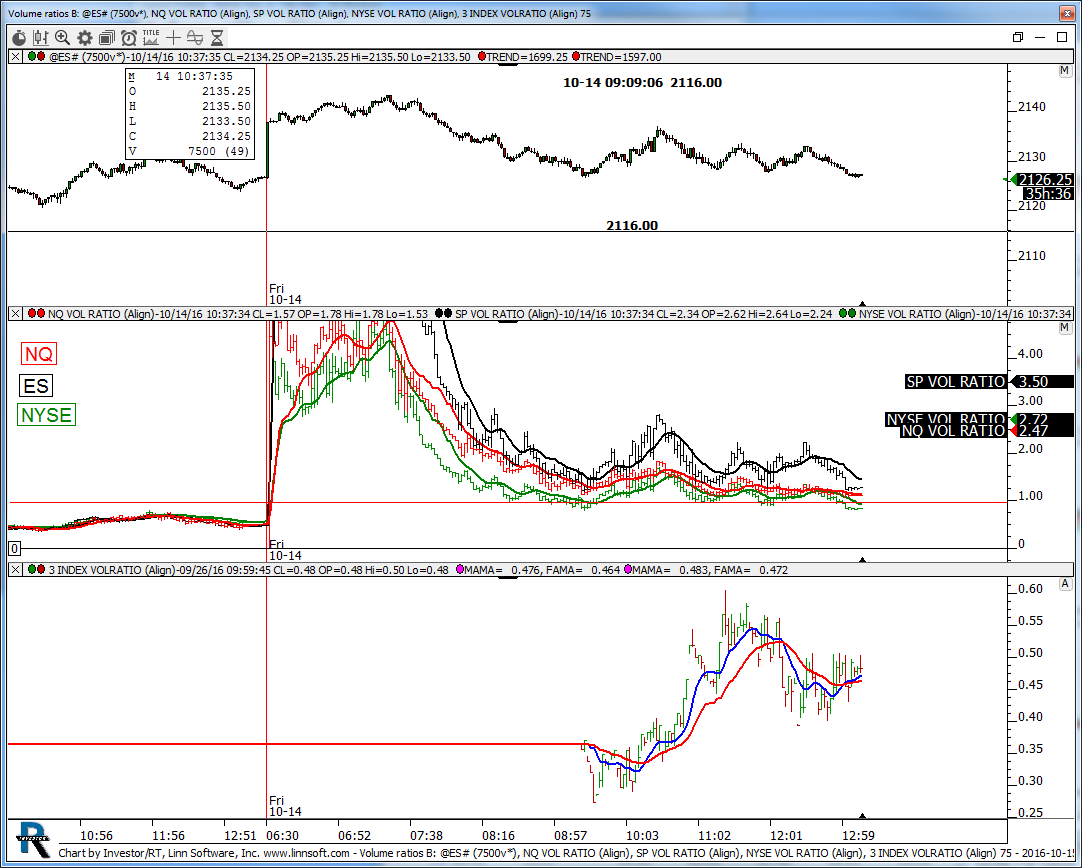 |
Volume ratios B (@ES#) 3 kencassorla [totalcount]
8 years 5 months ago
vol ratios. This chart was uploaded by Investor/RT 12.6.6 showing symbol: @ES#. |
View |
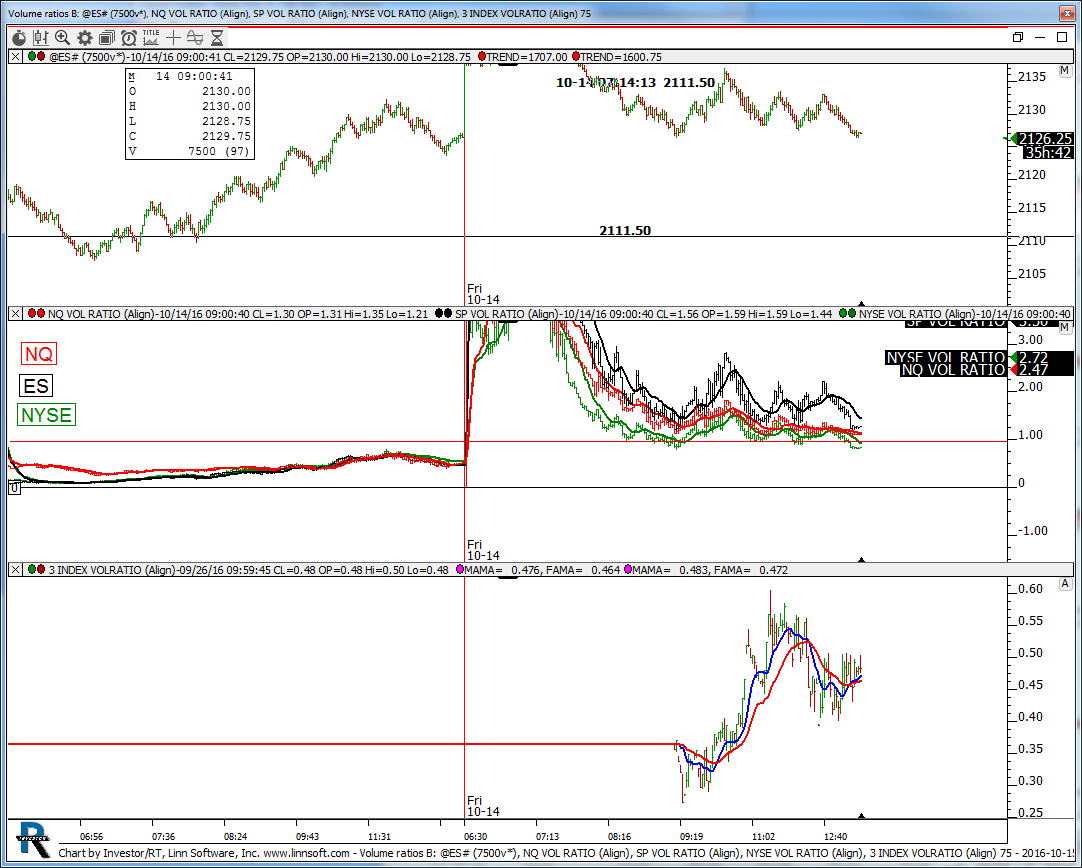 |
Volume ratios B (@ES#) 2 kencassorla [totalcount]
8 years 5 months ago
vol ratios. This chart was uploaded by Investor/RT 12.6.6 showing symbol: @ES#. |
View |
 |
Volume ratios B (@ES#) kencassorla [totalcount]
8 years 5 months ago
vol ratios. This chart was uploaded by Investor/RT 12.6.6 showing symbol: @ES#. |
View |
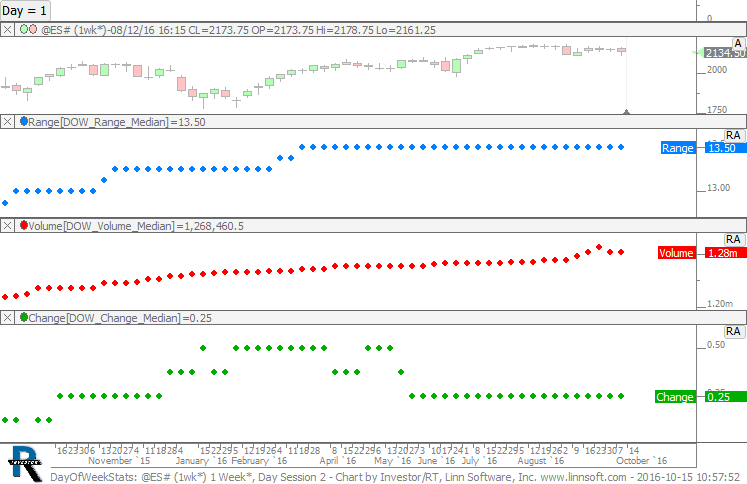 |
DayOfWeekStats (@ES#) cpayne [totalcount]
8 years 5 months ago
Day of Week Statistics. This chart was uploaded by Investor/RT 12.6.6 showing symbol: @ES#. |
View |
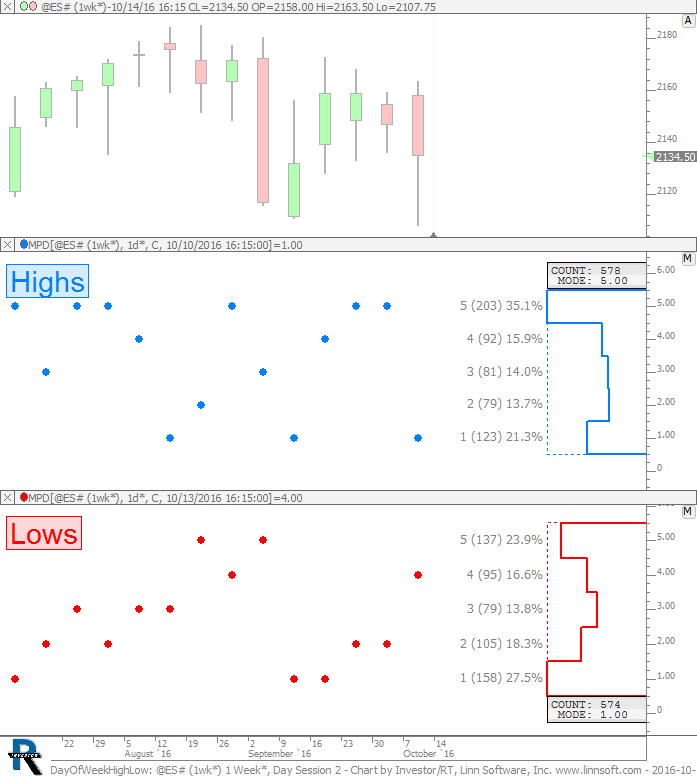 |
DayOfWeekHighLow (@ES#) cpayne [totalcount]
8 years 5 months ago
Day of Week that created the high and low of the week. This chart was uploaded by Investor/RT 12.6.6 showing symbol: @ES#. |
View |
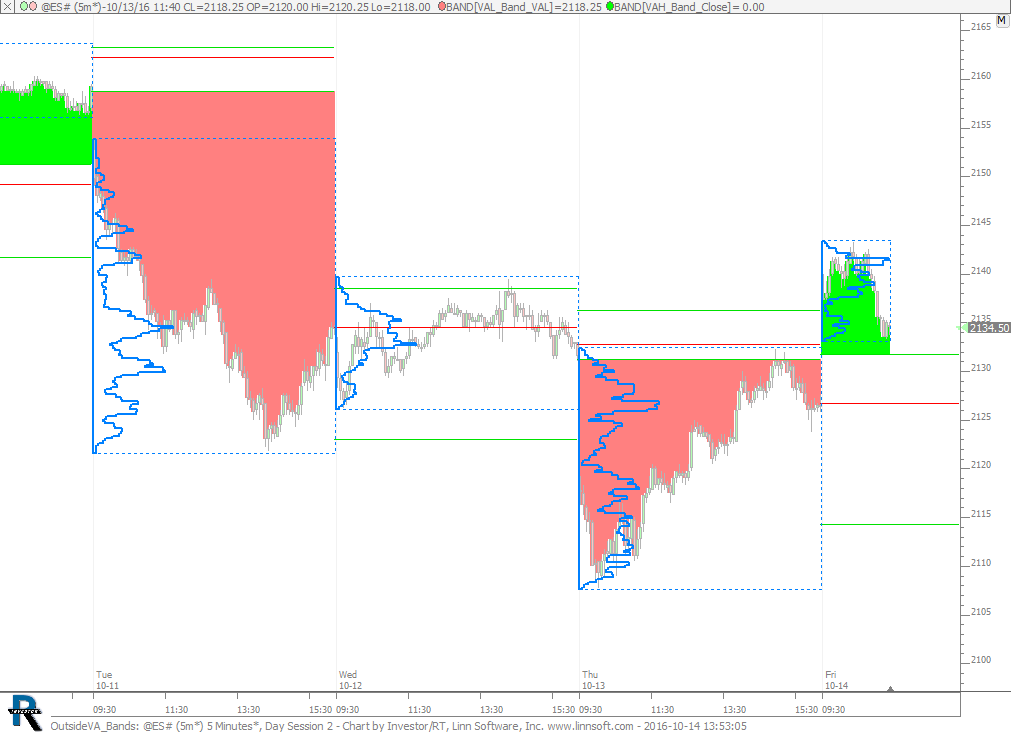 |
OutsideVA Bands (@ES#) cpayne [totalcount]
8 years 5 months ago
Bands Drawn When Price is Outside the Value Area. This chart was uploaded by Investor/RT 12.6.6 showing symbol: @ES#. |
View |
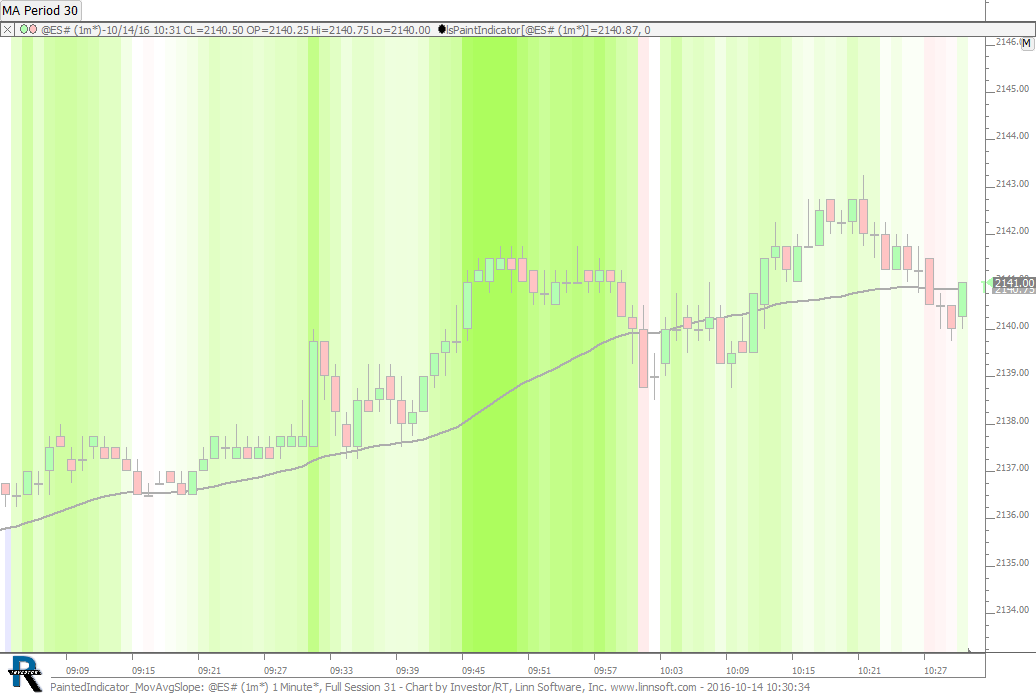 |
PaintedIndicator MovAvgSlope (@ES#) cpayne [totalcount]
8 years 5 months ago
PaintIndicator - Gradient for Moving Average Slope. This chart was uploaded by Investor/RT 12.6.6 showing symbol: @ES#. |
View |
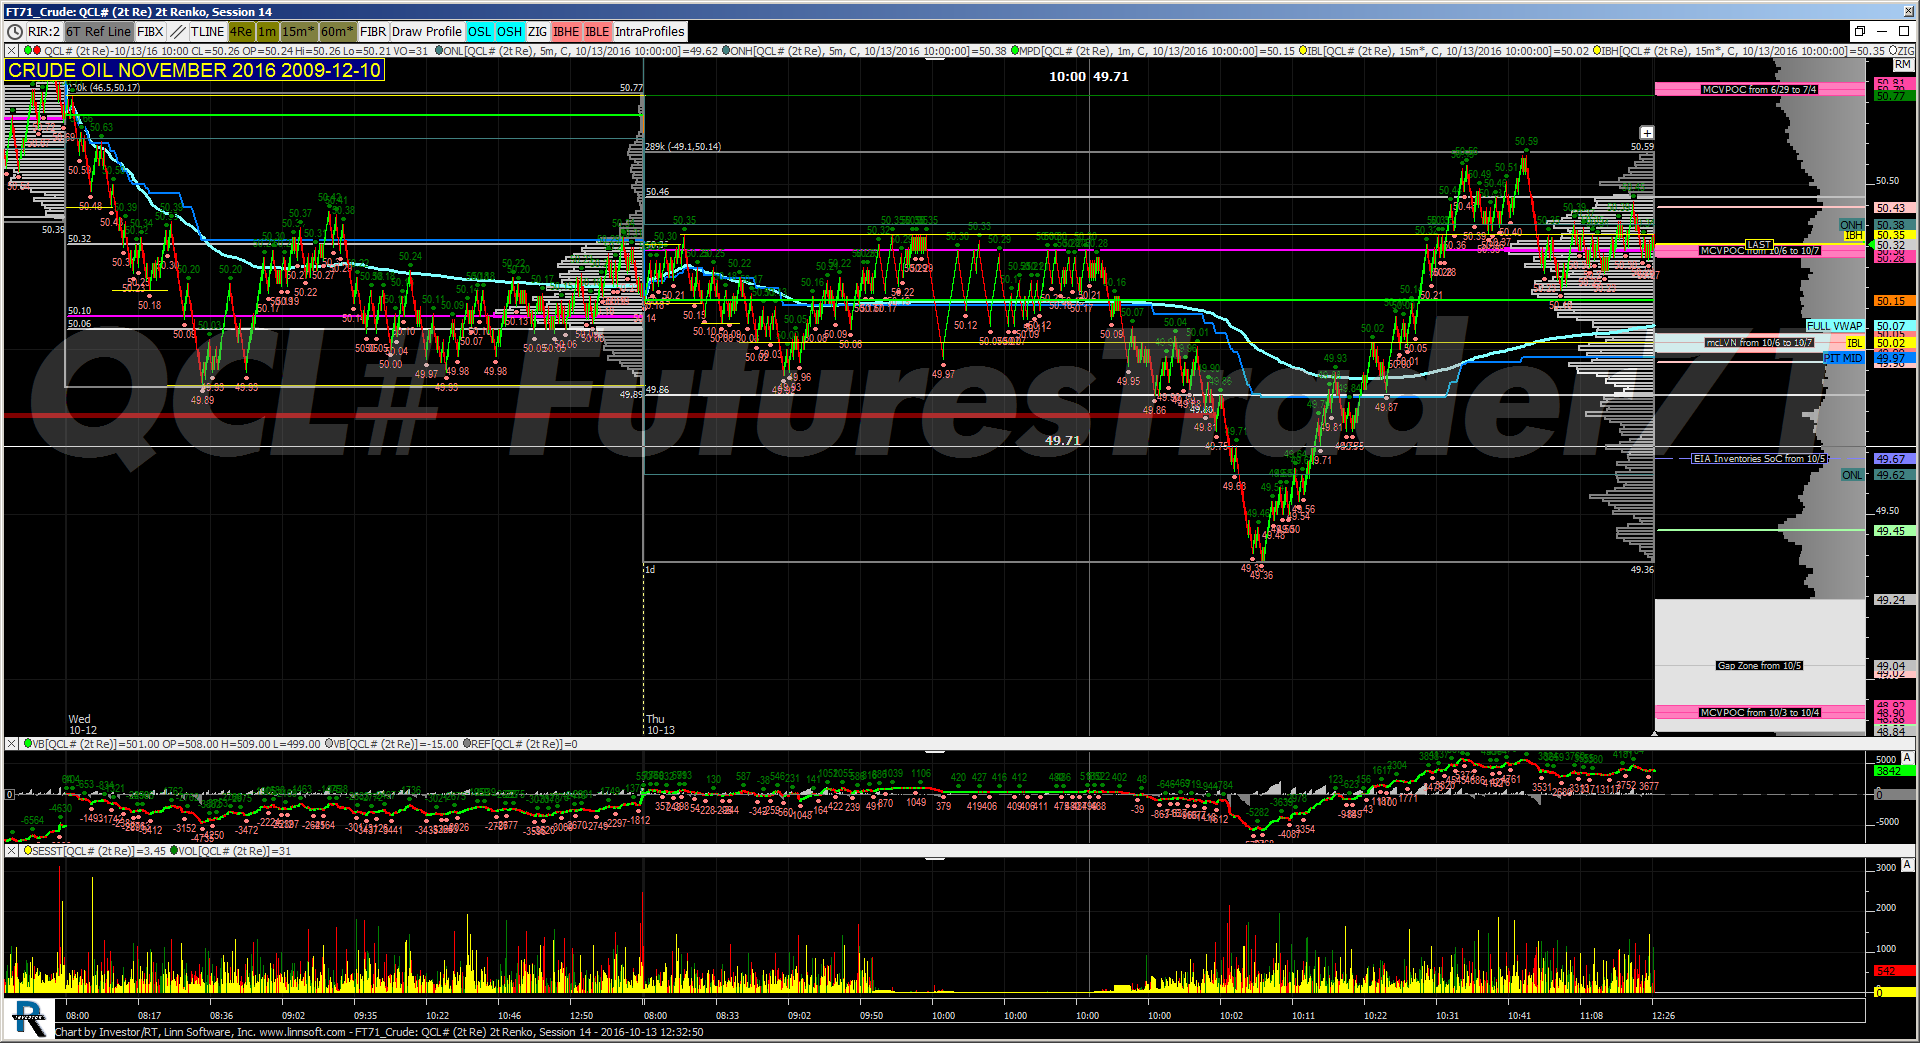 |
FT71 Crude (QCL#) futurestrader71 [totalcount]
8 years 5 months ago
Latest Crude definition for FT71. This chart was uploaded by Investor/RT 12.6.5 showing symbol: QCL#. |
View |
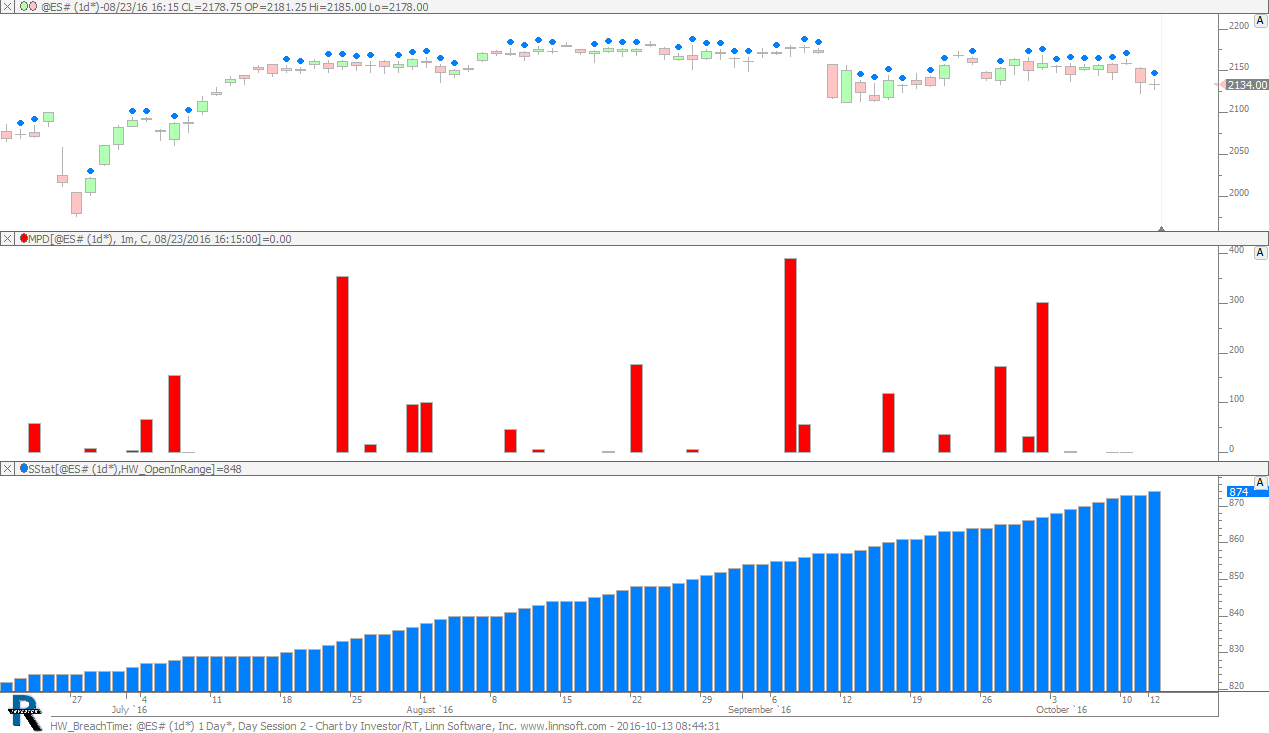 |
HW BreachTime (@ES#) cpayne [totalcount]
8 years 5 months ago
Homework: Time Breached High. This chart was uploaded by Investor/RT 12.6.5 showing symbol: @ES#. |
View |
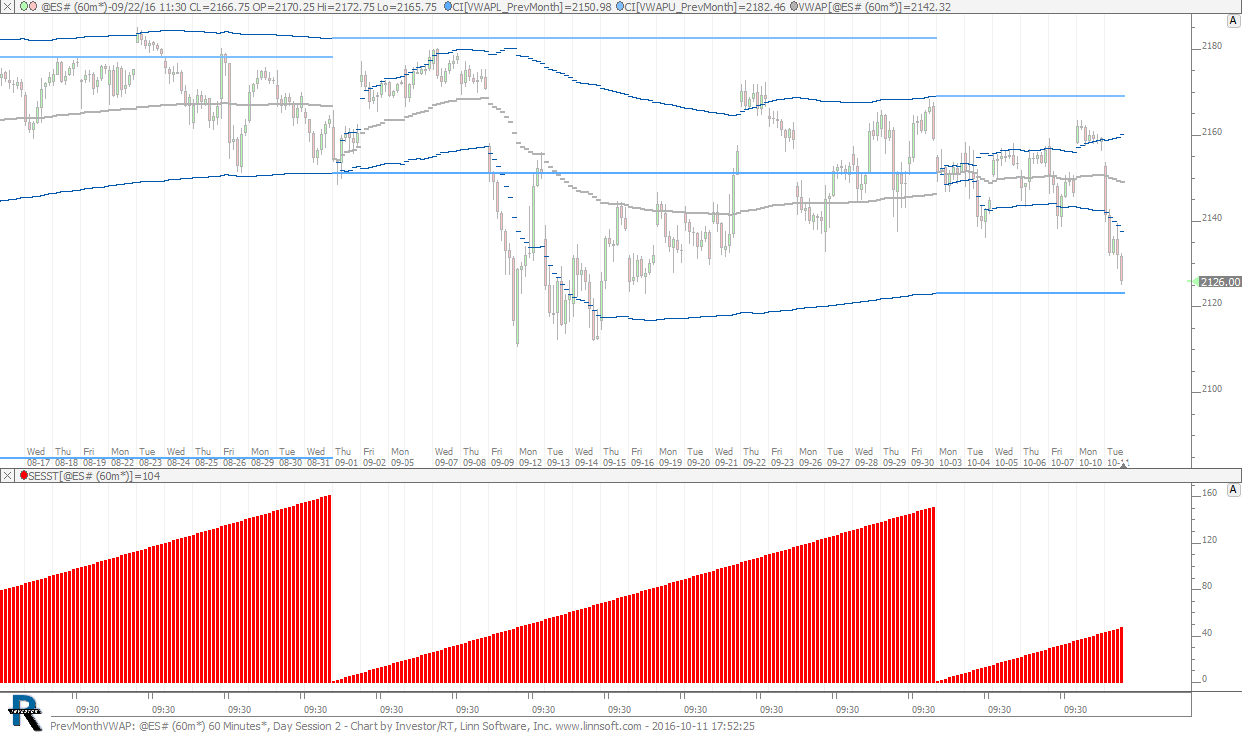 |
PrevMonthVWAP (@ES#) cpayne [totalcount]
8 years 5 months ago
Previous Month VWAP. This chart was uploaded by Investor/RT 12.6.5 showing symbol: @ES#. |
View |
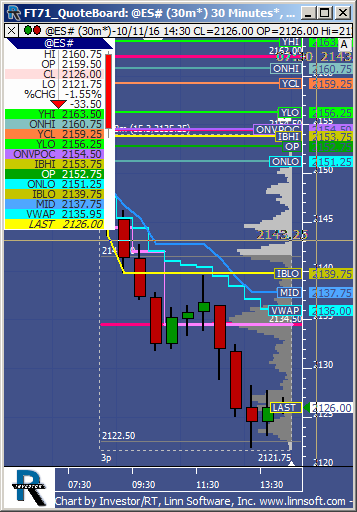 |
FT71 QuoteBoard (@ES#) futurestrader71 [totalcount]
8 years 5 months ago
This is the ES QuoteBoard chart which MUST REMAIN open in the background in order to update the overnight and other key levels in the ES Intraday Trigger and ES Intraday charts found here. |
View |
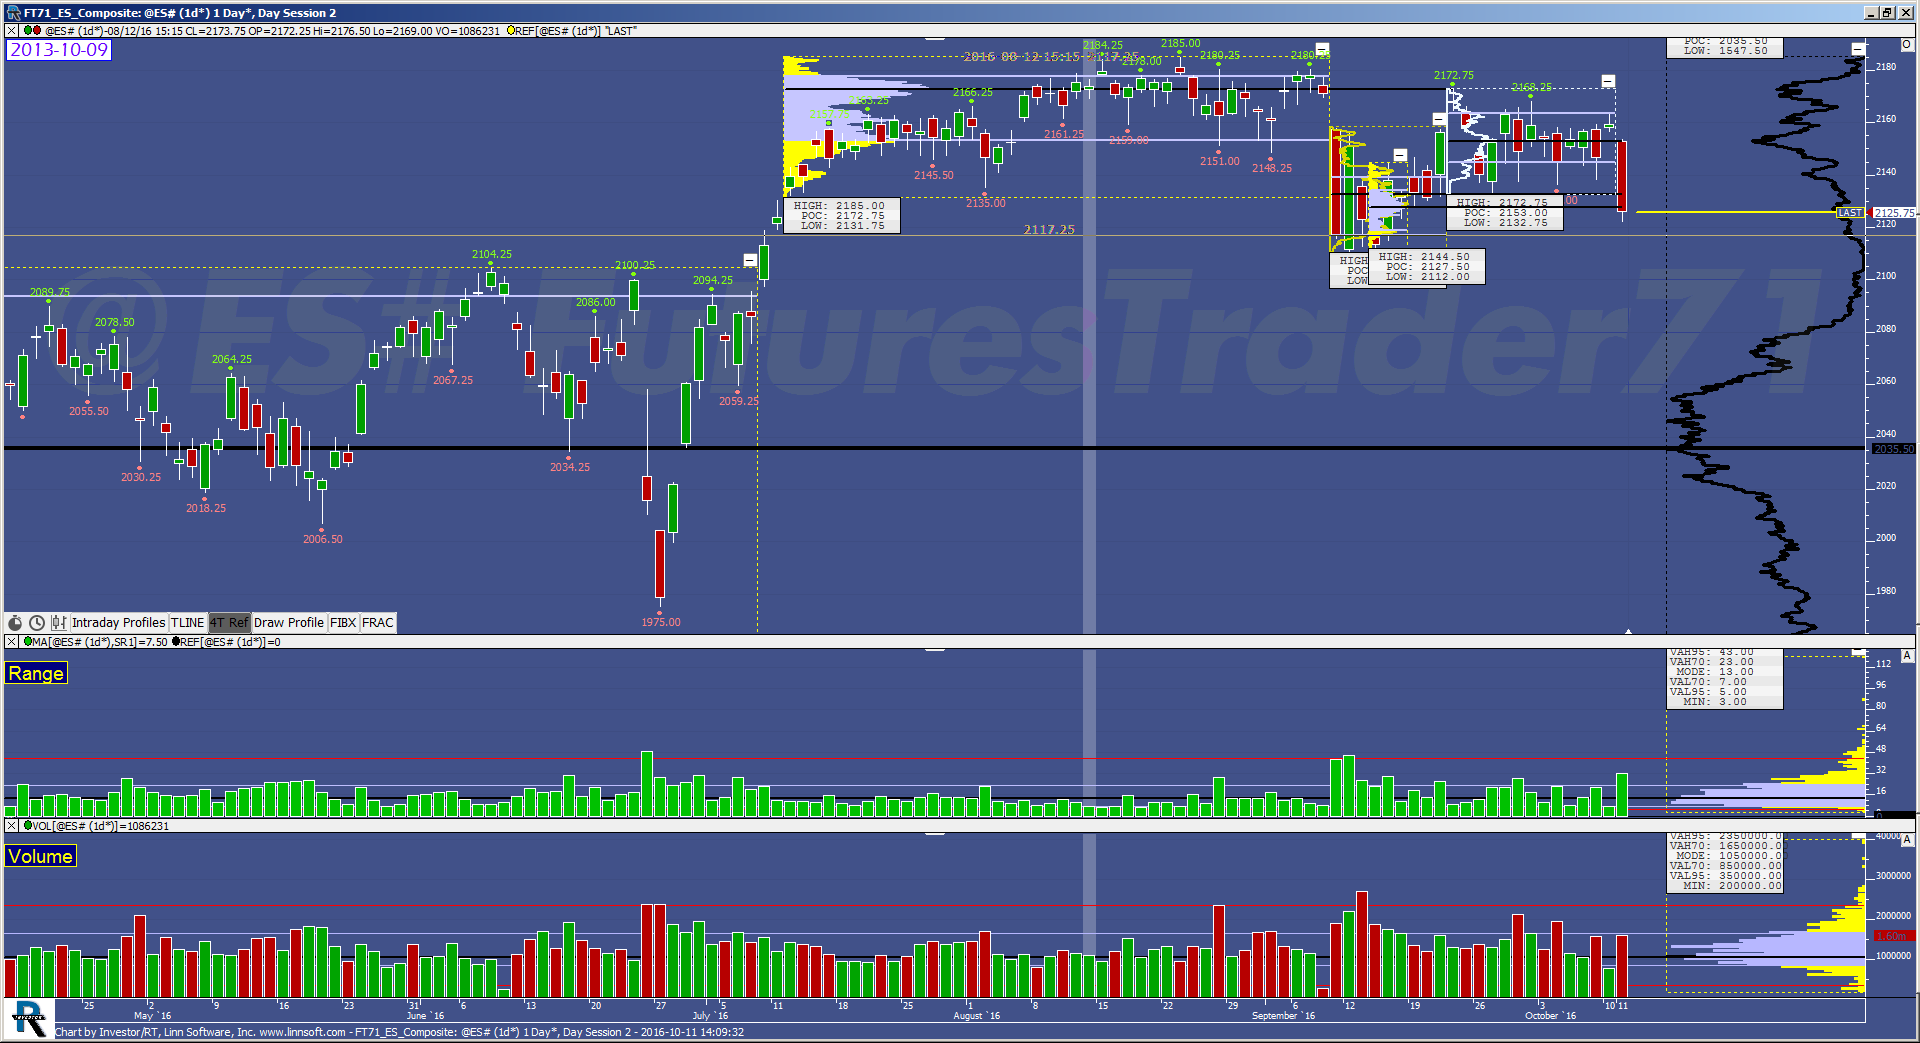 |
FT71 ES Composite (@ES#) futurestrader71 [totalcount]
8 years 5 months ago
ES Composite Day Session chart showing the composite profile as well as the dynamic studies of Range and Volume per day. This is used for the big picture and is key to analyzing the market's bias... |
View |