 |
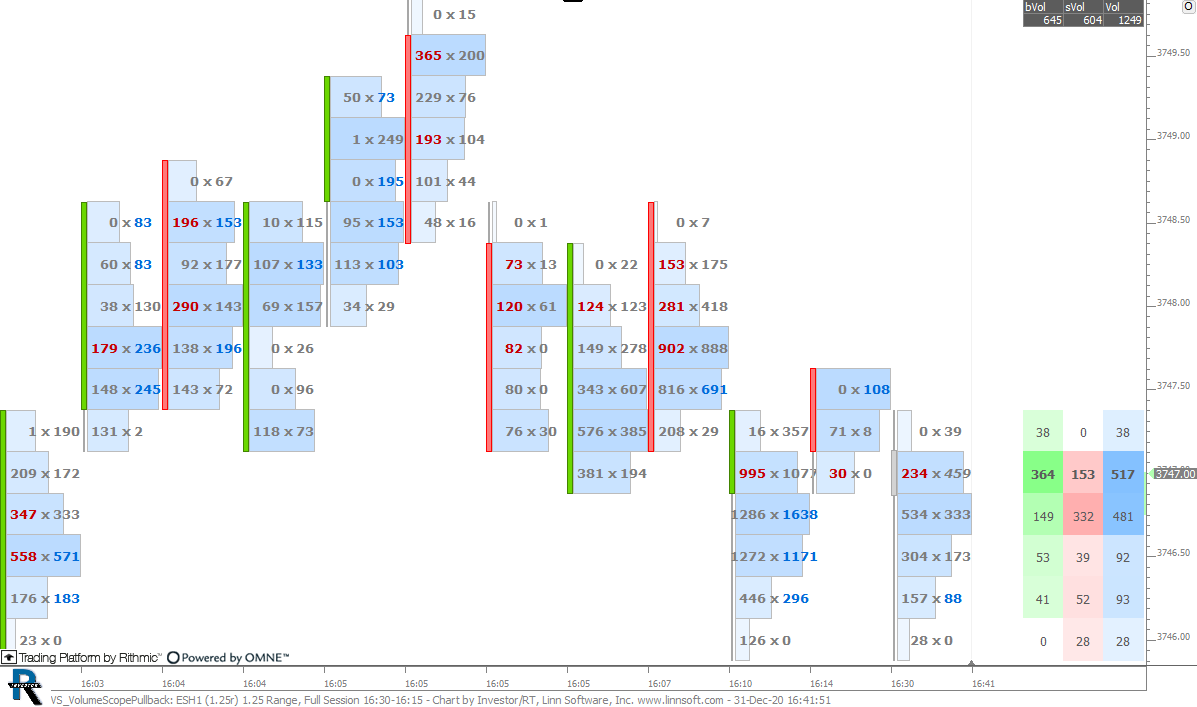
VS VolumeScopePullback (ESH1) cpayne [totalcount]
4 years 3 months ago
This chart was uploaded by Investor/RT 14.2.5 showing symbol: ESH1. |
View |
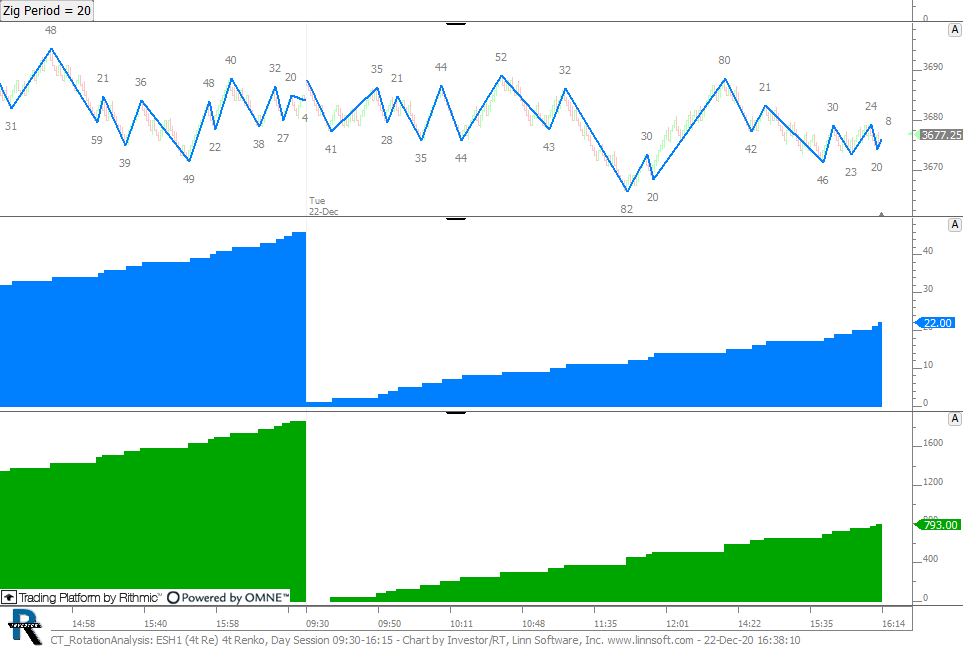 |
CT RotationAnalysis (ESH1) cpayne [totalcount]
4 years 3 months ago
This chart was uploaded by Investor/RT 14.2.5 showing symbol: ESH1. |
View |
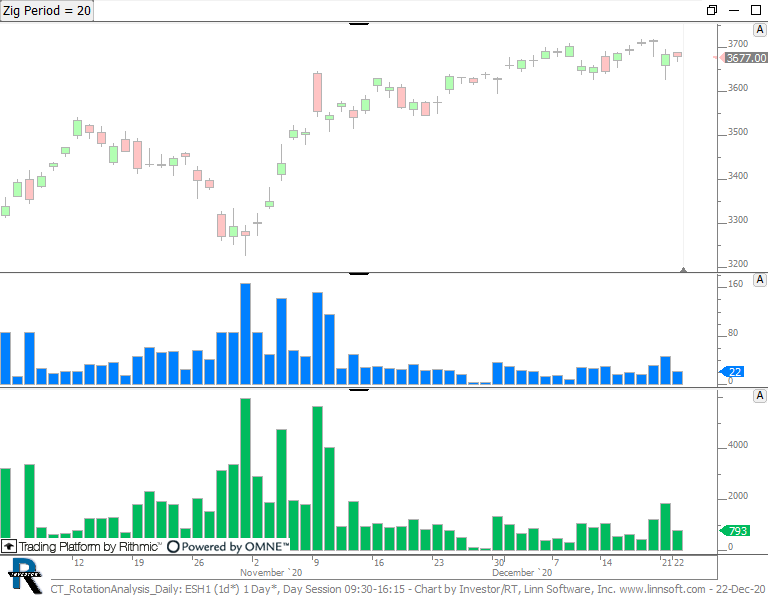 |
CT RotationAnalysis Daily (ESH1) cpayne [totalcount]
4 years 3 months ago
This chart was uploaded by Investor/RT 14.2.5 showing symbol: ESH1. |
View |
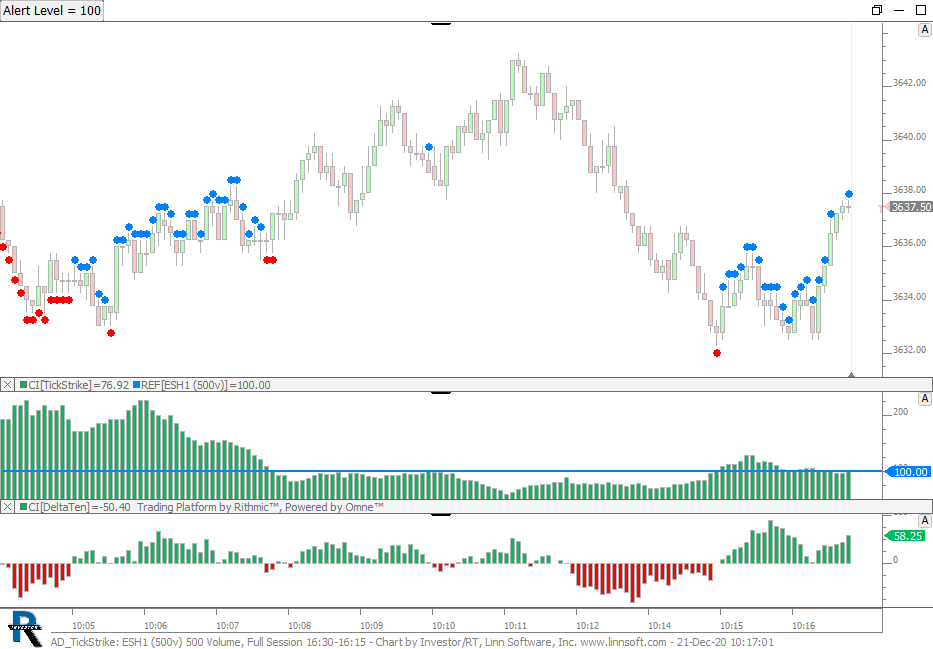 |
AD TickStrike (ESH1) cpayne [totalcount]
4 years 3 months ago
This chart was uploaded by Investor/RT 14.2.5 showing symbol: ESH1. |
View |
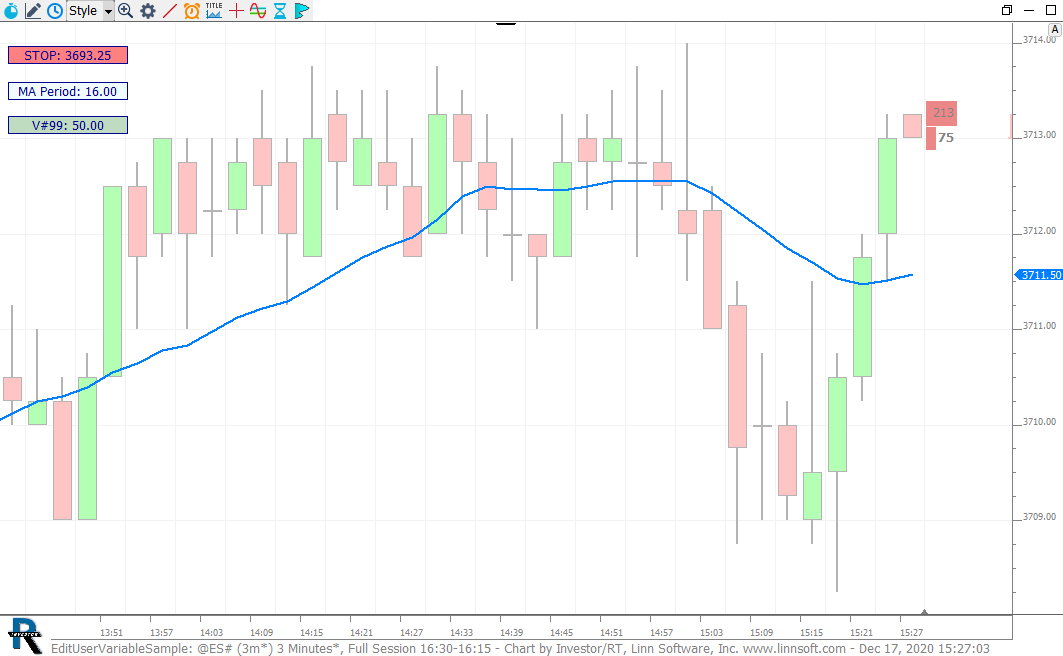 |
EditUserVariableSample william-linn [totalcount]
4 years 4 months ago
EditUserVariable RTX Sample Chart. |
View |
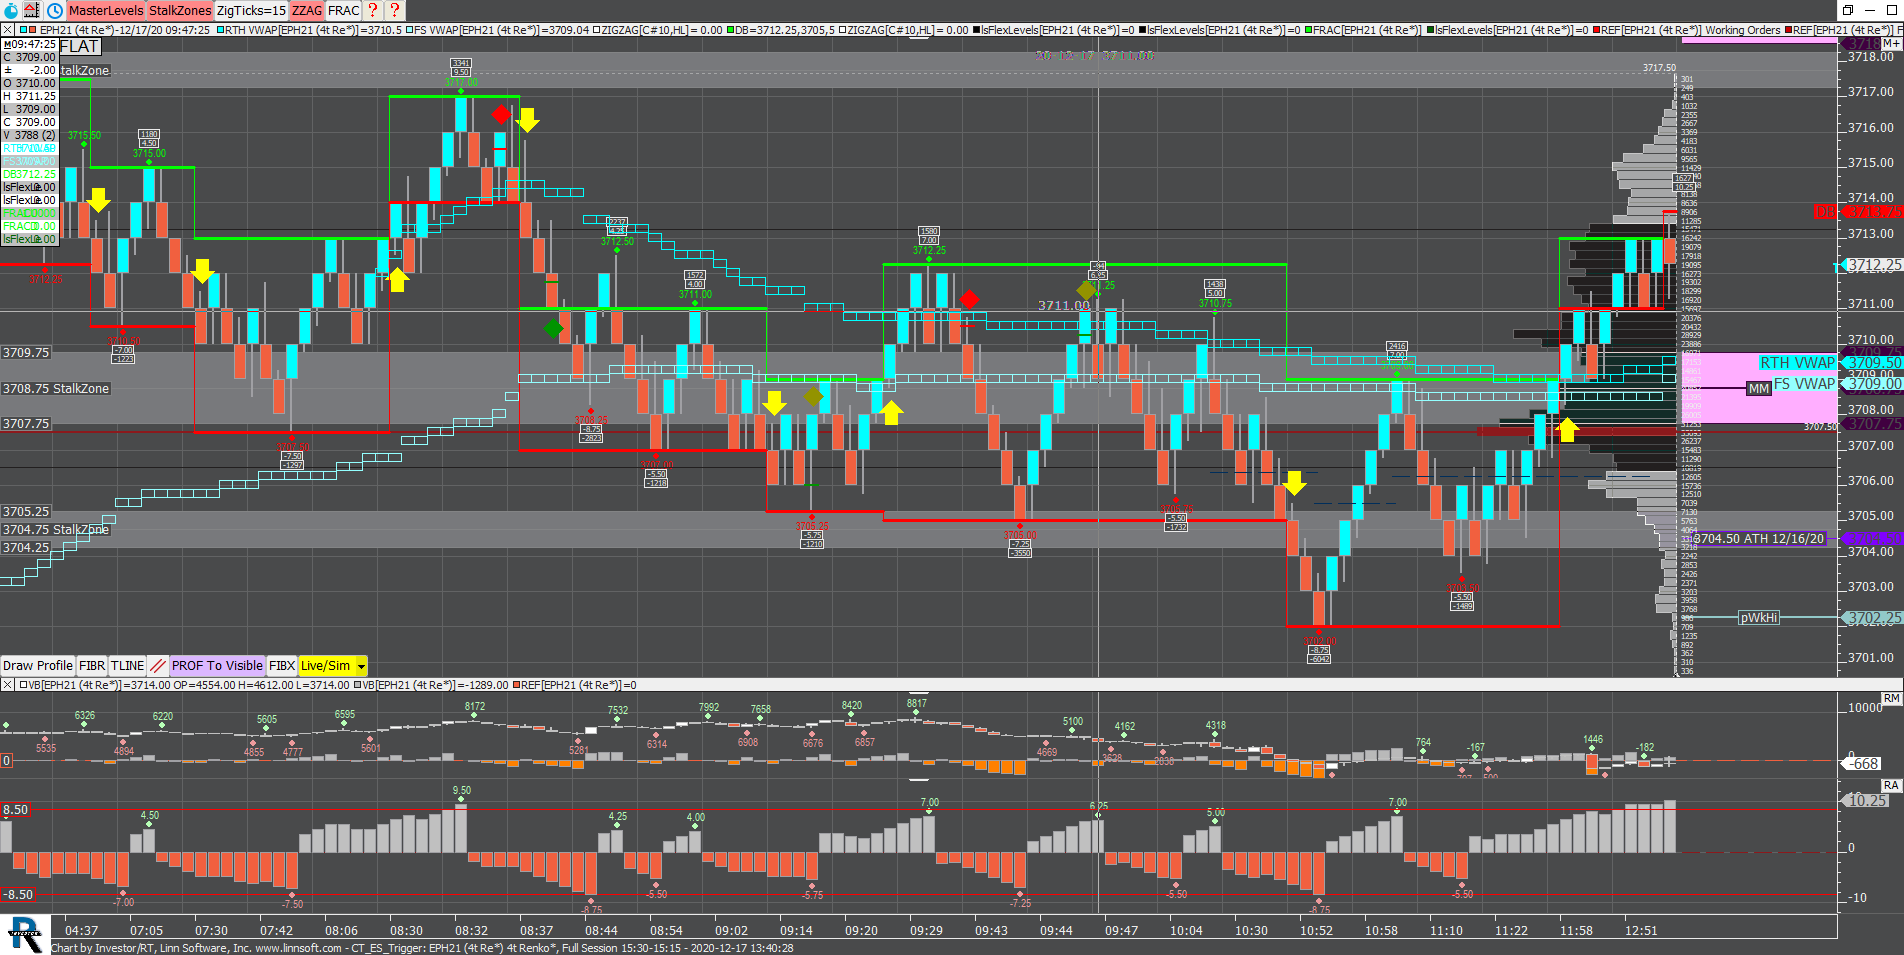 |
CT ES Trigger (EPH21) Robert Smith [totalcount]
4 years 4 months ago
This chart was uploaded by Investor/RT 14.2.5 showing symbol: EPH21. |
View |
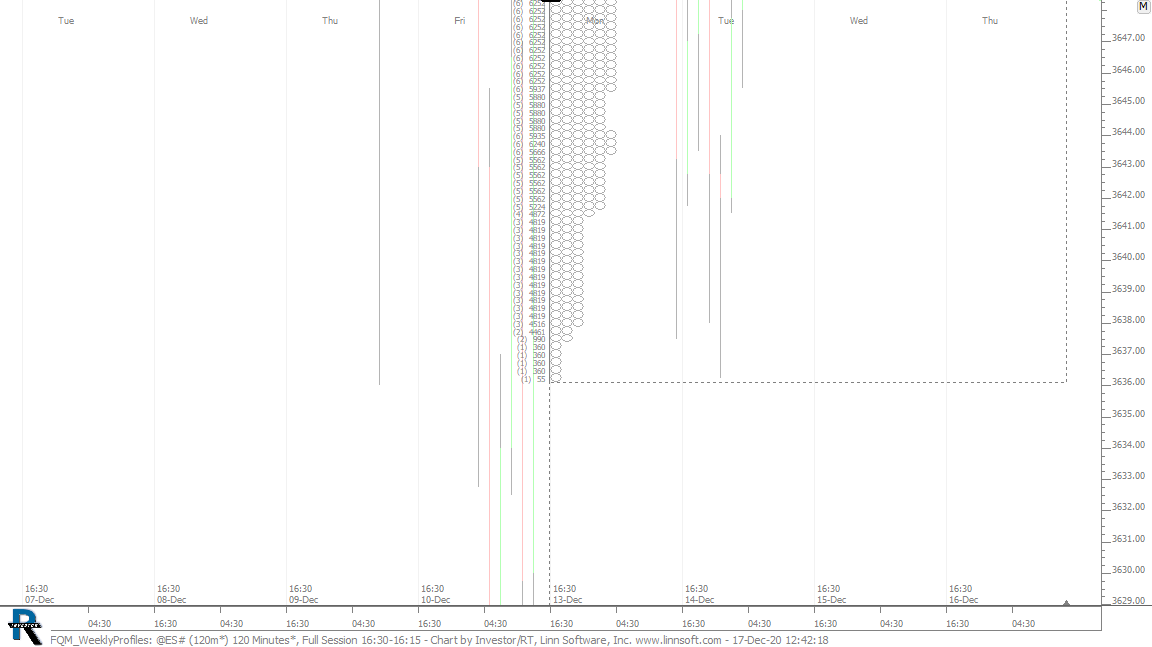 |
FQM WeeklyProfiles (@ES#) cpayne [totalcount]
4 years 4 months ago
Weekly Profiles - 120 Minute TPOs. This chart was uploaded by Investor/RT 14.2.5 showing symbol: @ES#. |
View |
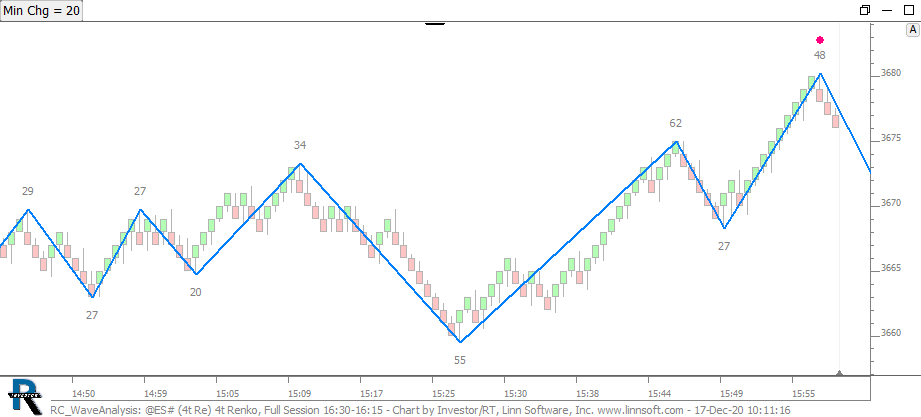 |
RC WaveAnalysis (@ES#) cpayne [totalcount]
4 years 4 months ago
Wave Study. This chart was uploaded by Investor/RT 14.2.5 showing symbol: @ES#. |
View |
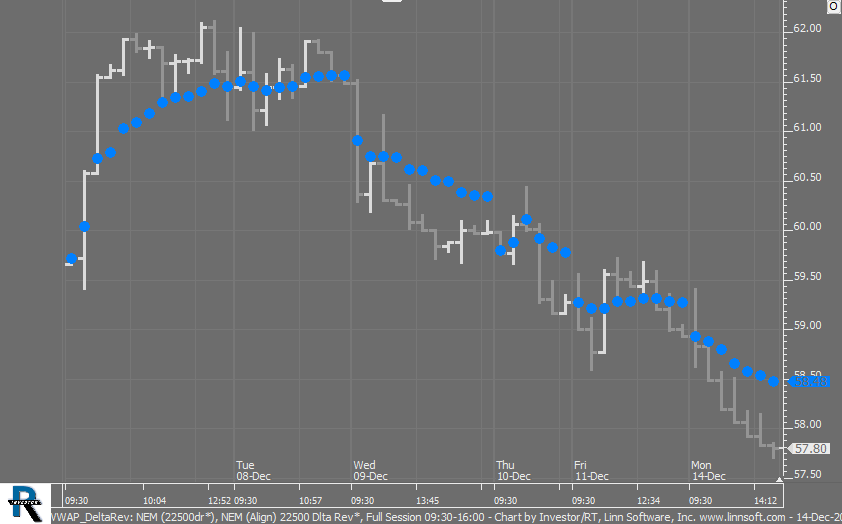 |
VWAP DeltaRev (NEM) cpayne [totalcount]
4 years 4 months ago
This chart was uploaded by Investor/RT 14.2.5 showing symbol: NEM. |
View |
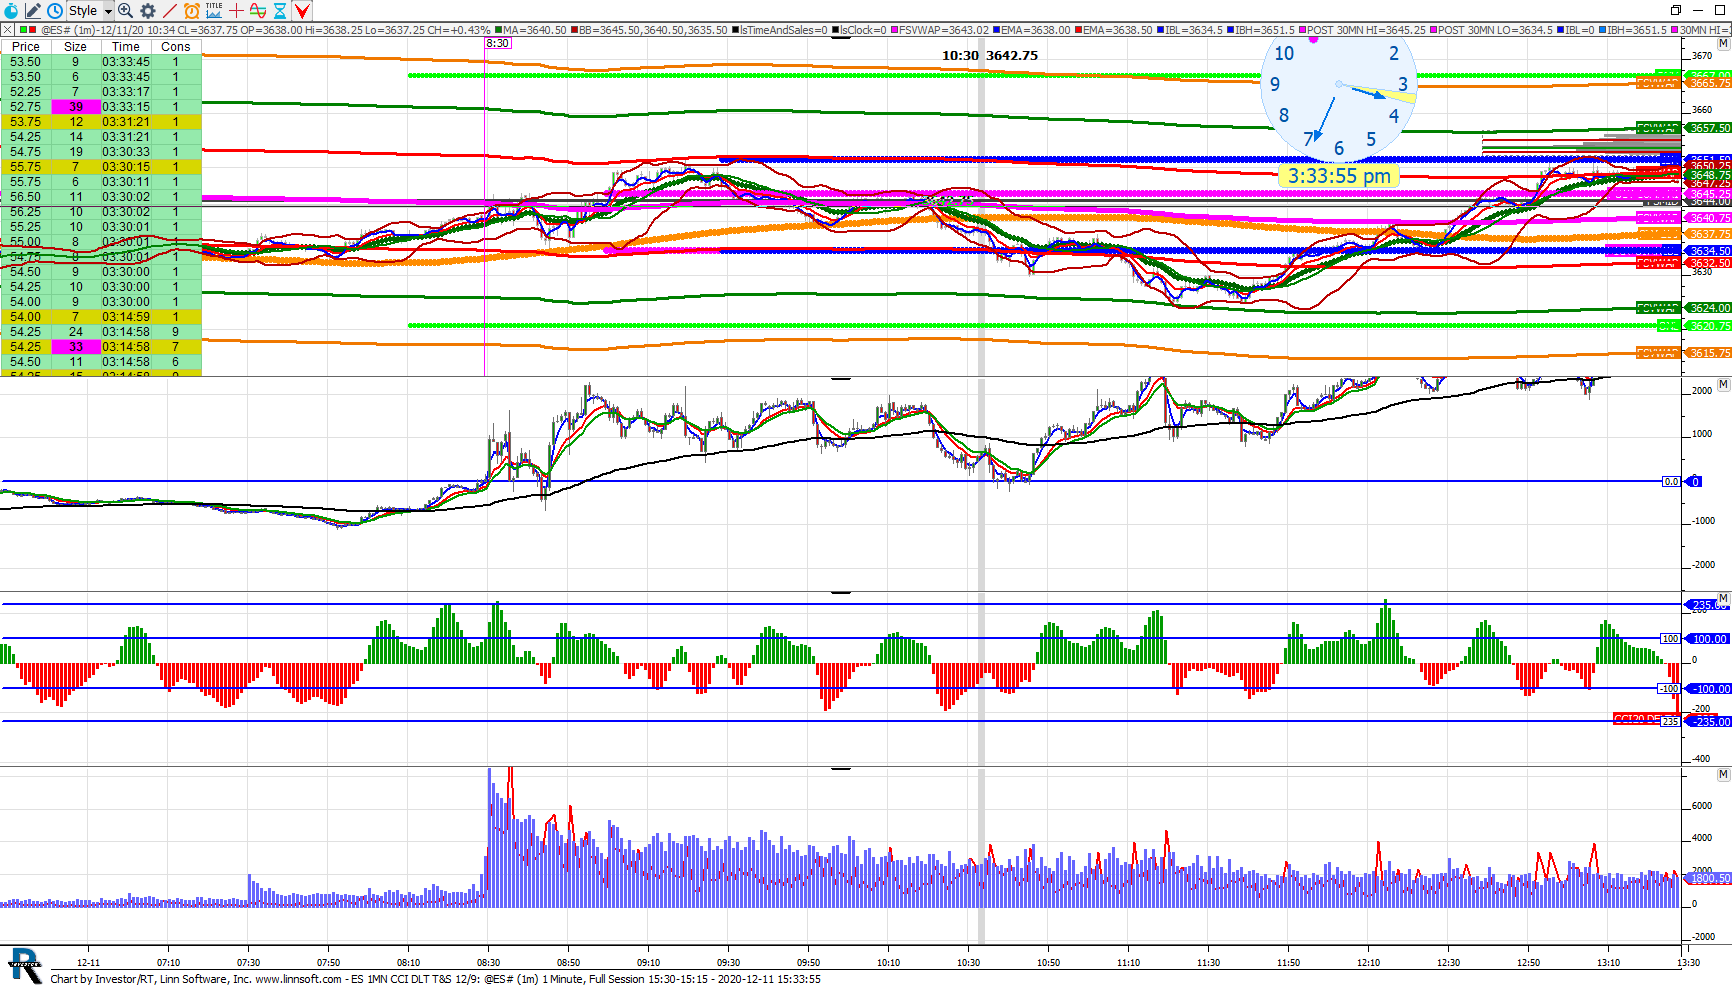 |
ES 1MN CCI DLT TS 12 9 (@ES#) achoo58 [totalcount]
4 years 4 months ago
This chart was uploaded by Investor/RT 14.2.5 showing symbol: @ES#. |
View |
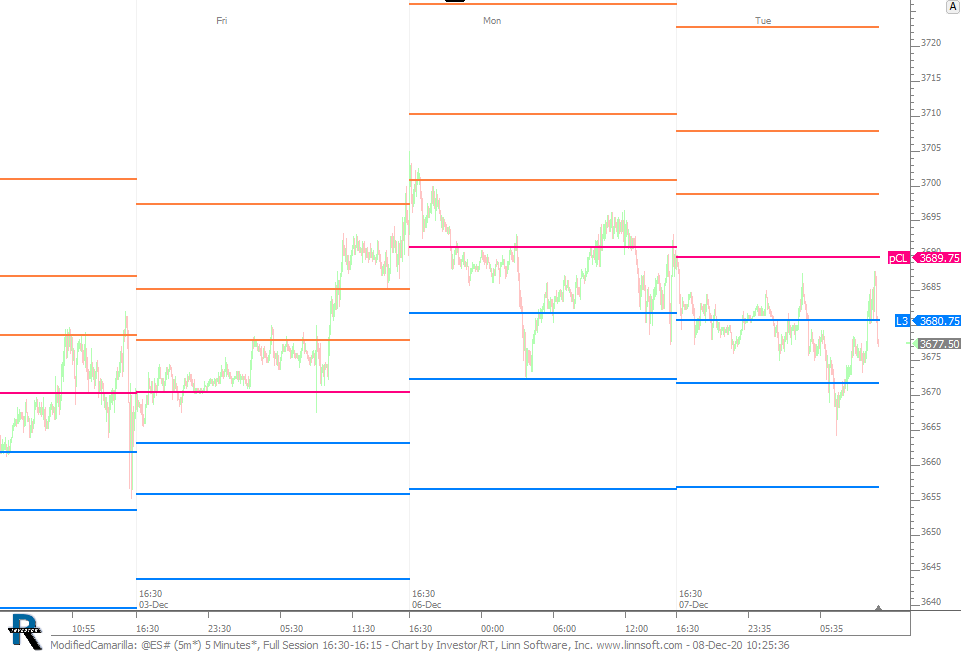 |
ModifiedCamarilla (@ES#) cpayne [totalcount]
4 years 4 months ago
Modified Camarilla. This chart was uploaded by Investor/RT 14.2.5 showing symbol: @ES#. |
View |
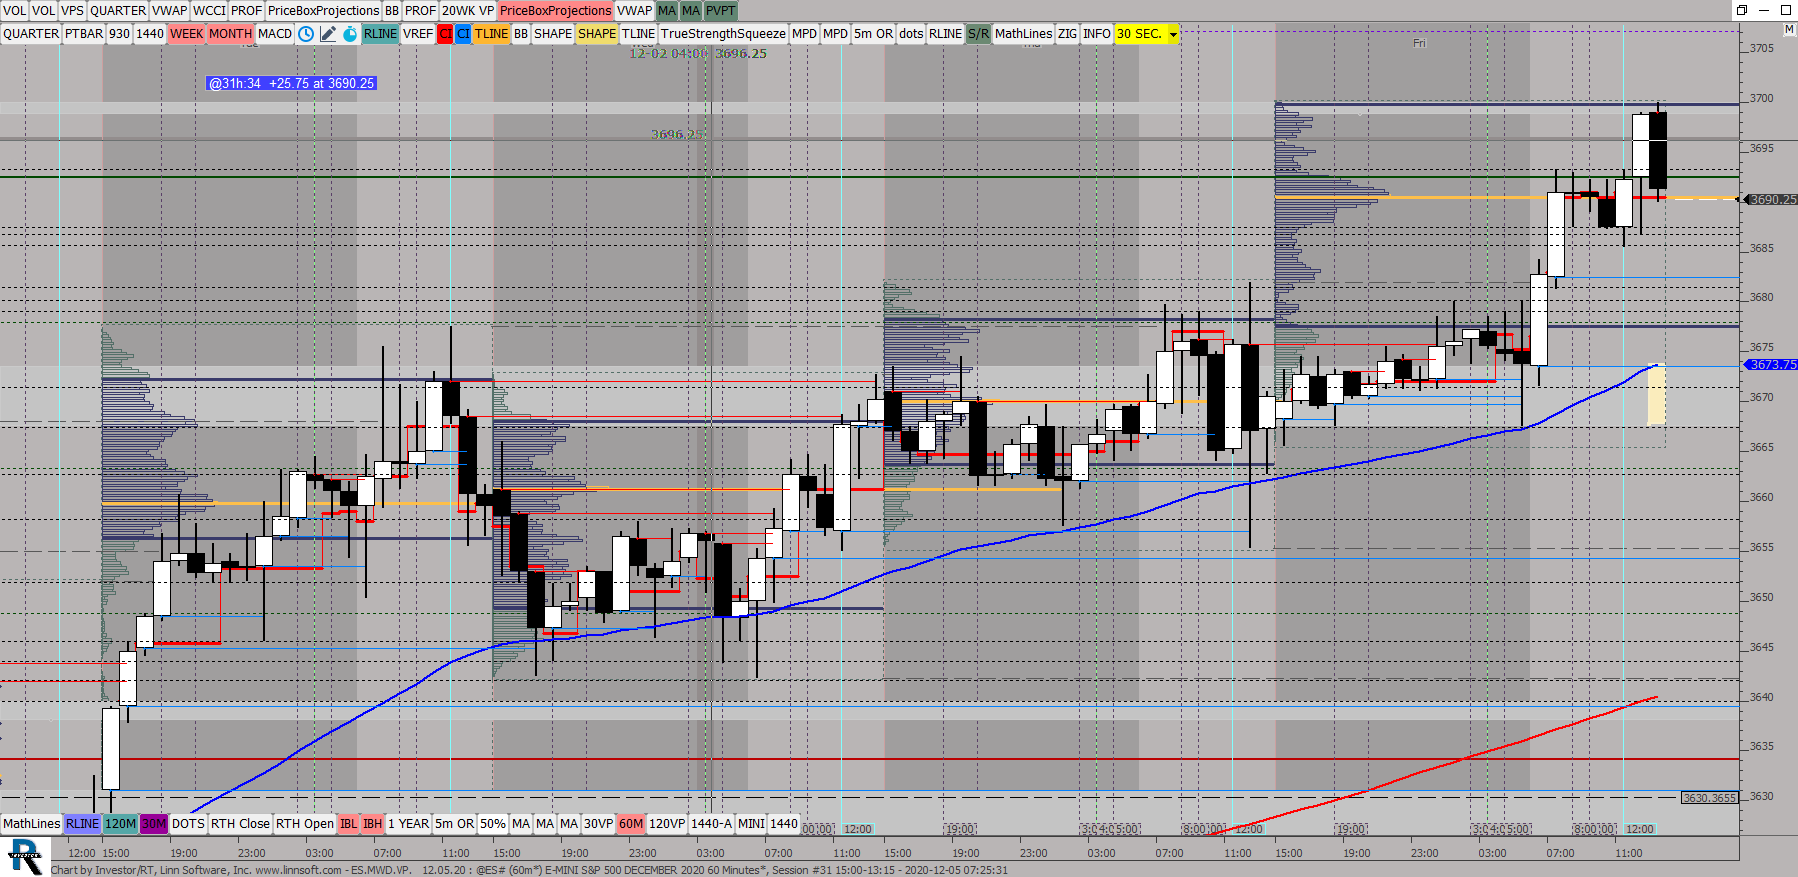 |
ESMWDVP (@ES#) ES42 [totalcount]
4 years 4 months ago
60 MIN Candles 24 HR. Profiles. This chart was uploaded by Investor/RT 14.2.4 showing symbol: @ES#. |
View |
 |
ES MP SEPT (@ES#) ES42 [totalcount]
4 years 4 months ago
!!/30 to present Merge Profile. This chart was uploaded by Investor/RT 14.2.4 showing symbol: @ES#. |
View |
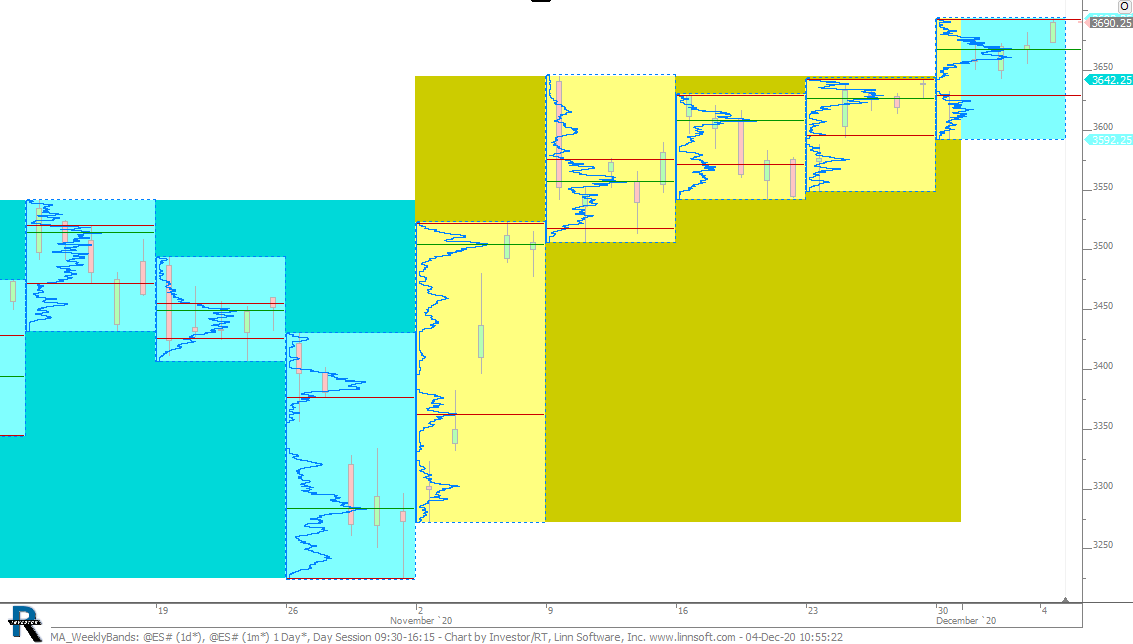 |
MA WeeklyBands (@ES#) cpayne [totalcount]
4 years 4 months ago
Weekly Profiles with Alternating Months Highlighted. This chart was uploaded by Investor/RT 14.2.5 showing symbol: @ES#. |
View |
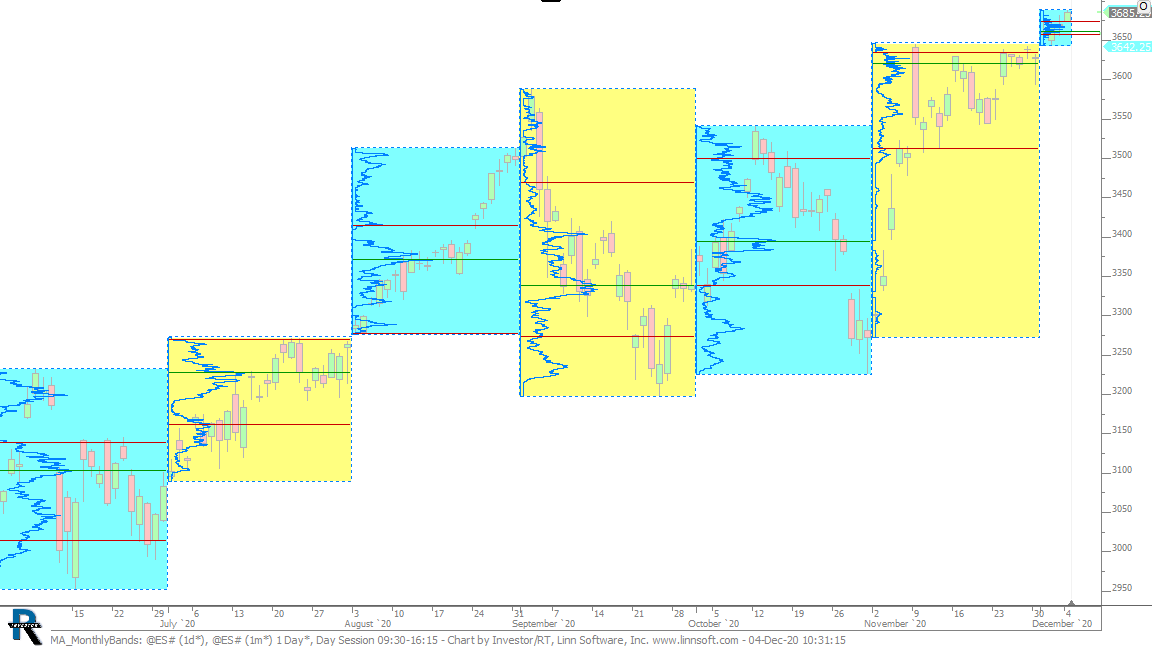 |
MA MonthlyBands (@ES#) cpayne [totalcount]
4 years 4 months ago
Alternating Months Highlighted and Profiled. This chart was uploaded by Investor/RT 14.2.5 showing symbol: @ES#. |
View |
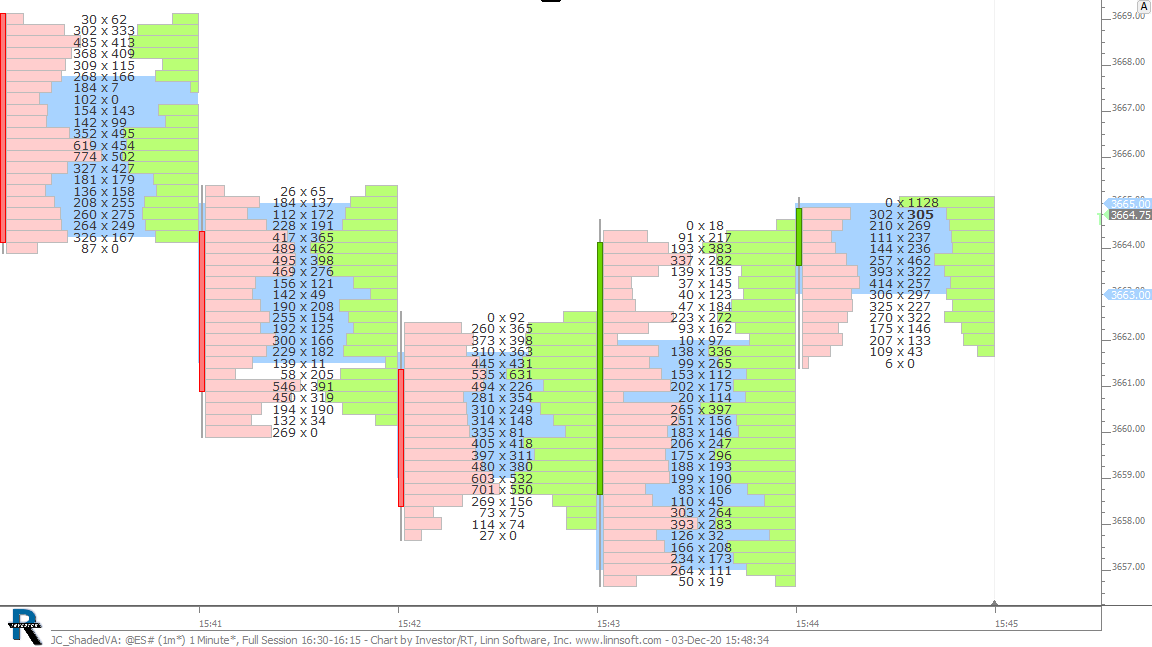 |
JC ShadedVA (@ES#) cpayne [totalcount]
4 years 4 months ago
This chart was uploaded by Investor/RT 14.2.5 showing symbol: @ES#. |
View |
 |
Sample billfitch12 [totalcount]
4 years 4 months ago
This chart was uploaded by Investor/RT 14.2.4. |
View |
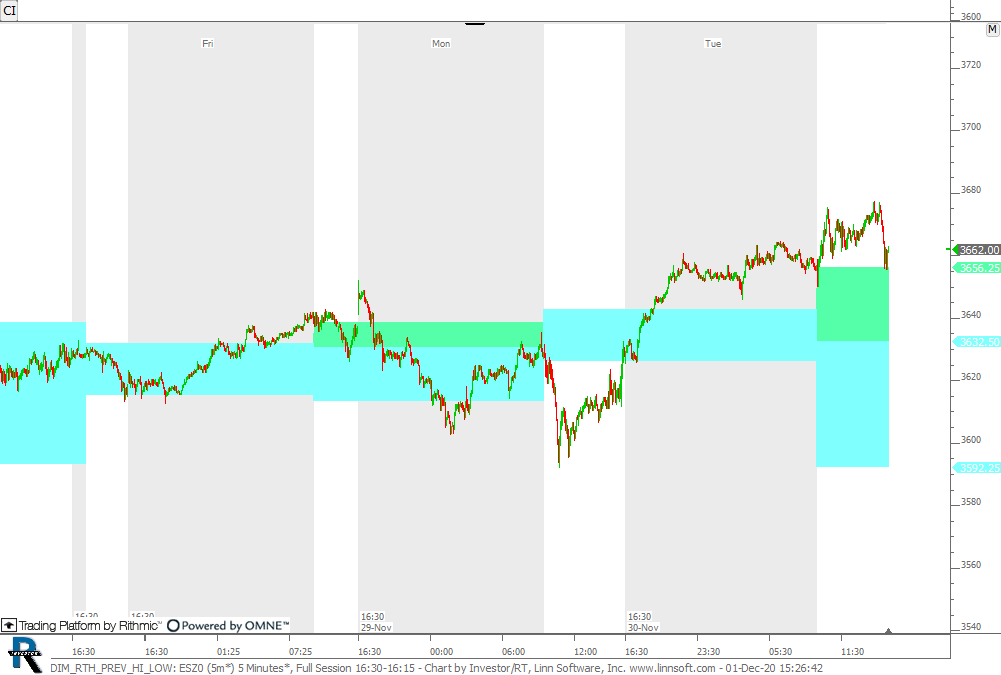 |
DIM RTH PREV HI LOW (ESZ0) cpayne [totalcount]
4 years 4 months ago
This chart was uploaded by Investor/RT 14.2.5 showing symbol: ESZ0. |
View |
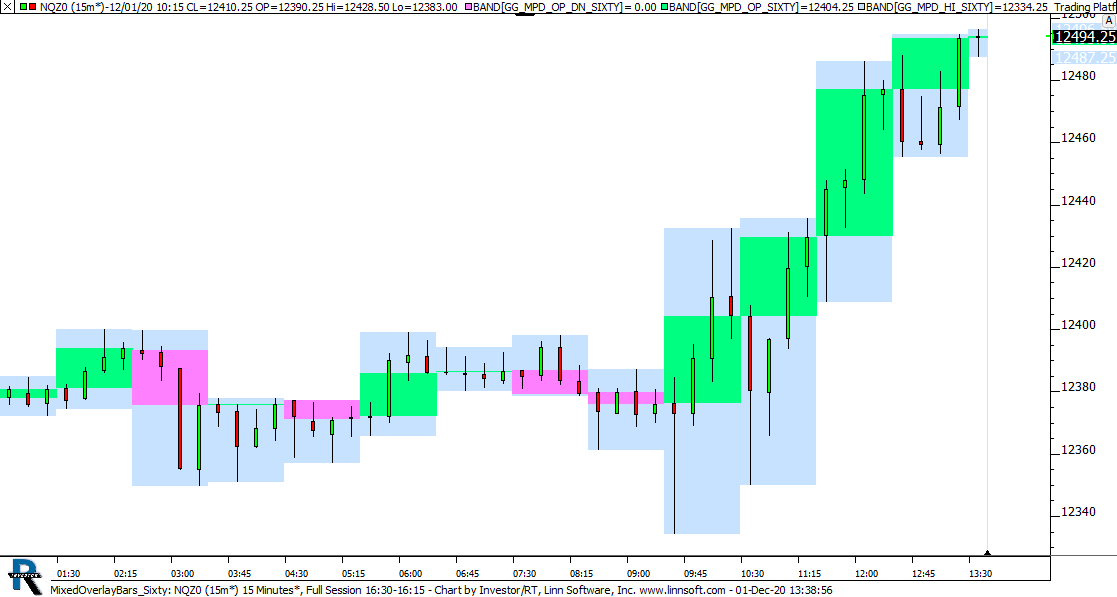 |
MixedOverlayBars Sixty (NQZ0) cpayne [totalcount]
4 years 4 months ago
This chart was uploaded by Investor/RT 14.2.5 showing symbol: NQZ0. |
View |
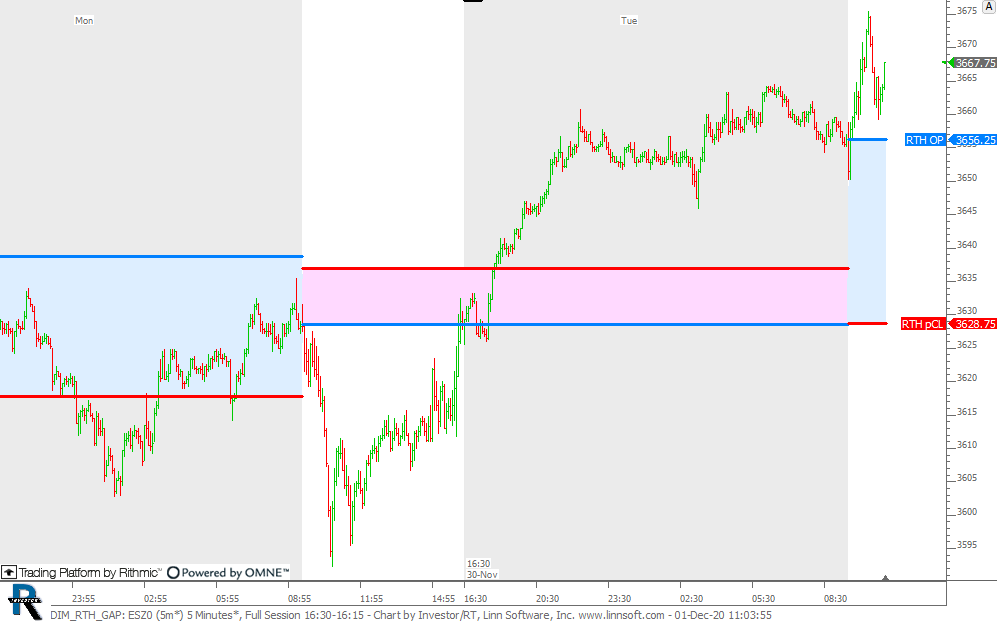 |
DIM RTH GAP (ESZ0) cpayne [totalcount]
4 years 4 months ago
RTH Gap on Full Session Chart. Blue on Gap Up and Pink on Gap Down. This chart was uploaded by Investor/RT 14.2.5 showing symbol: ESZ0. |
View |
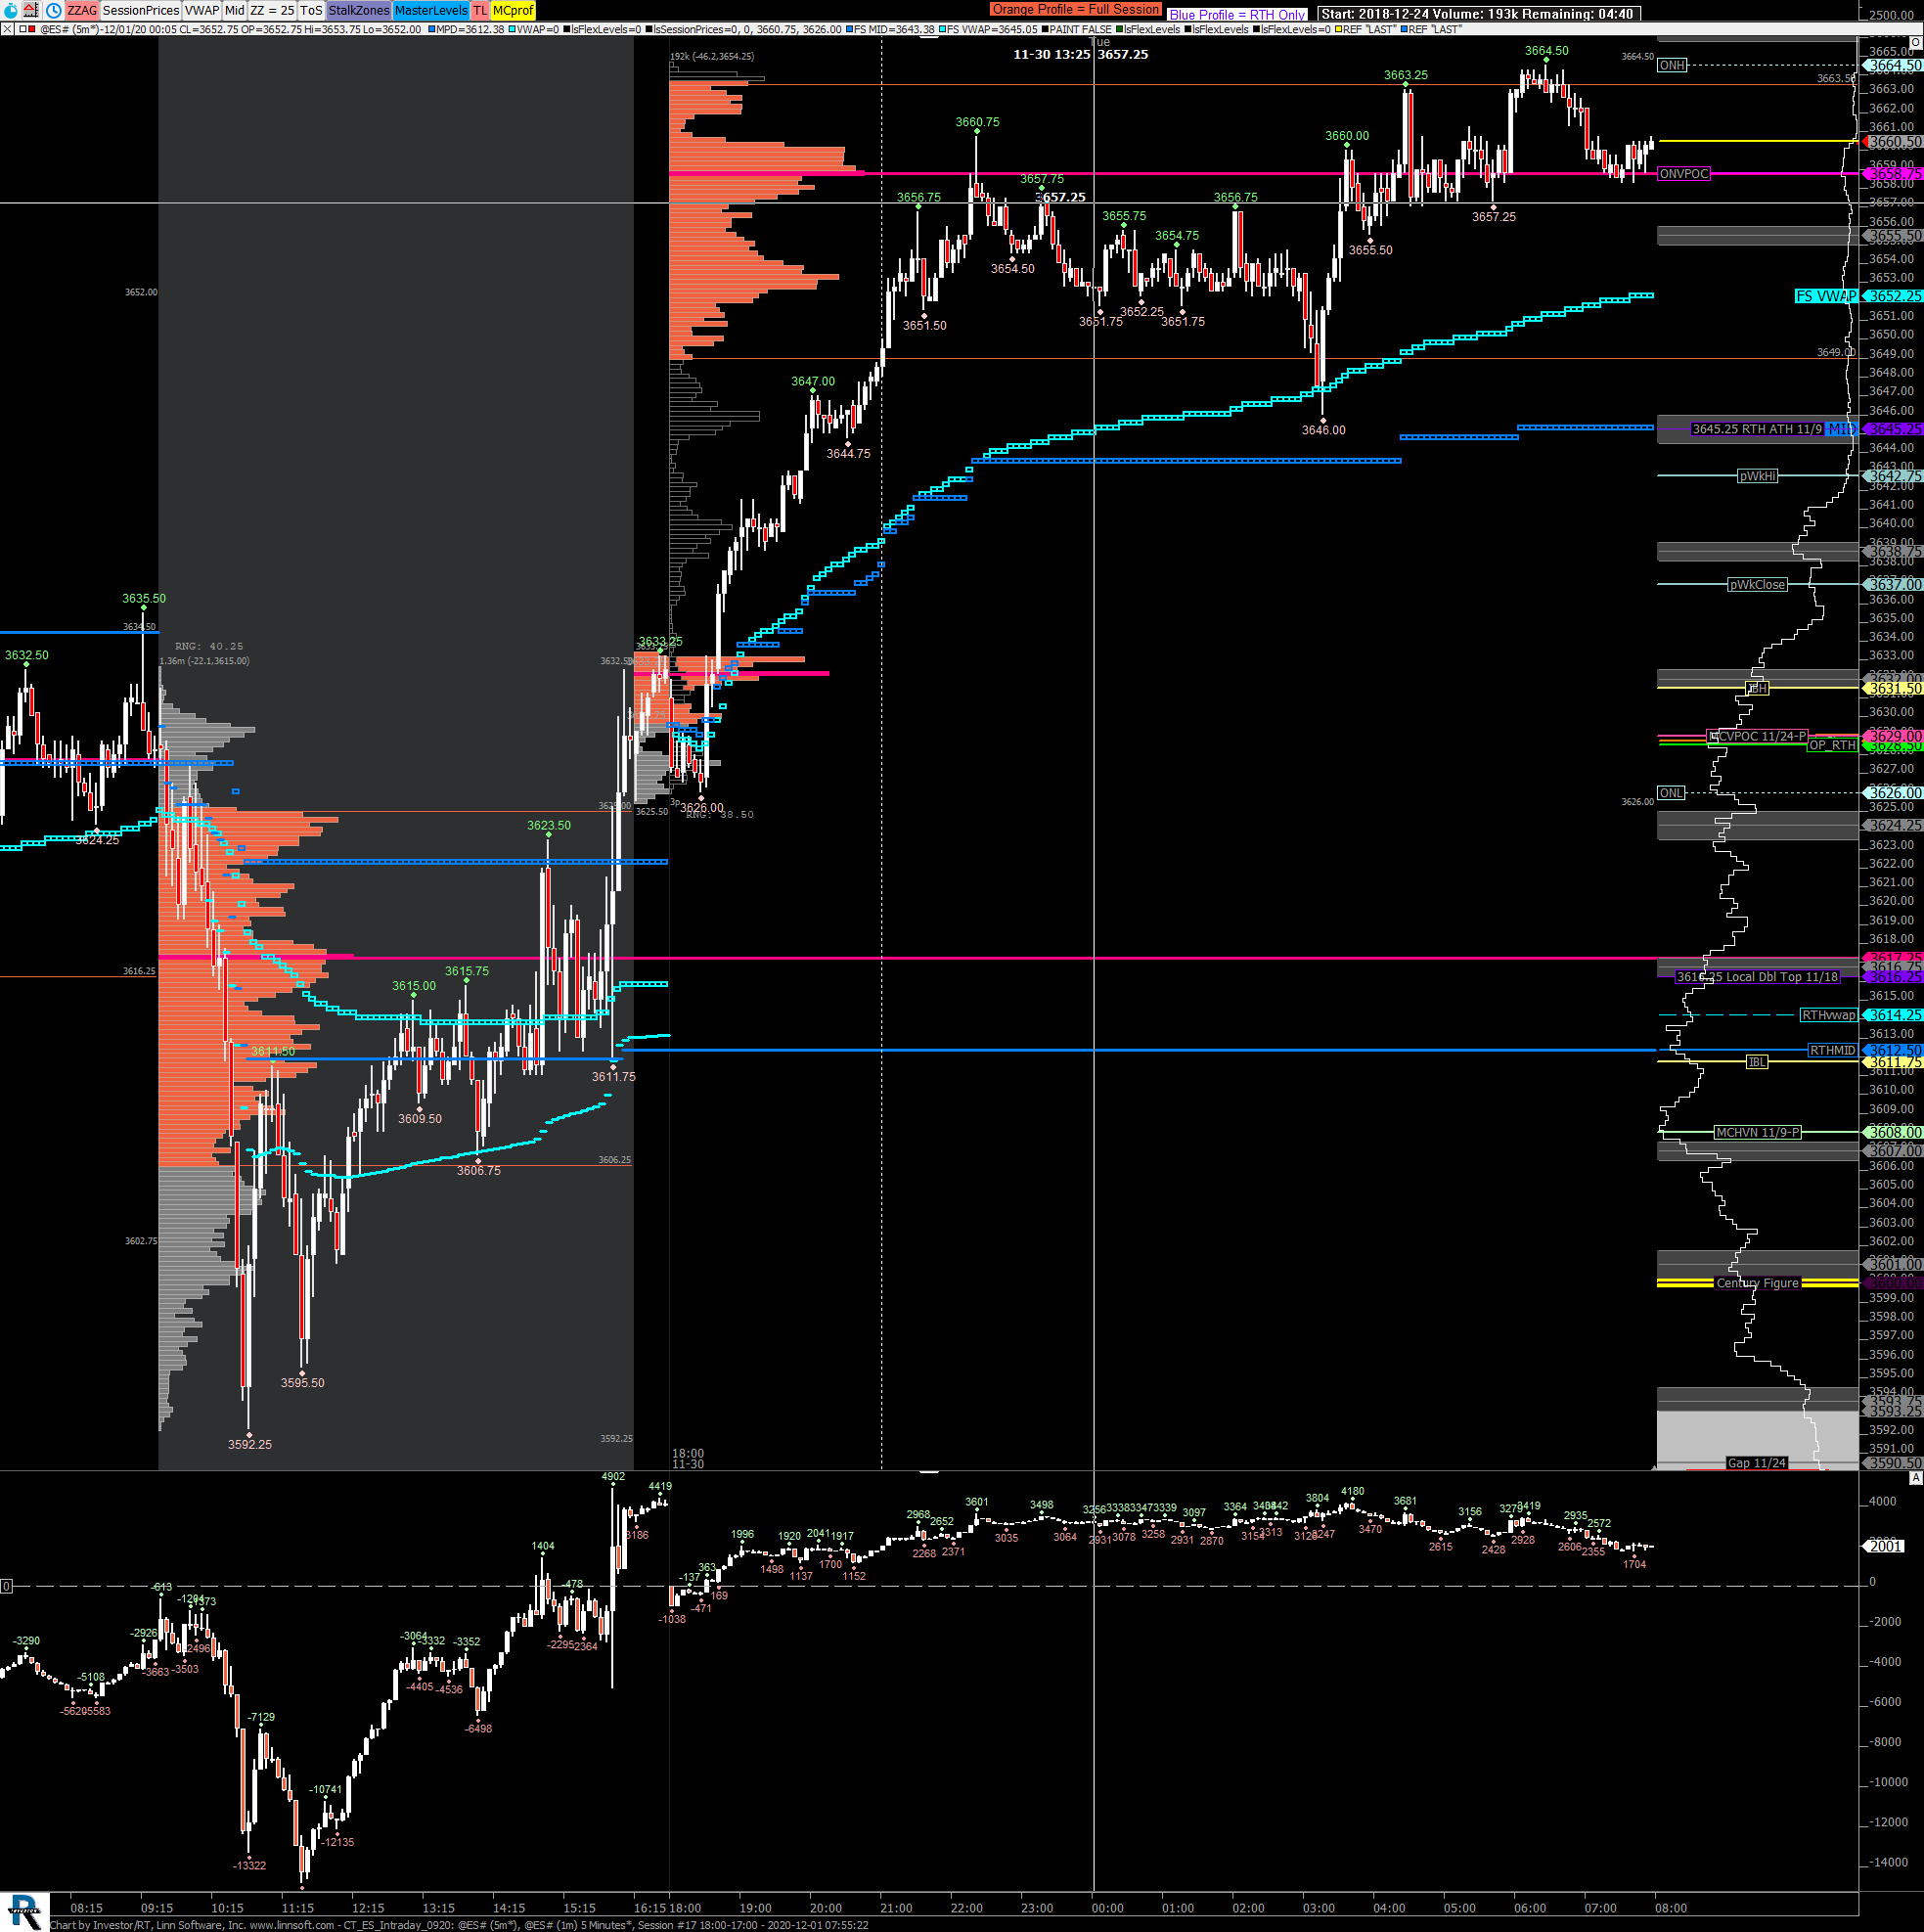 |
CT ES Intraday 0920 (@ES#) jproetsch [totalcount]
4 years 4 months ago
ES 24 hr Chart with profile. This chart was uploaded by Investor/RT 14.2.4 showing symbol: @ES#. |
View |
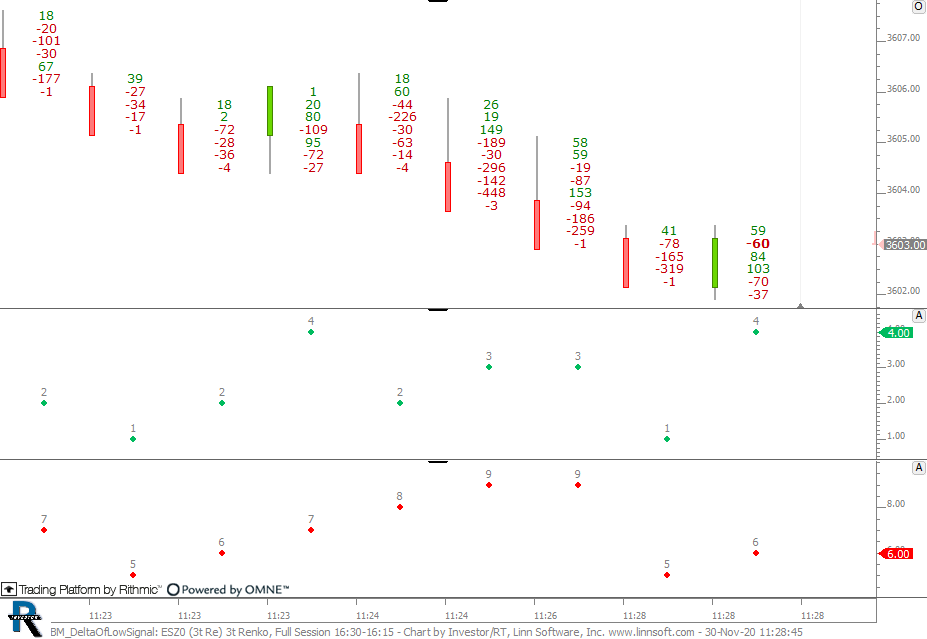 |
BM DeltaOfLowSignal (ESZ0) cpayne [totalcount]
4 years 4 months ago
This chart was uploaded by Investor/RT 14.2.5 showing symbol: ESZ0. |
View |
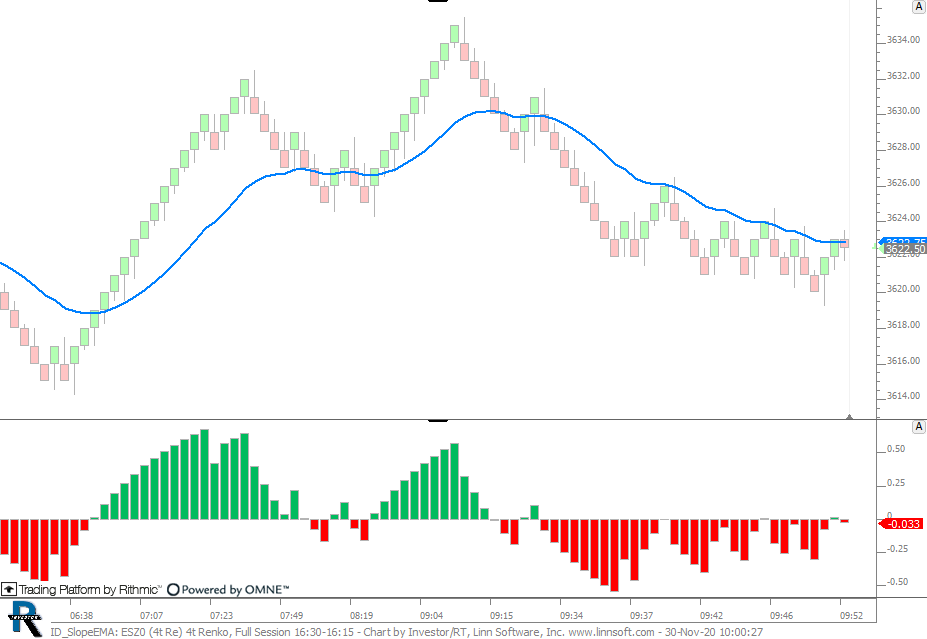 |
ID SlopeEMA (ESZ0) cpayne [totalcount]
4 years 4 months ago
This chart was uploaded by Investor/RT 14.2.5 showing symbol: ESZ0. |
View |
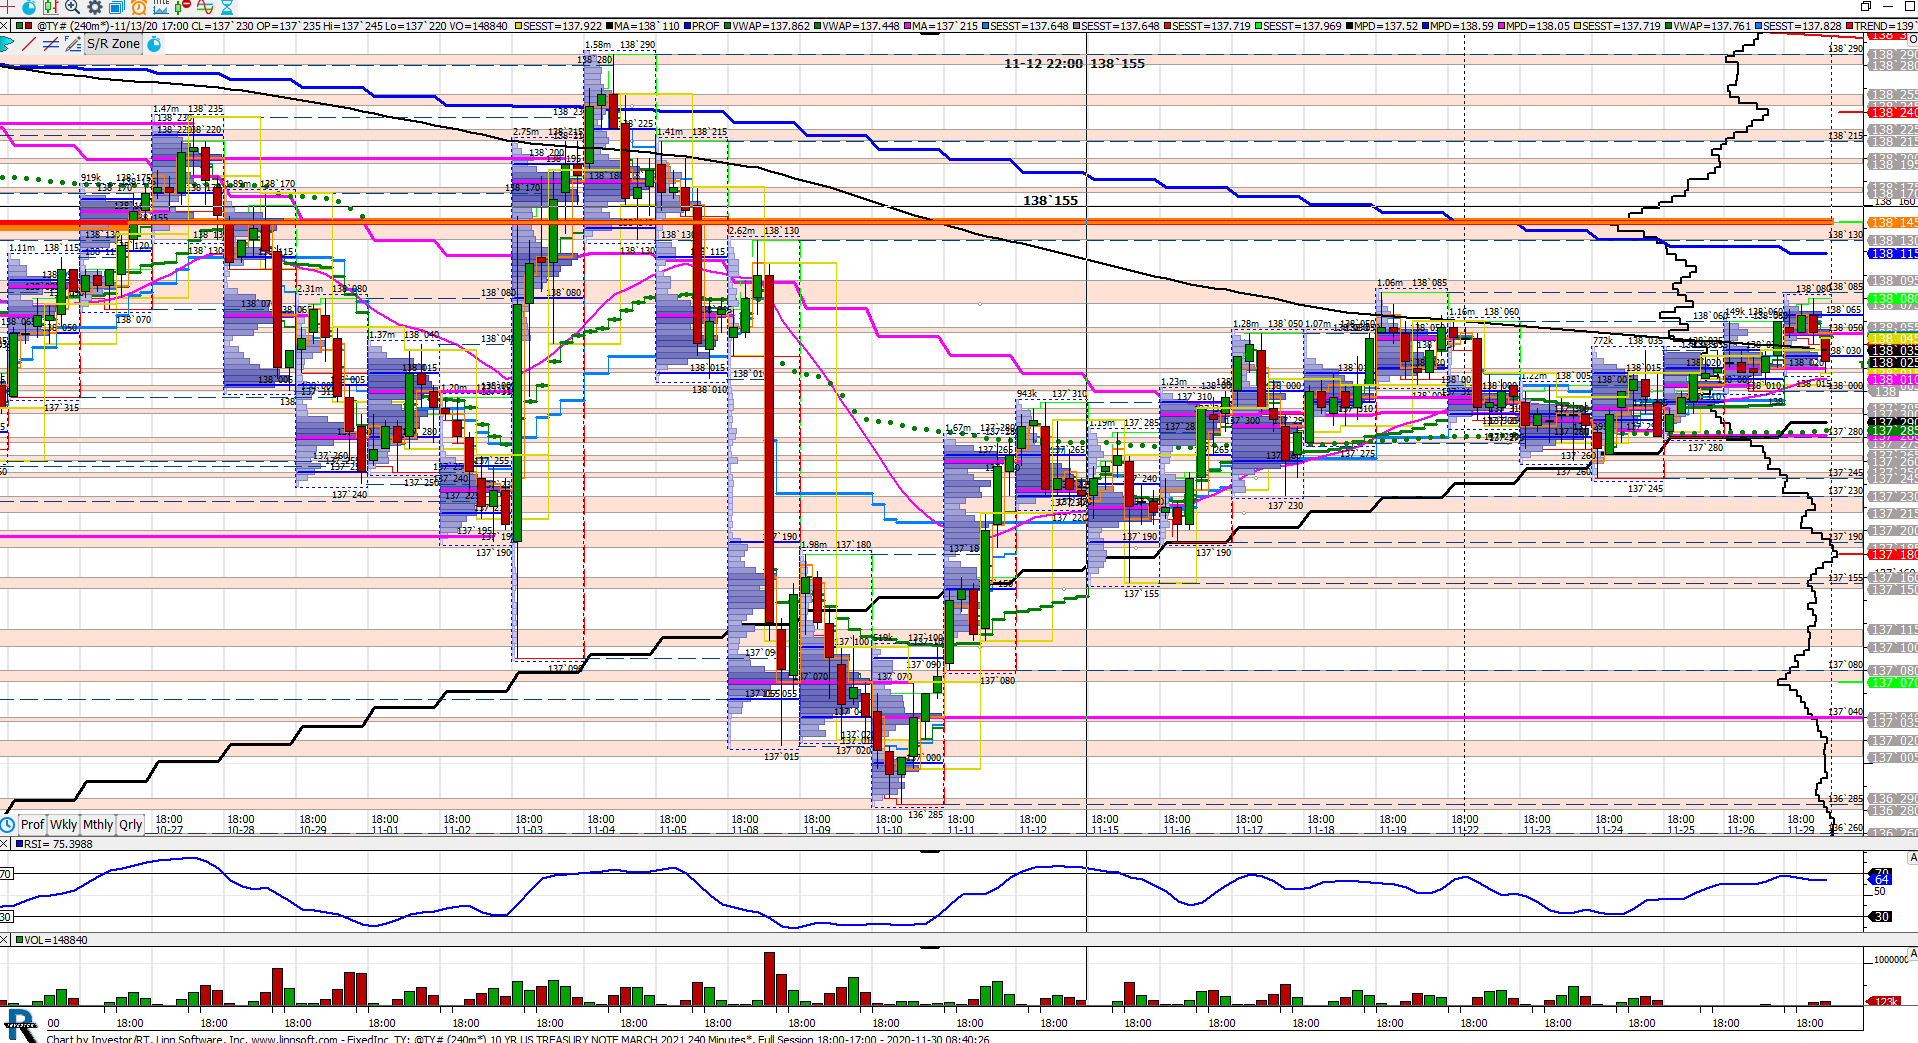 |
FixedInc TY (@TY#) npettinato [totalcount]
4 years 4 months ago
This chart was uploaded by Investor/RT 13.6.15 showing symbol: @TY#. |
View |
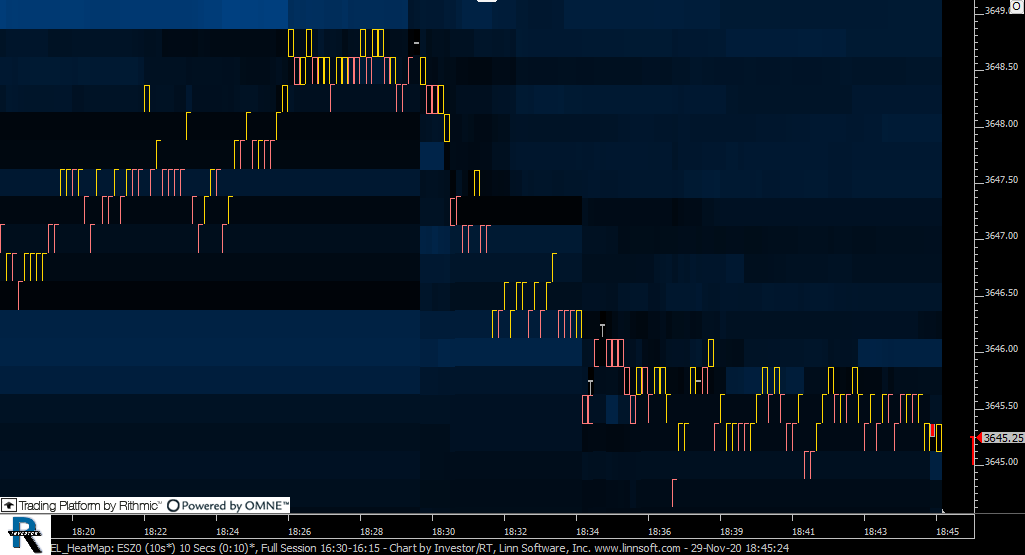 |
EL HeatMap (ESZ0) cpayne [totalcount]
4 years 4 months ago
This chart was uploaded by Investor/RT 14.2.5 showing symbol: ESZ0. |
View |