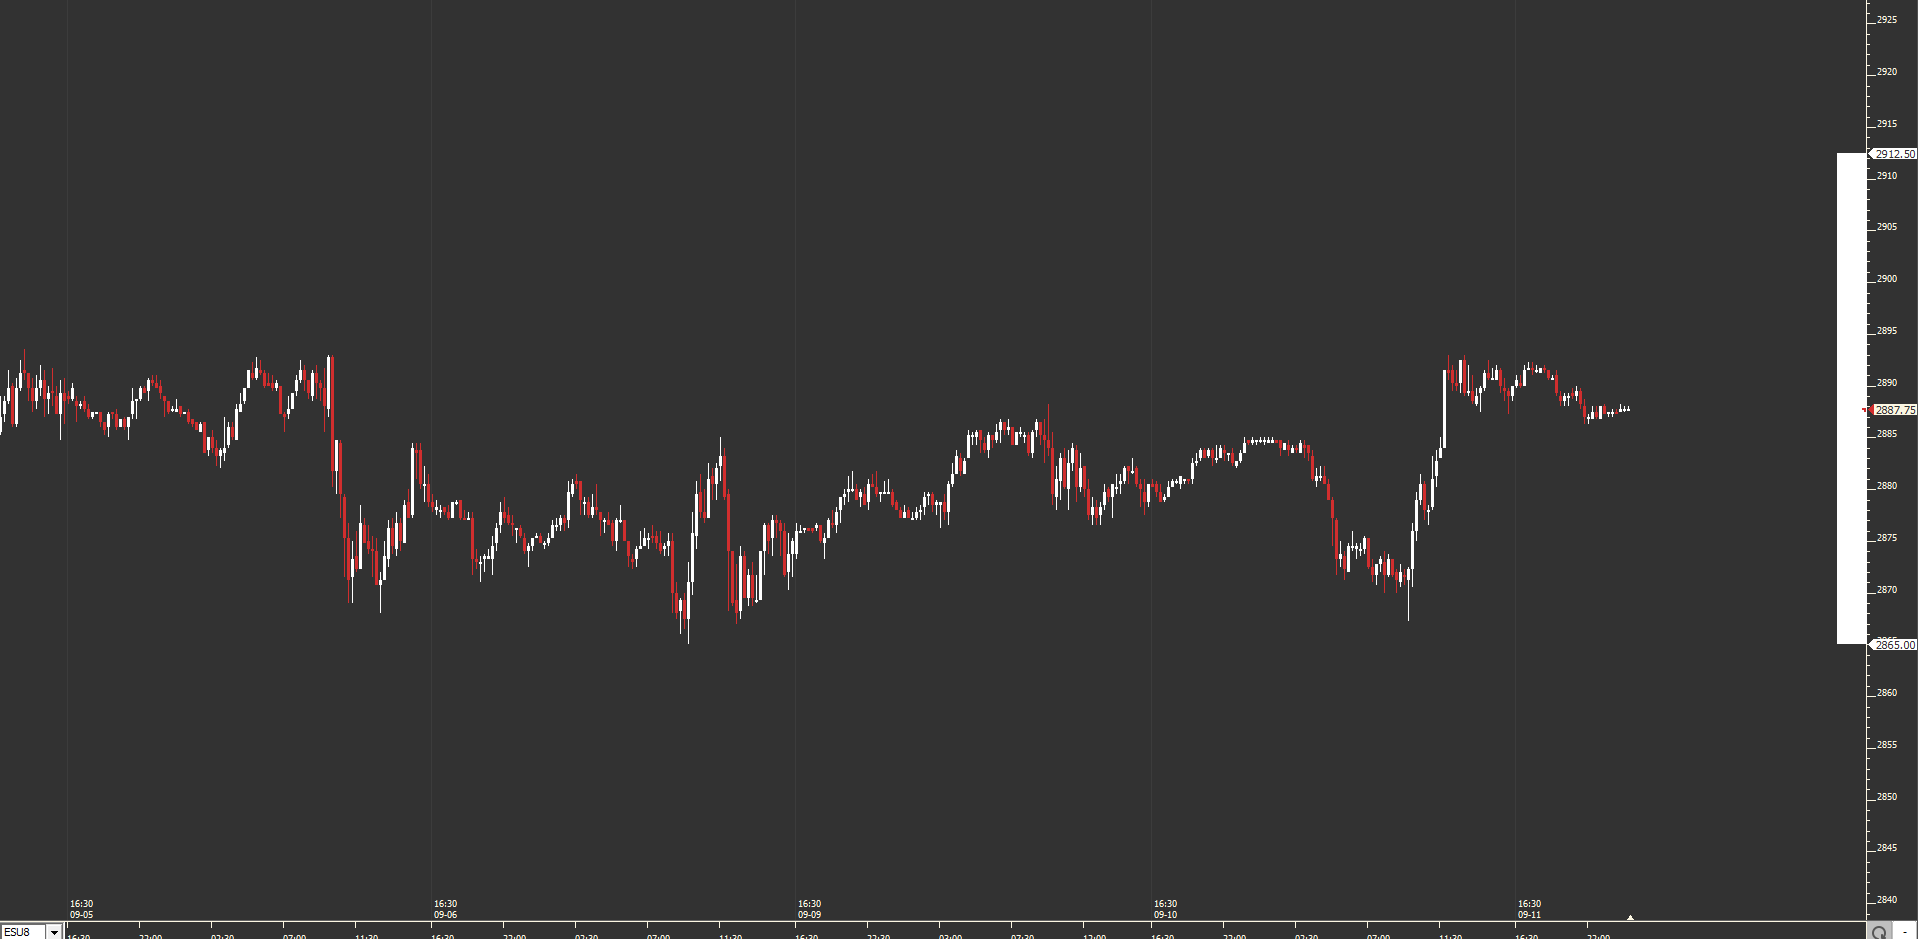
Having to shift between charts in order to see higher time frames can be bothersome. This is why I have bands set up to show me e.g. last weeks range (see attachment). The problem is that the bands won't tell me last weeks open and close and also they say nothing about the direction of last week. An easy solution would be to have them displayed as candlesticks, colored by CL>OP or CL


Here is one solution. I've actually used 3 bands indicators for this. I had to use 2 different ones to achieve the up (green) and pink (down) colors since Bands does not have an up and down color for the Compact Bands options. I will look into enabling that 2nd color for when the lower price is above the upper price (custom indicator).
Some notes.... you can achieve a more efficient solution by having just one chart somewhere...that you just opened once per day, that set these 4 prices into 4 V# variables. Could open that at the start of session Monday and close for rest of week....weekly (and maybe prev month, etc) values would be set for week, and you could then use much more efficient custom indicators with syntax just V#10 or V#11, etc....that would be extremely efficient. But since I did not use that solution for this chart (to make easier on you), I did set those bands to recalc every 5 minutes, which is obviously plenty, but will have neglible impact on performance (there are exceptions to that, like when you have periodicity set to price or time driven periodicities such as 2t renko or 100 volbar and the market is going crazy....then each indicator is forced to calc once per new bar).
https://www.linnsoft.com/charts/sa-weeklystats-es
You've given me a pretty good idea for an RTX Indicator. We could call it something like Calendar Statistics (ideas welcomed).
It would have maybe 10 checkbox options, with each one providing a listbox of options...
- Previous Day
- Previous Week
- Previous Month
- Previous Quarter
- Previous Year
- Previous X Days
(we could include some live updating options like Current Day, Current Week, Current Month, Last X Days, if needed)
Along with an option for candle colors (wick/up/down) and maybe drawing style with some options.
And some options for where to position it (right edge, left edge, etc)...
Thoughts?
Chad
That's pretty creative Chad, thanks!
Do I understand correctly that this syntax:
SESST * (SESST > SESST_CL)
makes sure that the correct color is showing?
Regarding the RTX indicator: Yes, that would be most welcome. For the position I would definitely prefer at the right edge with the option to stack several instances (e.g. weekly next to monthly). It should also include the option to define the session. If you want to go overboard, add a profile to it (maybe similar to Volume Scope where you can turn the candlestick on/off).
Name suggestion: Higher Time Frame Indicator.
Here is a preview of what I've come up with so far. This is one indicator which can produce up to 8 candles. Candles can be current or previous (any number back) of daily, weekly, monthly, quarter, yearly... Options for wick, up, and down colors for each. Optional border with color. User specified candle width and spacing. Plan on allowing a choice for session of chart, full, or day....as well as positioning options.
Perfect! When can we expect it?
Here is a beta version of CalendarCandles. Please test drive and give me your feedback.
Take this dll file (within the zip file)...
https://www.dropbox.com/s/hgkwp7s3g42iemc/betaCalendarCandles.zip?dl=0
and place it in this folder...
C:\Users\Chad\InvestorRT\dll\
(replace Chad with your windows username)
Also, create the following folder. It should be an empty folder with name betaCalendarCandles
C:\Users\Chad\InvestorRT\rtx\betaCalendarCandles
now restart IRT and should be able to add betaCalendarCandles to chart from Add Indicator window.
Some keyboard shortcuts. Select indicator and then use mouse-scroll wheel to adjust candle widths. Shift+scrollwheel to adjust spacing. Ctrl+scrollwheel to adjust wick width.
Thanks for being so fast Chad!
My first impression was that everything is alright. I miss the option to set the session for each candle indivudually. So I tried to stack several instances of the indicator next to eachother. This is where I noticed that "Day Session" does not work. If you look at this image
https://imgur.com/a/WHbYbiq
you can see that the right candle is set to "Full Session", the left candle to "Day Session" and the Chart Session to "Day Session". Both candles show the Full Session.
Ah yes. I forgot to mention that. Making that session option work required development on the IRT side. You will need the NEXT release of IRT in order for that to work. What you should be seeing (and you can confirm) is the session always reflecting the session of the chart.
But yes, multiple instances should stack nicely for you side by side (on right or left) so once you get next release of IRT, you should be able to easily get your multiple sessions side by side.
Keep the feedback coming.
Hi, would it be possible to leverage user defined custom sessions? like an overnight only session 5pm-8:30am ct, or the 8:30am-9:30am ct Initial Balance?
Ideally i would want to achieve a candle/band for each of these user defined sessions: the Overnight, the IB, the remaining time until cash close, the time from cash close to session end.
And i would repeat this pattern for X number of days.
thanks,
Chad J
What about a user option to select whether the Y axis scaling is compact verses matching the Y axis scale. Days/weeks/quarters/years i could see the preference being a compact scale. However, especially if you give the option of choosing from user defined intra-day sessions, then i'd want the scaling to match the actual price levels of the chart.
thanks,
Chad J
Pages