Question: After multiple output arrays are being utilized, how to select a specific one to be used as an RTL token for further use.
The array that RTL will use is the first array or fOut1
So if you have 3 arrays you typically work with in your calc and draw code, setup your indicator for 4 arrays and use the 1st array for your RTL result.
In the functoin CreateExtension, set your array count to 4...
/*****************************/
extern "C" cppExtension *CreateExtension(void)
/*****************************/
{
cppExtension *pExt= new myExtension();
pExt->setArrayCount(4);
And in your calc() function, you can declare the 4 arrays...
RTARRAY output1(fOut1), output2(fOut2), output3(fOut3), output4(fOut4);
and whatever values you put in array output1 will be the RTL results.
And in functions such as parmsLoad, you can get the context with...
RTX_CONTEXT ctx = getContext();
and then check for RTL context with...
if(ctx == RTX_CONTEXT_RTL)
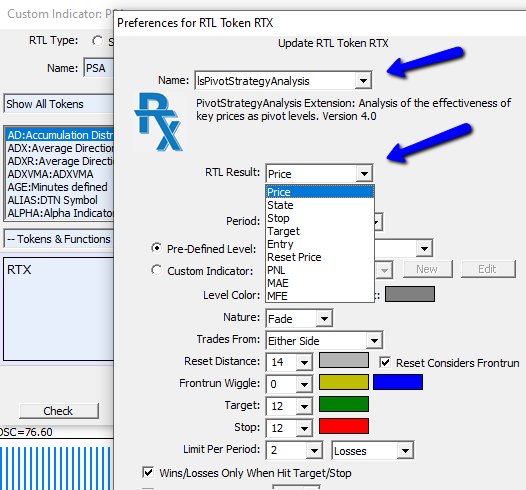
and do things like show or hide controls based on this, or position controls based on this. If you see the latest version of PivotStrategyAnalysis, I do exactly this. And only show the RTL Result listbox in the RTL context as seen below...

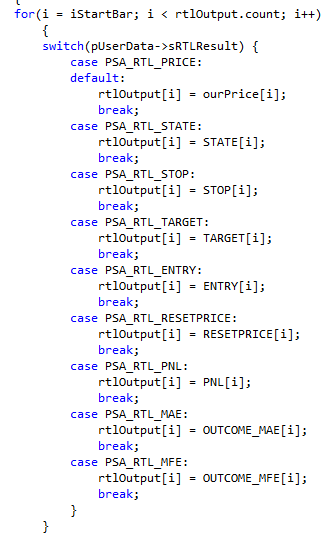
In the PSA indicator, I actually have 14 arrays for the various data involved in maintaining the state of the PSA system. Based on the selection the RTL Result listbox, I fill in the RTL array of fOut1 with the corresponding data (just moving the respective array over to array fOut1). My rtlOutput array is the fOut1 array.


In the setup() function, if I call the setOutputParameter() function, I am able to initialize the drawing of my output arrays with a specific drawtype, pen color, etc. When I add this RTX extension to my chart, the output arrays are drawn as expected.
Now lets say I want to be able to change the drawtype or pen color used for the output array after I have added the RTX extension to my chart...when I open up the parameters window, just a fraction of the output array selection is visible.
What would I have to do in the parmsLoad() function to be able to properly place the parameter controls for those output arrays? It seems that using the setParameterPosition() function only works on parameters that are declared in the enumeration, userdata structure, and kparmtokens part...I am not sure how I would do this for output arrays.
You have written your RTX setup() function with a period parameter followed by two output parameters. By design, all output parameters, whether those outputs are arrays for drawing or output signals (arrays of 0's and 1's for markings bars where something is true) must be declared first, followed by other parameters in your design. Put the period parameter after the two output arrays and it should then present the user interface correctly.
Robert,
I guess I've developed 40 or 50 RTX Indicators....from PVP to TINT to VolumeCandles to PaintIndicator. And believe it or not, I've never used the UI and all of my RTX Indicator set the NO_UI flag in the create function. The indicators I've developed have just never fit that model. Drawing a connected line doesn't help much when drawing the PVP. I create all controls and their corresponding variables manually and use them to calculate my arrays and perform customized drawing. The indicators I've developed have just required more control and flexibility than the built-in UI provides. But that may not be the case for you. I'm sure you've already explored the RTX series of videos but specifically video number 5 covers parameter management.
https://www.linnsoft.com/video/series/rtx-development