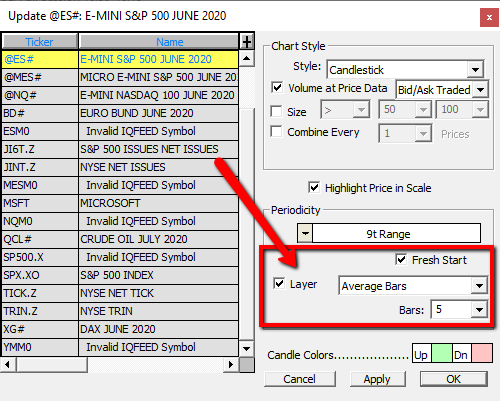
A user would like to plot the VPOC of the last 5 bars. In our example we'll use 9t Range Bars but this will work with any periodicity.
The Layered option in the Periodicity control has an Average Bars option. When this is turned on, and the period set to 5 for instance, each bar will actually be a merge/combination of that bar and the previous 4 (5 bars total). The close won't change, but the open will be the open from 4 bars back. The high will be the highest high of the 5 bars. The low will be the lowest low of the 5 bars. So every bar is an accumulation of itself plus the 4 bars before it. The volume-at-price (VolumeScope) data will also be combined.

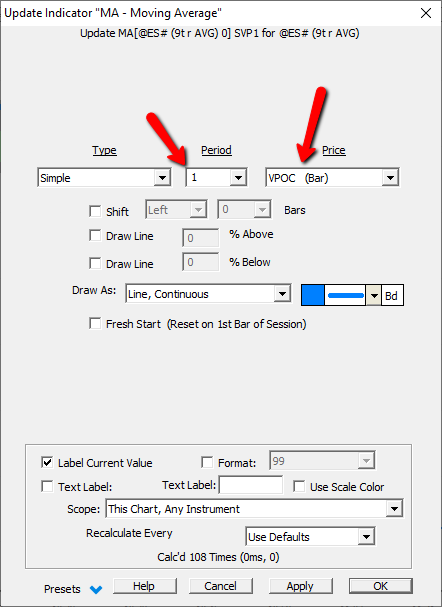
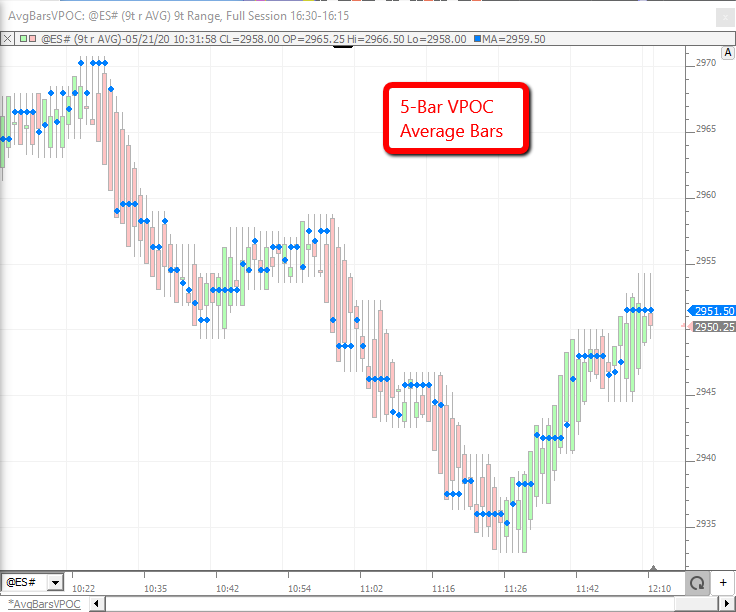
So now, if you add an indicator like the Moving Average setup to plot the VPOC of each bar as seen below, it will actually be providing the VPOC of the 5-bar data. So you get essentially a moving VPOC that always reflects the data of the current bar and previous 5.

Here is the chart definition of the chart below: https://www.linnsoft.com/charts/avgbarsvpoc-es

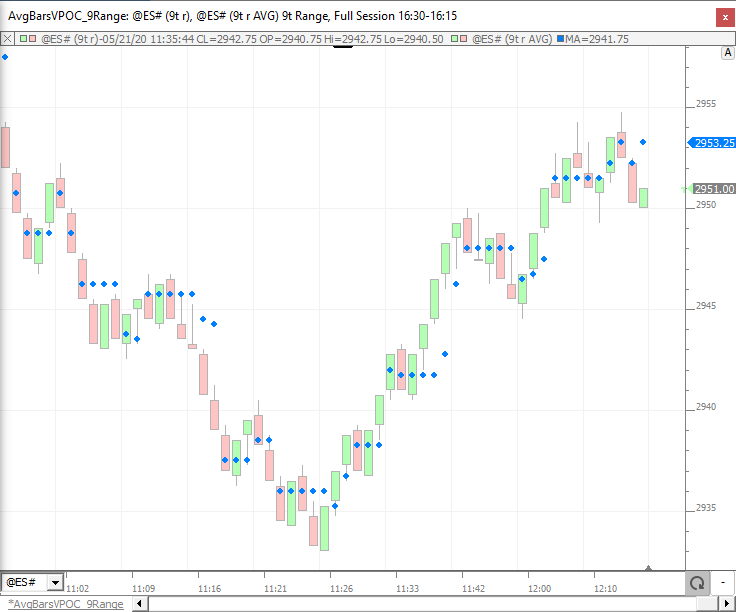
It is also possible to plot these 5-Bar VPOC while plotting the original 9t Range periodicity by adding the Average Bars invisible and then associating the Moving Average (VPOC (Bar)) to that invisible instrument.
Chart Definition: https://www.linnsoft.com/charts/avgbarsvpoc-9range-es


This is extremely useful! I was actually looking yesterday at figuring out how to do something that would achieve the same results, so thanks for this post and making it possible.
Yes. A very powerful feature that you can do so much with. Below is a 5 period Average Bars on 1000 volume bars with the VolumeScope overlaid. So on each bar, it's showing the accumulated data of 5 bars (5000 volume), giving you a moving window of volume-at-price data along with the VPOC which reflects the price with the highest volume over that moving 5000 volume period.
Hm, I hadn't thought about using it with my volume scope. I hadn't thought to put only the dots so it is minimalist and out of the way until I saw your images in this thread. Thanks for sharing the idea.