This post will explain how to chart the maximum number of yearly bars on @NQ#, downloading data from IQFEED or DTNMA. The same process would be used to chart monthly, quarterly, or even weekly or daily charts.
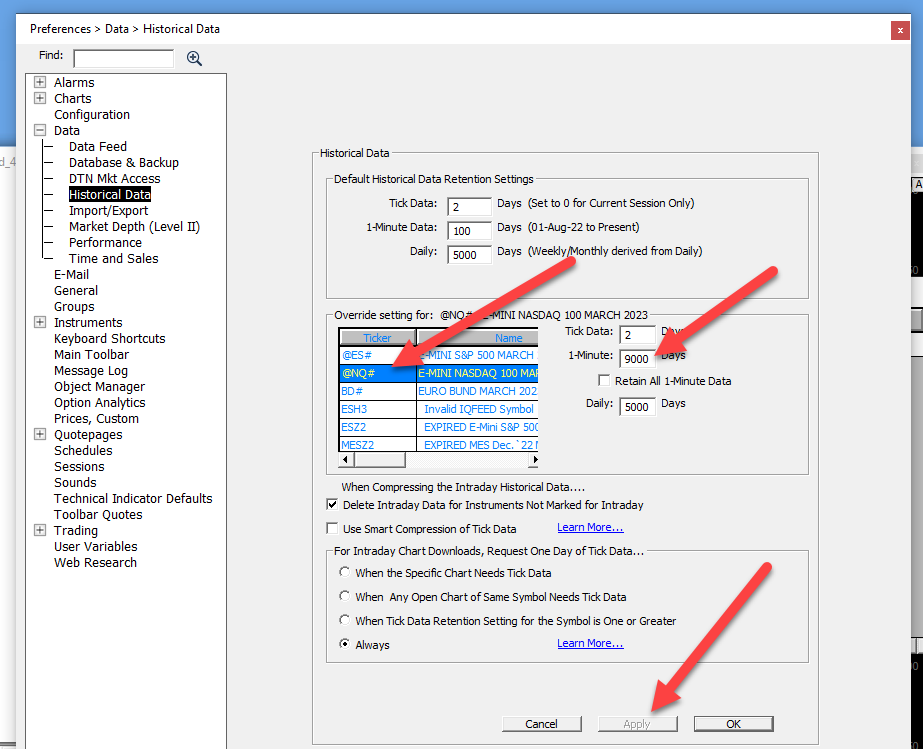
First, you must go to File > Preferences > Data > Historical Data and select the @NQ# symbol and set it up to retain a large number of 1-min bars. The yearly bars are built from 1-min bars. I'm going to set the retention to 9000 days of 1-min bars...
Now open the Download Data window and download 9000 days of 1-min data on @NQ#...
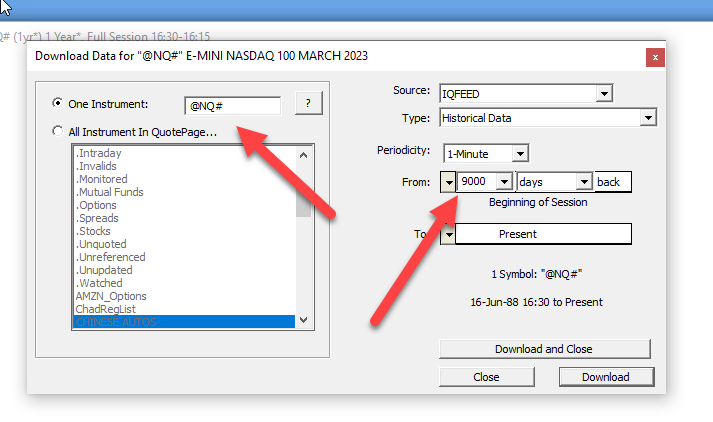
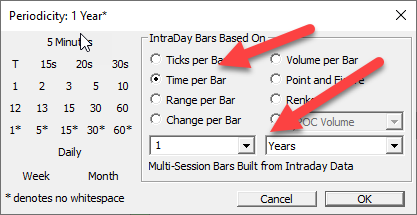
That request might take a minute to complete, but once it does, you can setup your chart to a periodicity of Time Per Bars > 1 Year... (or 1 Month, 1 Quarter, 1 Week, or 1 Day).
And set the view period to something like "Last 9 Years".
I requested such a download on 12/17/2022 and it gave me data back to 4/13/06. That is 4326 trading days of data. You can test this by temporarily setting your periodicity to Time Per Bars > 1 Day and check the date of the 1st bar in the chart. So in my case, I had complete yearly bars back to the start of 2007 and coudl just set viewing period to Begin to Present from Jan 1, 2007.
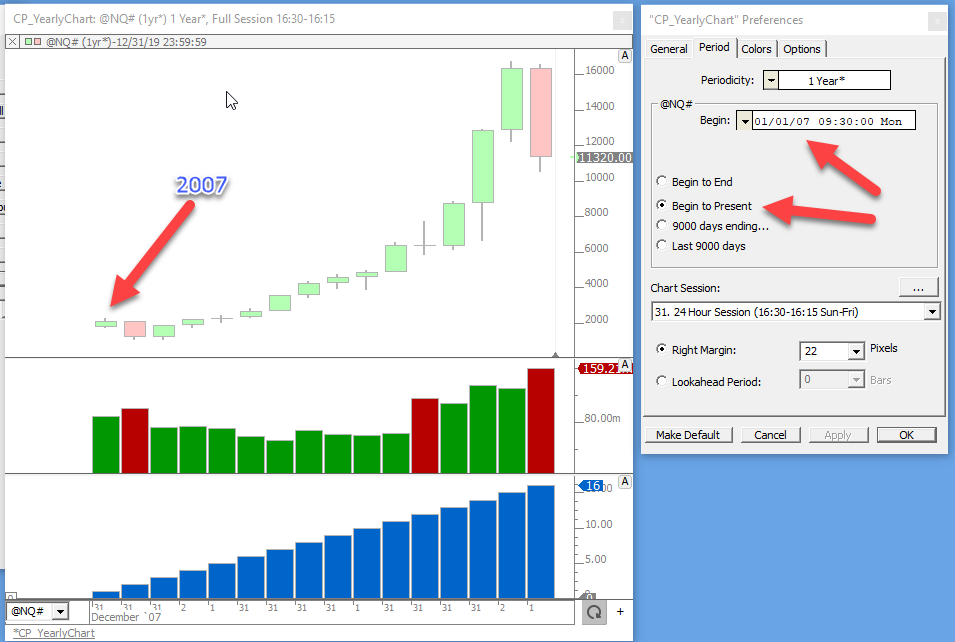
This chart has a yearly volume Profile overlaid...
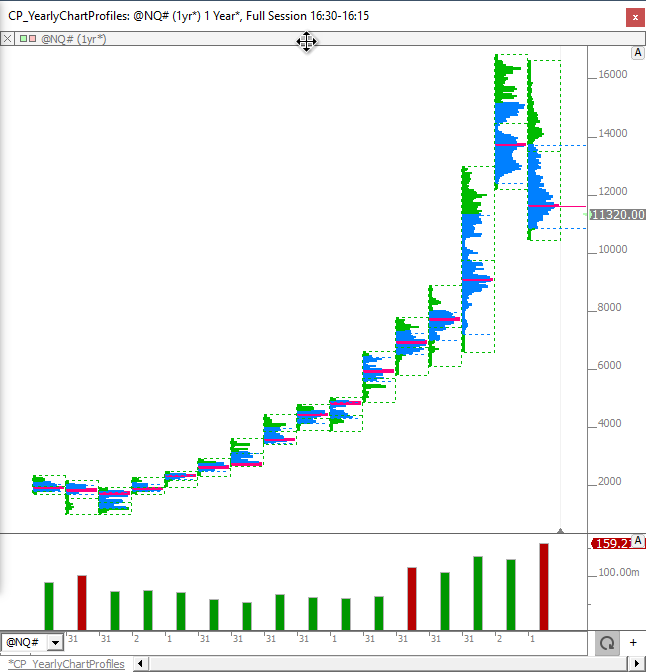


The Yearly Profiles were accomplished by adding the Profile Indicator with settings below. They key settings are the Time Per Profile of "1 Year" and the Price Per Row of 50, which results in every histogram bar combining the volume of the 50 prices it covers vertically. Also, in this chart, the underlying bars have been set to a style of "Invisible".
Another option is to switch to monthly bars (Time Per Bar: 1 Month) and then make the candles visible, while still keeping the Profile duration at 1 year...as seen in the image below (with chart definition)...
Chart Definition: https://www.linnsoft.com/charts/cp-yearlyprofmonthlybars-es
And in the chart below, we've set the periodicity to Time Per Bar: 1 Day, and the Profile period to 1 Month...(with Price Per Row of 10)...
Chart Definition: https://www.linnsoft.com/charts/cp-monthlyprofdailybars-es