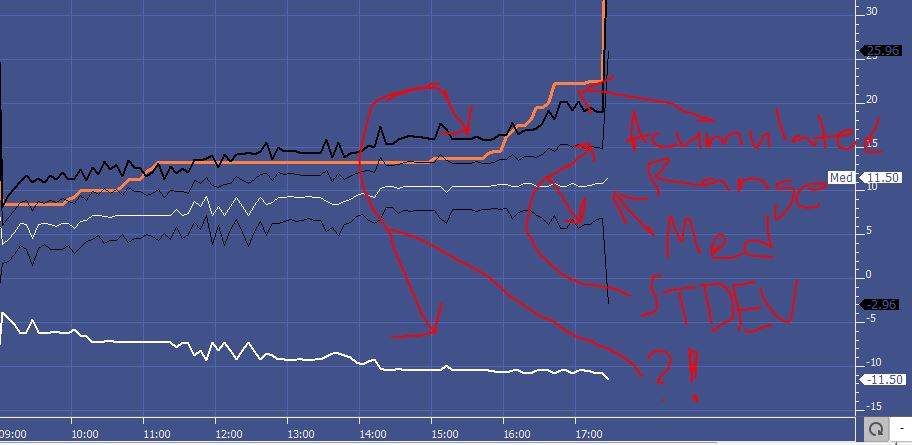
Hi I'm trying to build a custom range indicator that charts todays acumulated range at any given time vs statistical mean + 1/2stdev (68-95%).
I sucessfully charted mean & stdev but i dont understand how to chart 2stdev (95%) or custom confidence interval.
I'm not a genious when it comes to statistics.. please help :)
The chart can be found here: https://www.linnsoft.com/charts/omx15min-fusx30g8
Best regards!
// Ben


Only problem I see with your chart is the med_minus_2stddev should use "Std Dev of Bars at Time" (instead of Median). See below. Let me know if that gives you what you're after.
It might be more useful in this case to just take the median and add/subtract 25% from it, then 50%. If you subtract 2 standard deviations from the median you can often come up with pretty meaningless negative numbers. But to know that it's trading at half the median, is of value.
Import this chart: https://www.linnsoft.com/charts/relativerange-es
In the 2nd pane, the black is current range and gray is 20 day median at time. In lower pane, the relative strength of that range computed by displaying a percentage of current range relative to the median. Histogram is green above 100 when current range is above median, and red below 100 where current range is below median. Reference lines drawn at 50, 75, 100, 125, and 150%.
Thanks alot Chad! I now understand my calculation is not doing what i thougt it did & that i should get a math book.. What i meant to do was this: https://imgur.com/a/QeJwn
Similar to a normal distribution / volume profile. But perhaps its meaningless against 20days of data and should rather be done over a much bigger samplesize? Is it possible to do some way?
Thanks for the relative range to median idea!