Hello,
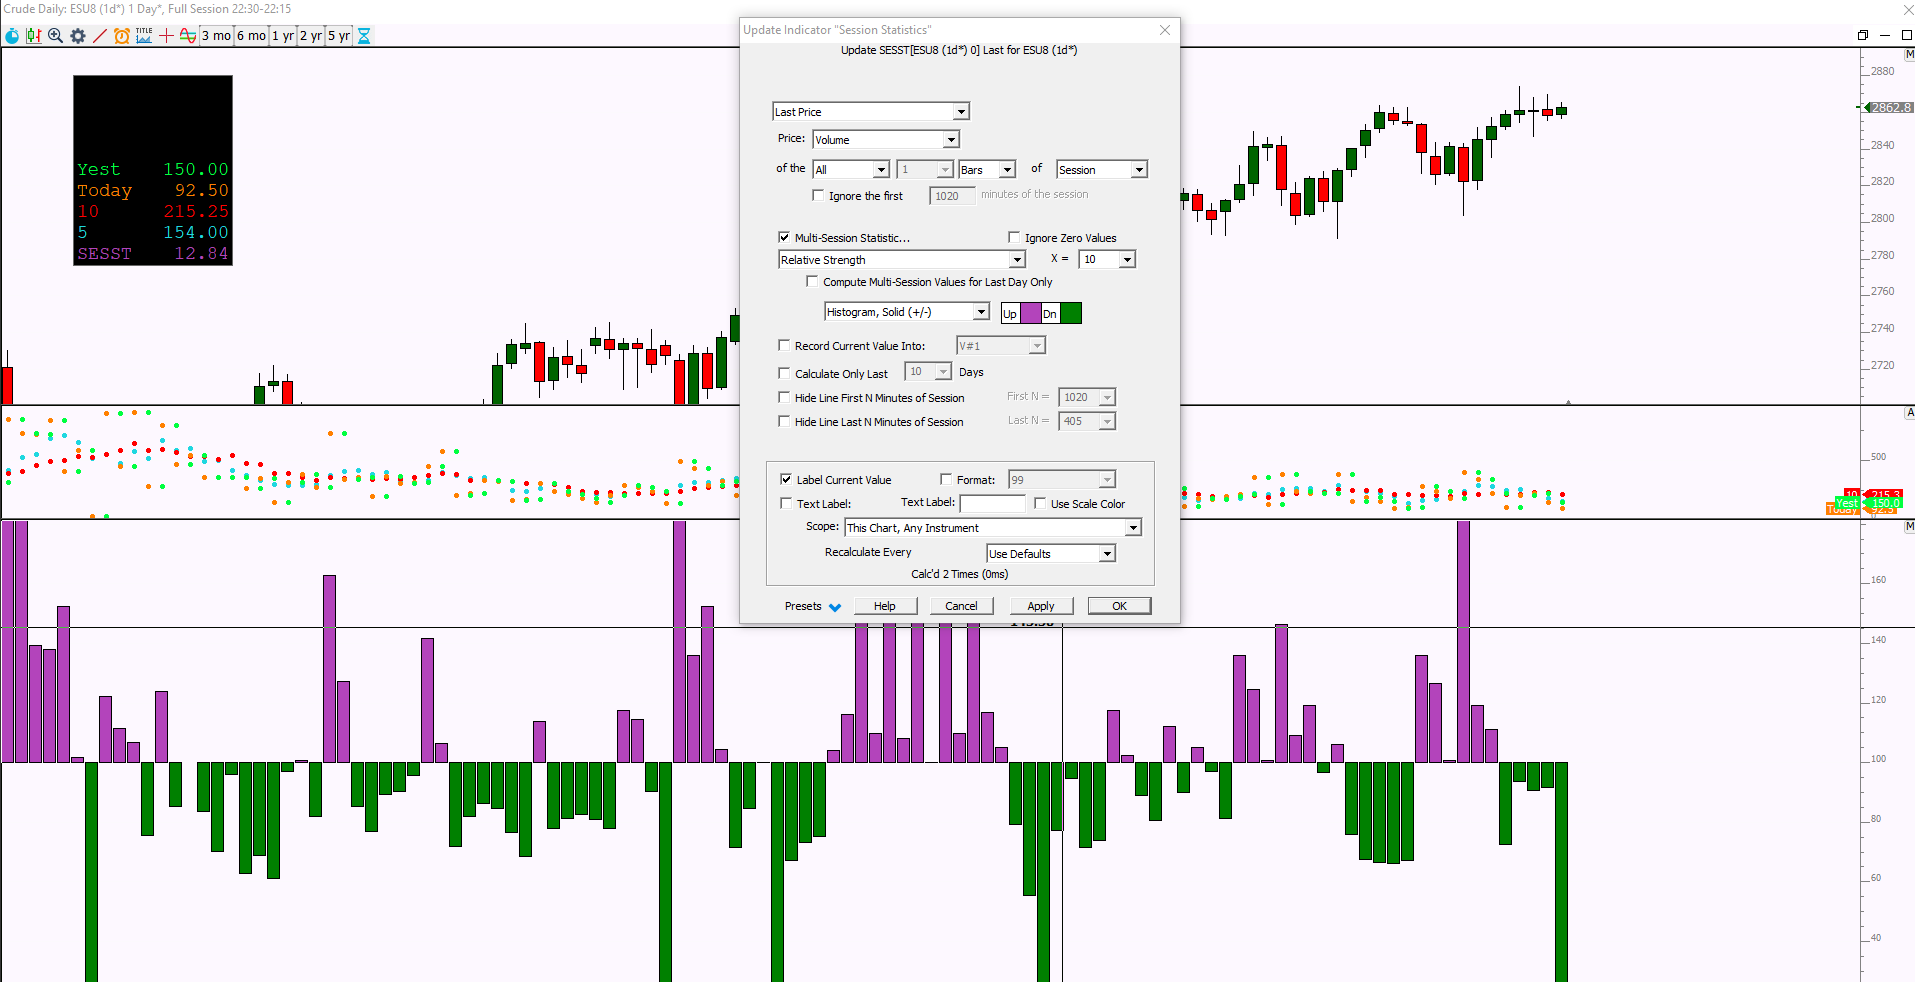
Below is a chart that I tried to recompose from the TickRangeAnalysis https://www.linnsoft.com/charts/tickrangeanalysis-es
First I was trying to see how I could add the average of the 5 day and 10 day range so it could also show up in the info box. If that's possible?
The last pane is supposed to be relative volume of the past 10 days updated each second in real time. So that would be the current volume at this time vs the average of the last 10 days at the same time.
Is it possible to view that Relative Volume in % to see when it is higher or lower than average?
Thank you


So if I understand correctly, you want to see where you are with volume currently relative to the average at same time of day over past 5 or 10 days, correct? If you have your chart setup as daily like you do in the image, you'll need to use MPD to dig down into the maybe 5-min data so you have the accurate calculation for time of day. Working with daily bars it's impossible to figure that out. If you need help, share that chart definition and I'll fine tune it with this adjustment.
Hey Chad,
Below is the chart definition of the range analysis. For the relative volume yes I was trying to do that as you said over the past 10 days.
I was trying to view it in % and have it on the range analysis infobox. That would be the ideal situation.
I currently have something like this in a custom column. I'll share the formula below as well.
https://www.linnsoft.com/charts/tickrangeanalysis-es
Formula: MA((SESST#1/SESST#2)*100-100)
Tokens: SESST#1 is SESST[ ] SumPrice; SESST#2 is SESST[ ] SumPrice; MA is MA[ ] SC3;