HG120DUPE 01 10 12 (QHG#)
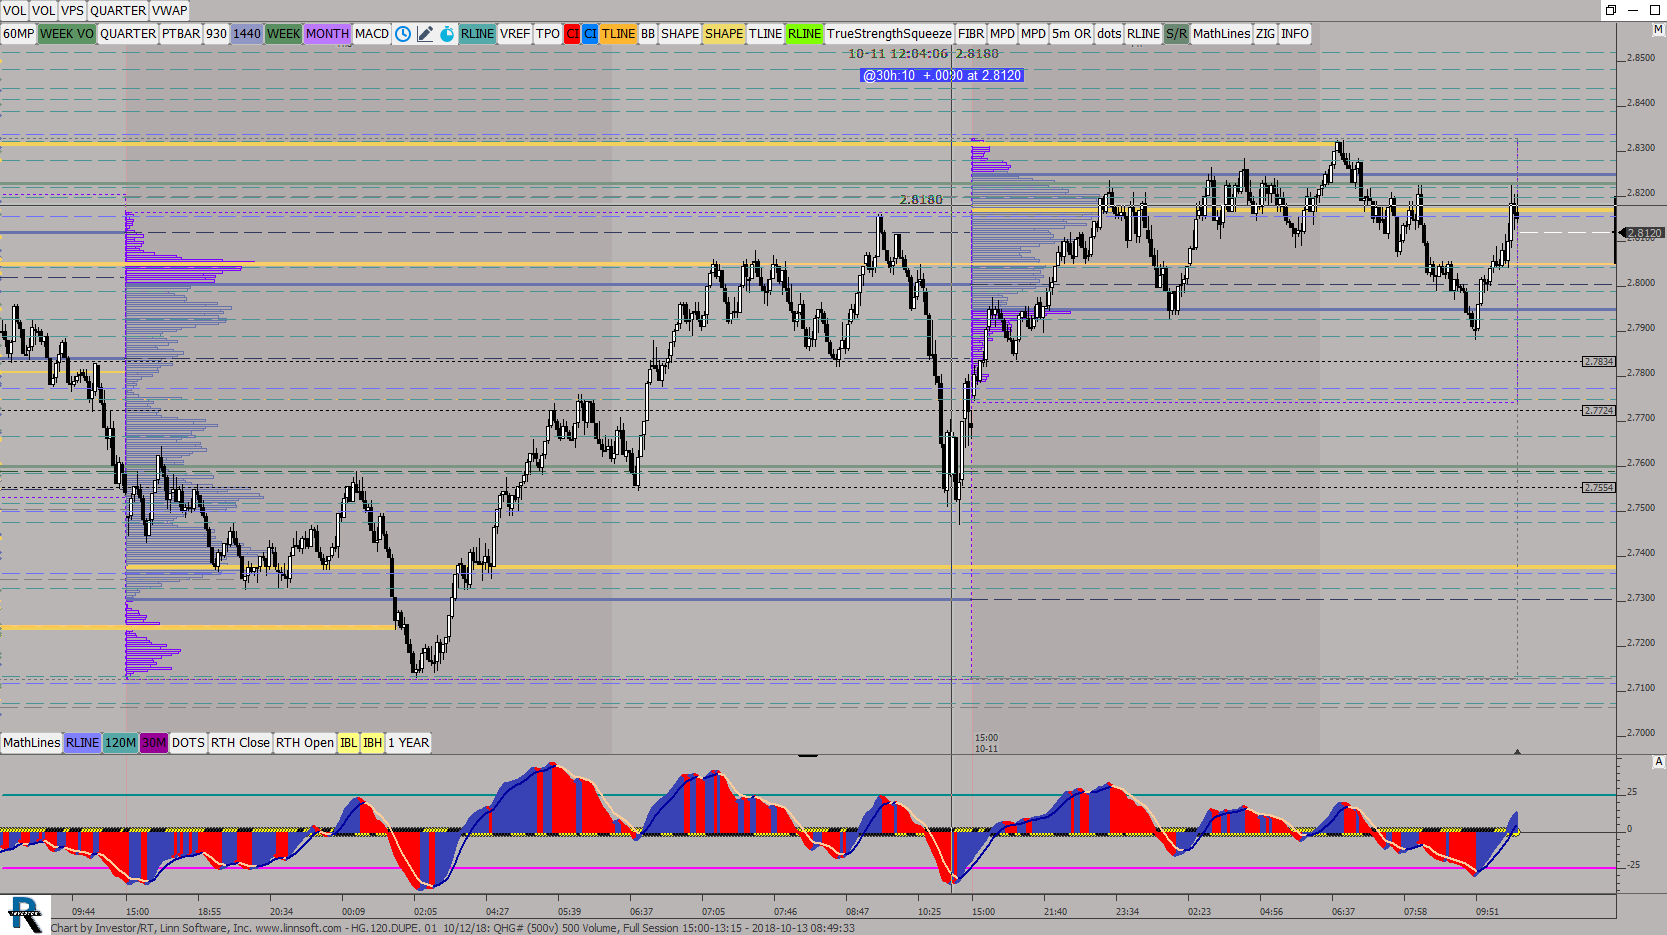
This chart was uploaded by Investor/RT 13.3.5 showing symbol: QHG#.
This chart was uploaded by Investor/RT 13.3.5 showing symbol: QHG#.
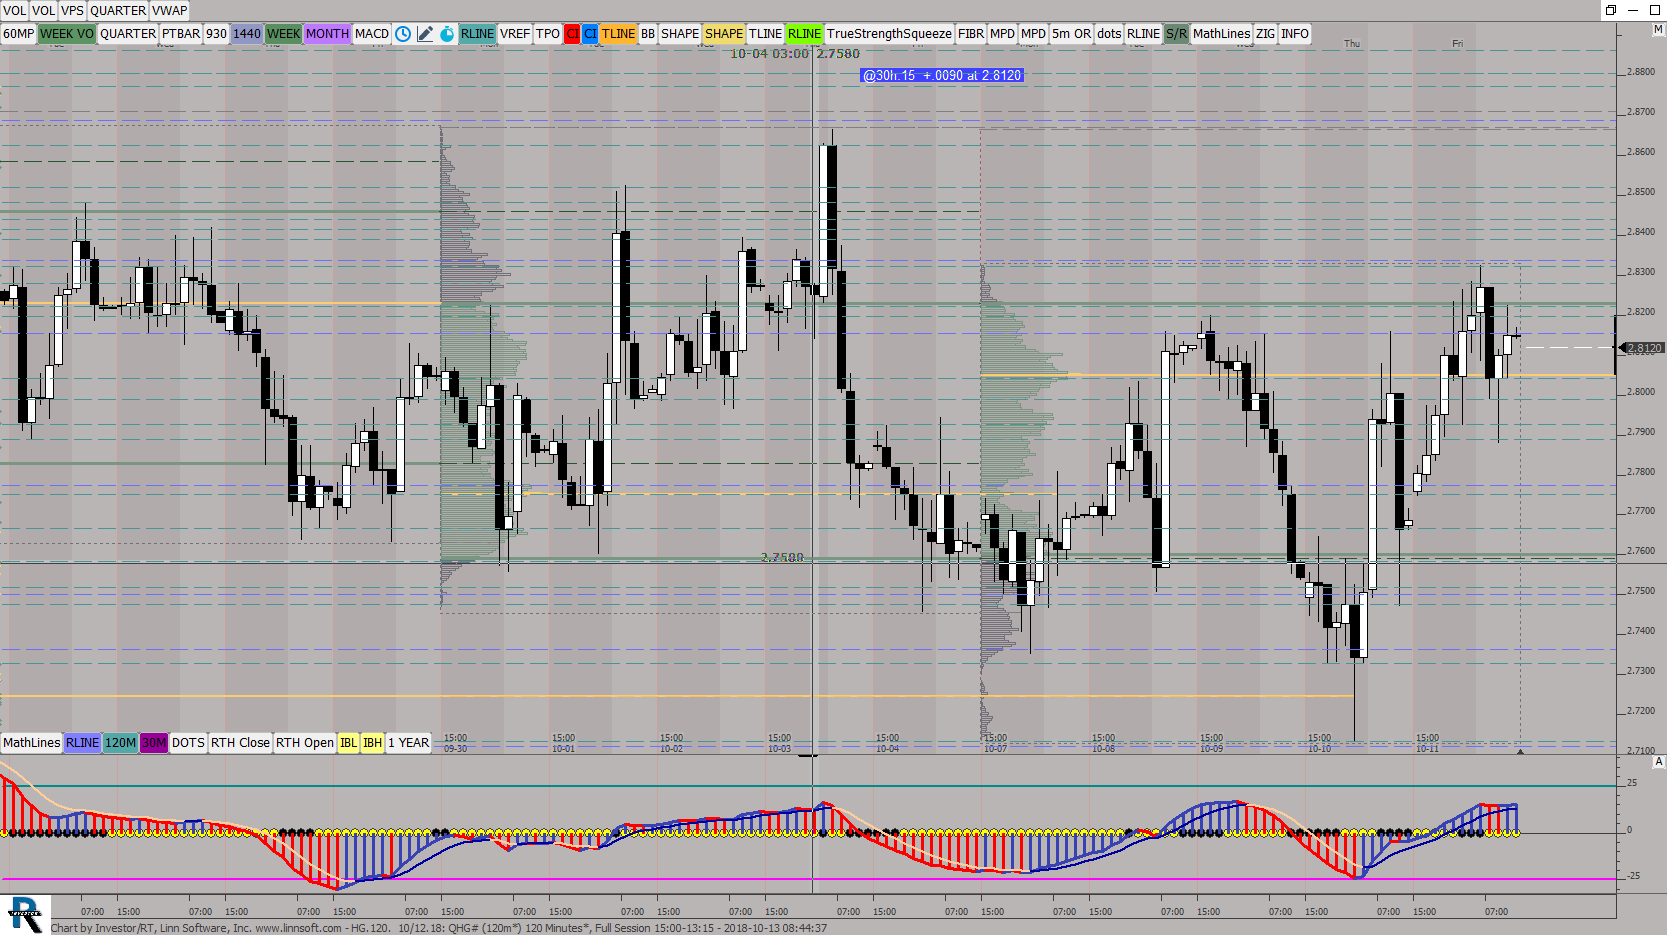
This chart was uploaded by Investor/RT 13.3.5 showing symbol: QHG#.
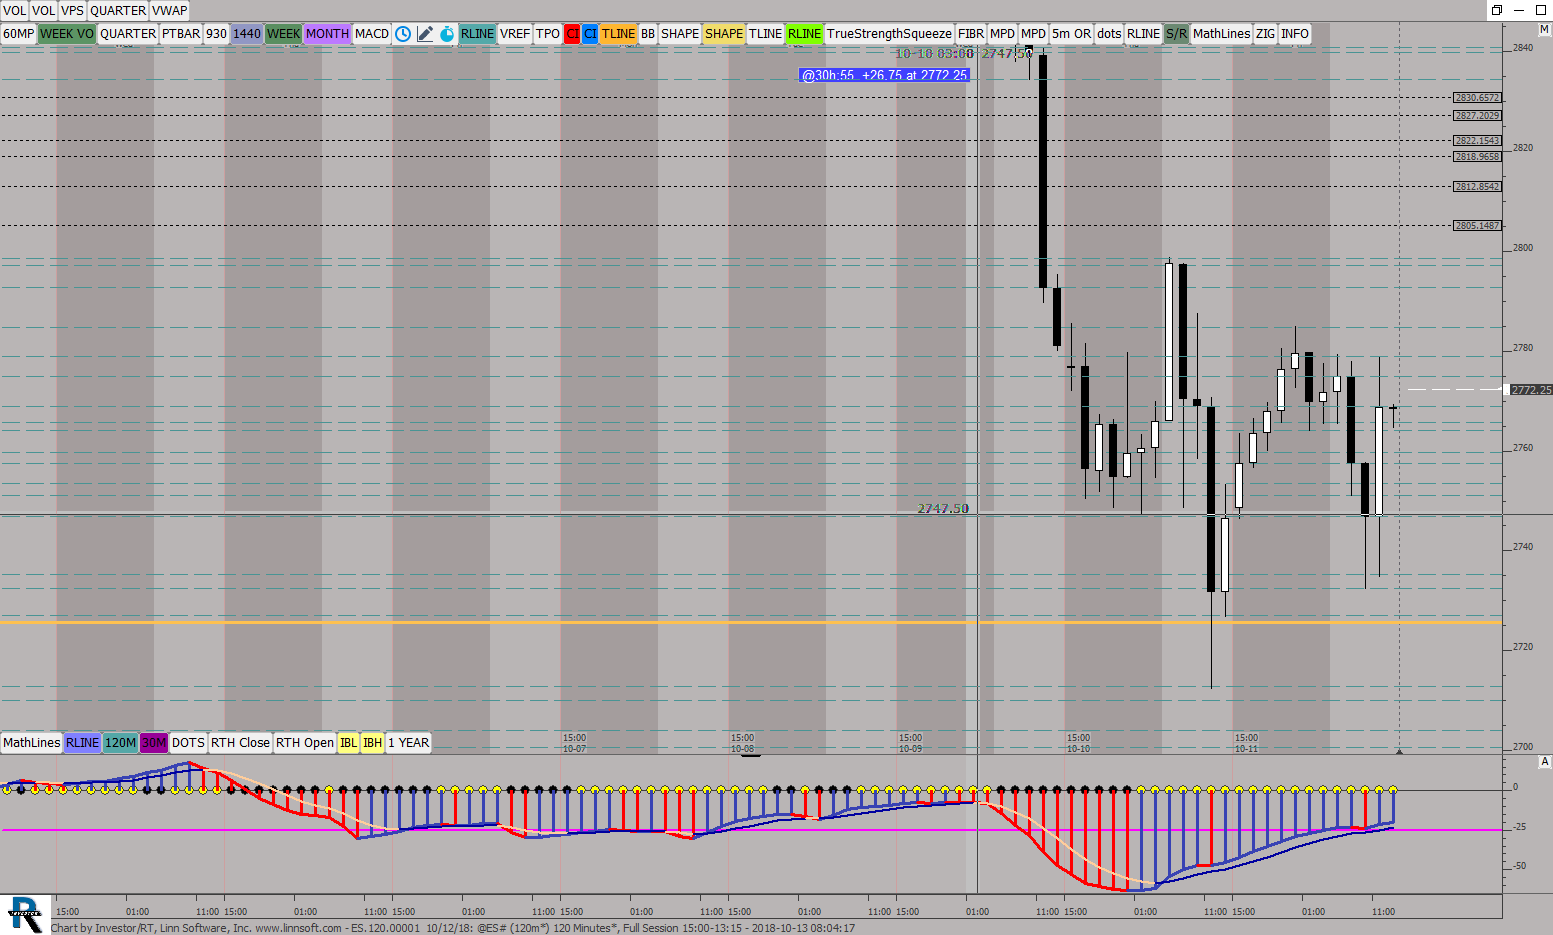
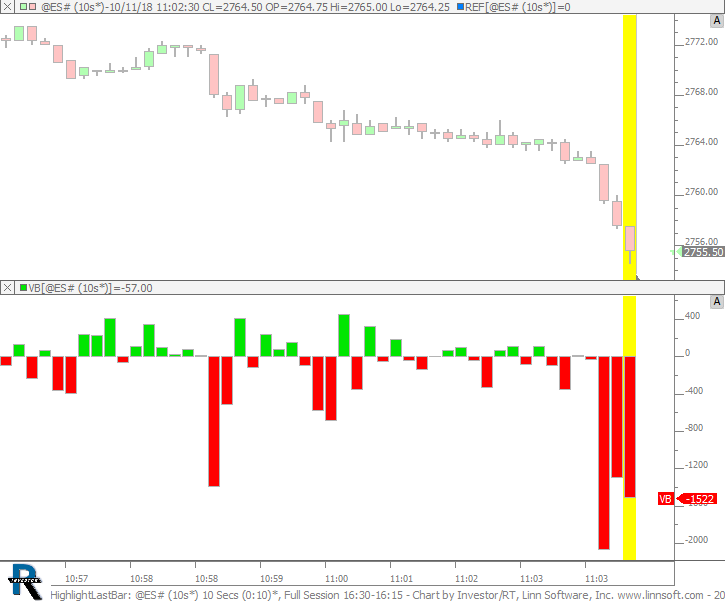
This chart was uploaded by Investor/RT 13.3.5 showing symbol: @ES#.
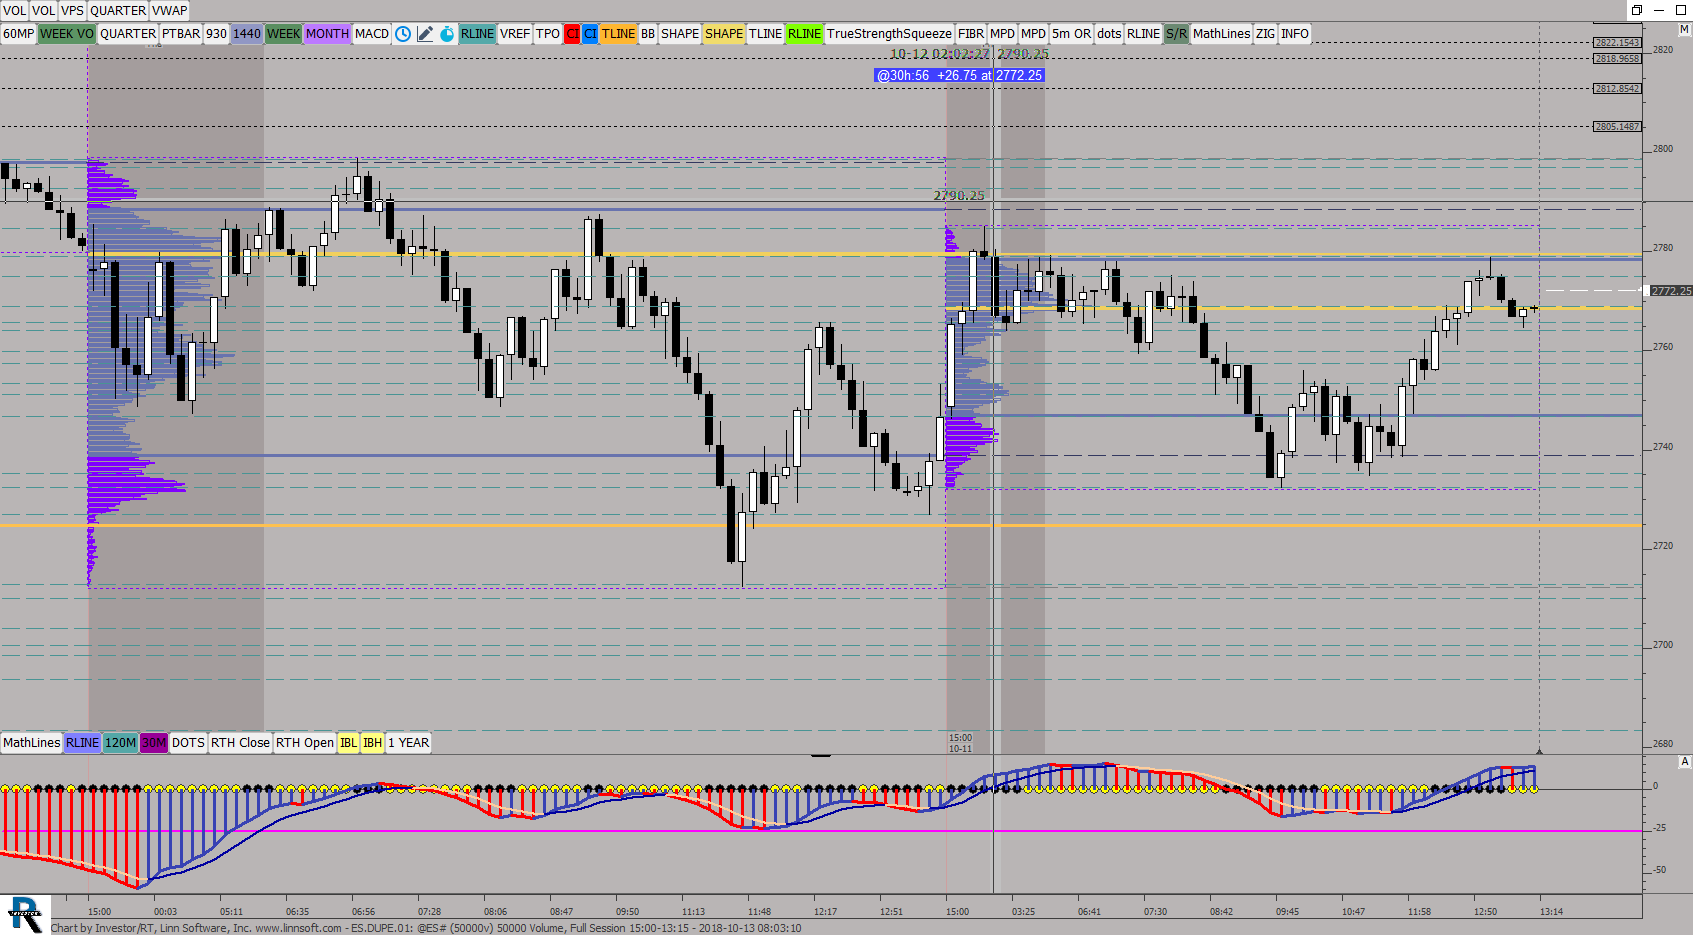
This chart was uploaded by Investor/RT 13.3.5 showing symbol: @ES#.

22.5 kv subs. This chart was uploaded by Investor/RT 13.3.5 showing symbol: @ES#.
This chart was uploaded by Investor/RT 13.5.7 showing symbol: @ES#.
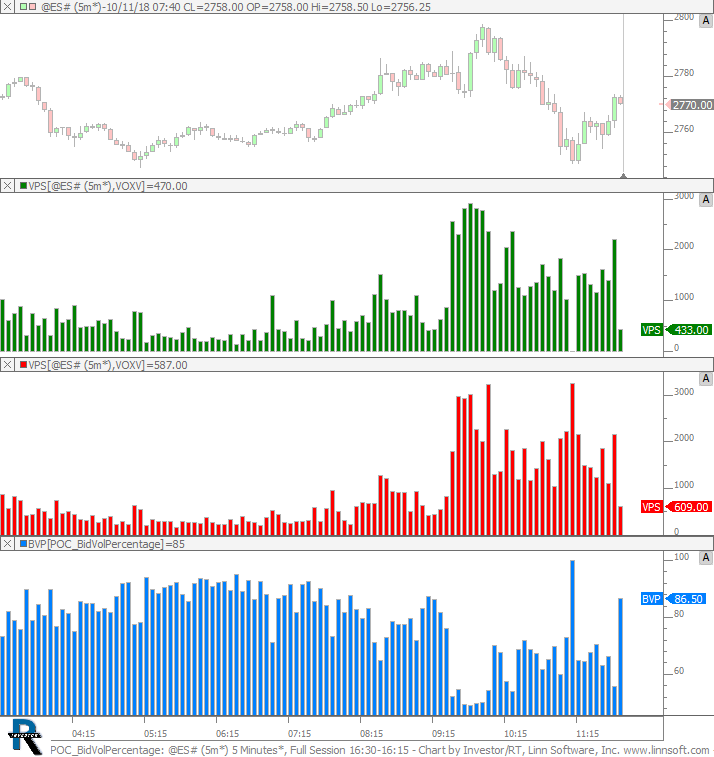
POC Bid Volume Percentage. This chart was uploaded by Investor/RT 13.5.7 showing symbol: @ES#.
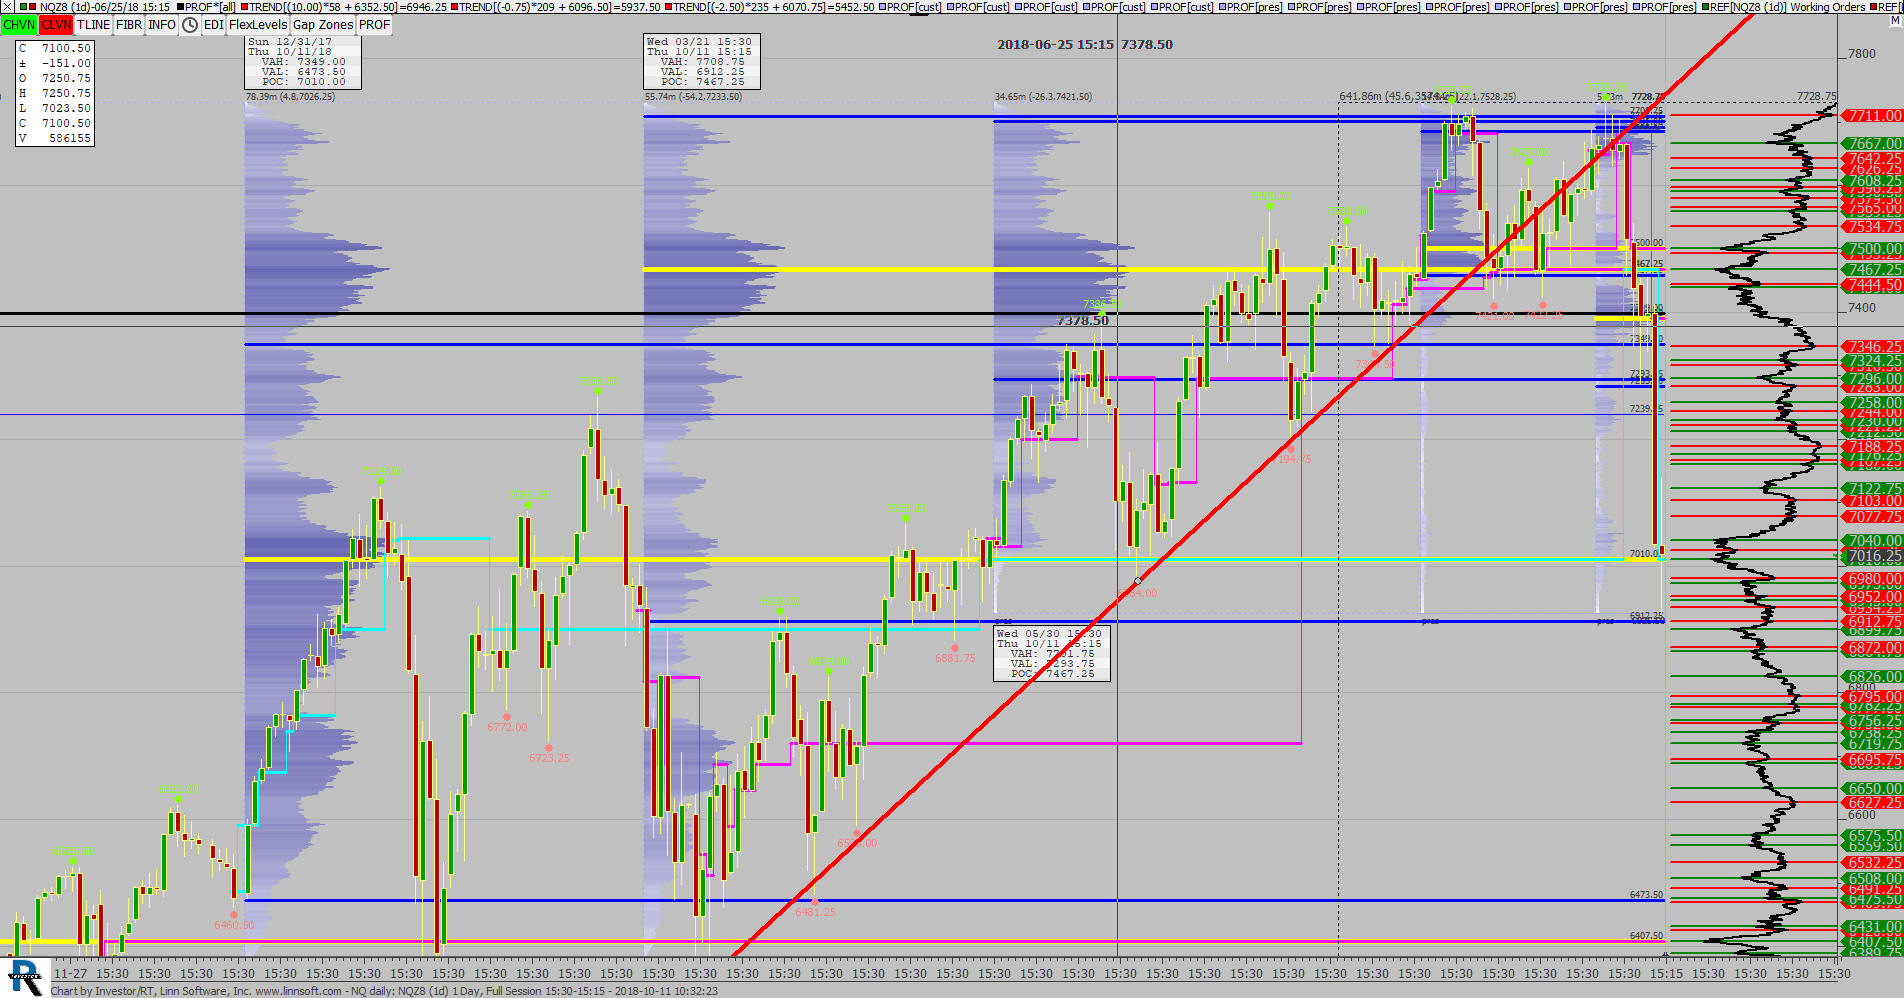
This chart was uploaded by Investor/RT 13.3.3 showing symbol: NQZ8.
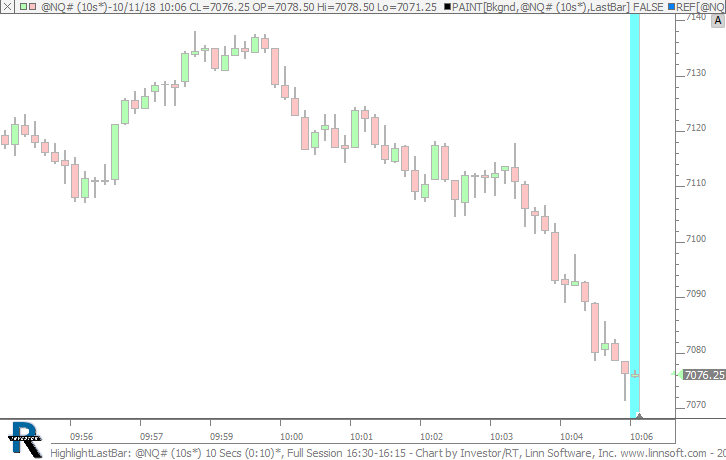
Highlight Last Bar. This chart was uploaded by Investor/RT 13.5.7 showing symbol: @NQ#.
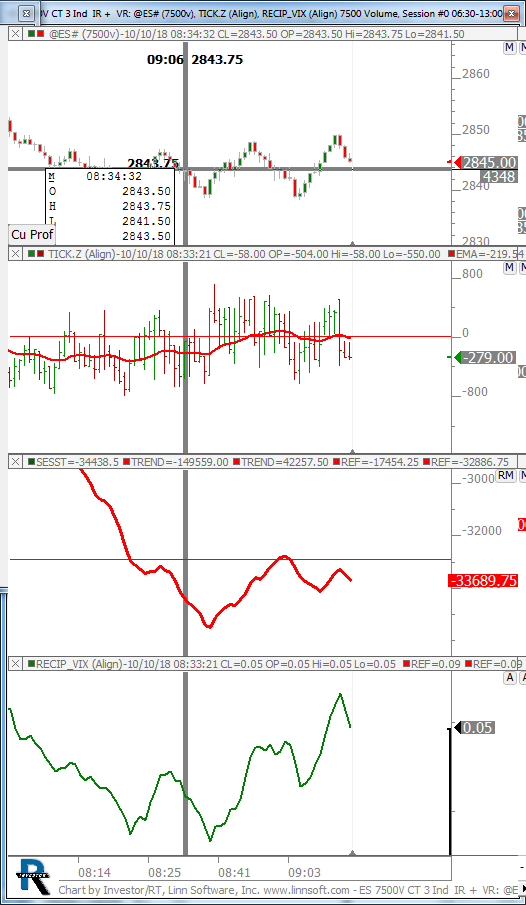
7500v. This chart was uploaded by Investor/RT 13.3.5 showing symbol: @ES#.