Duration:06:50
Variable speed version:
Watch
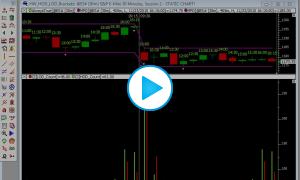
This chart plots the time of day (minutes into session) that the high and low was made each session. It then profiles those values to accumulate the number of times that high and low was made in each time period, and identify the Mode, Mean, and Median. Chart definition is included below.
Chart Definition: https://www.linnsoft.com/charts/newhighlowminutesin-es
Chart Reference
NewHighLowMinutesIn (@ES#)


