NQ DeltaMap (@NQ#)
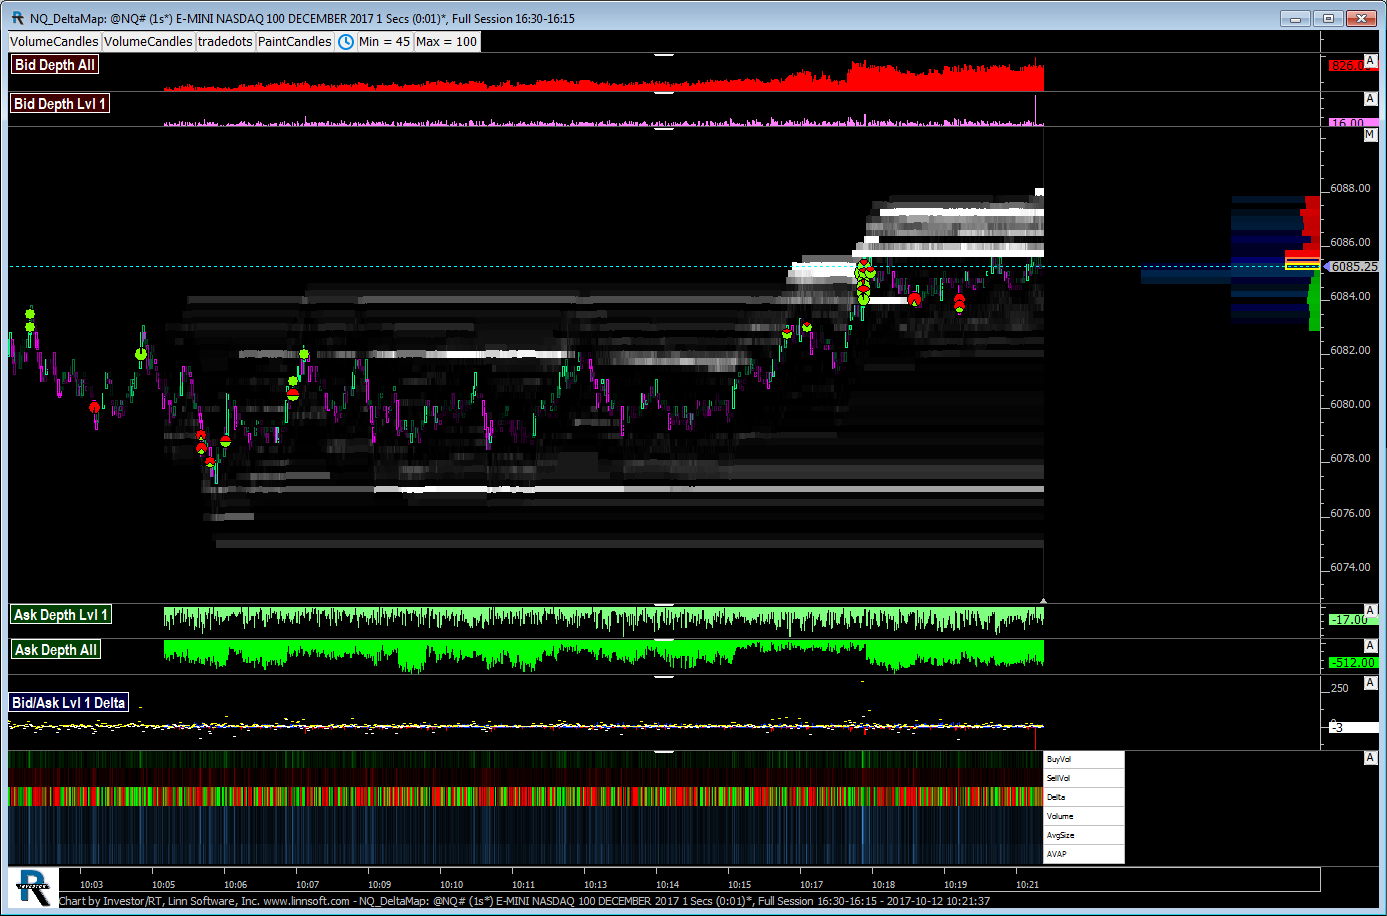
This chart was uploaded by Investor/RT 12.7.6 showing symbol: @NQ#.
This chart was uploaded by Investor/RT 12.7.6 showing symbol: @NQ#.
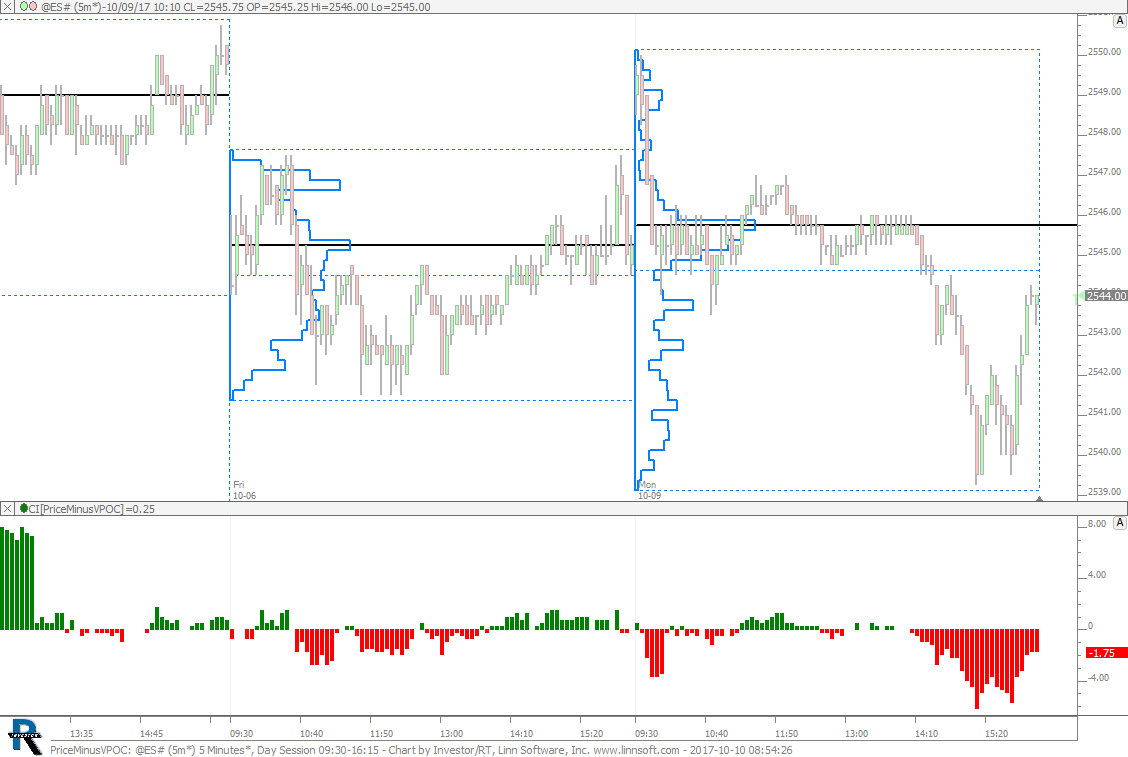
Price Minus Developing VPOC. This chart was uploaded by Investor/RT 13.1.1 showing symbol: @ES#.
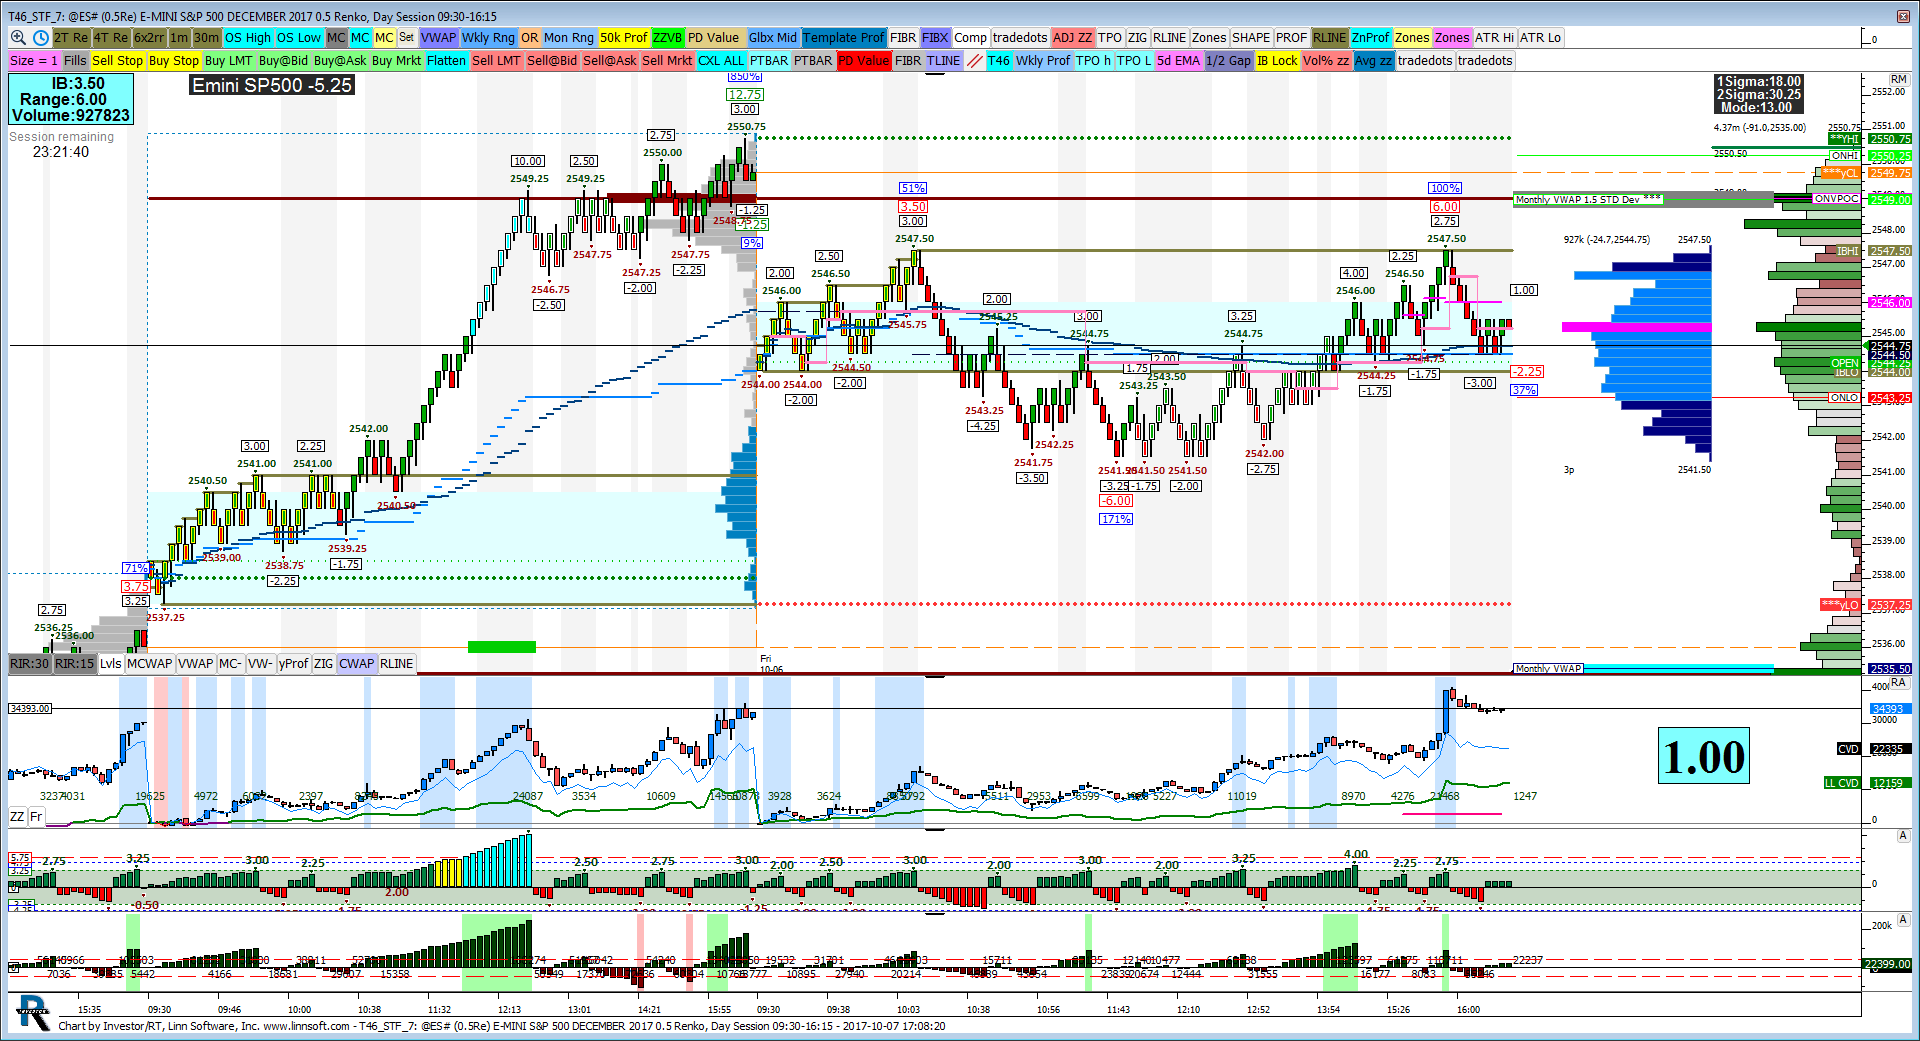
This chart was uploaded by Investor/RT 12.5.9 showing symbol: @ES#.
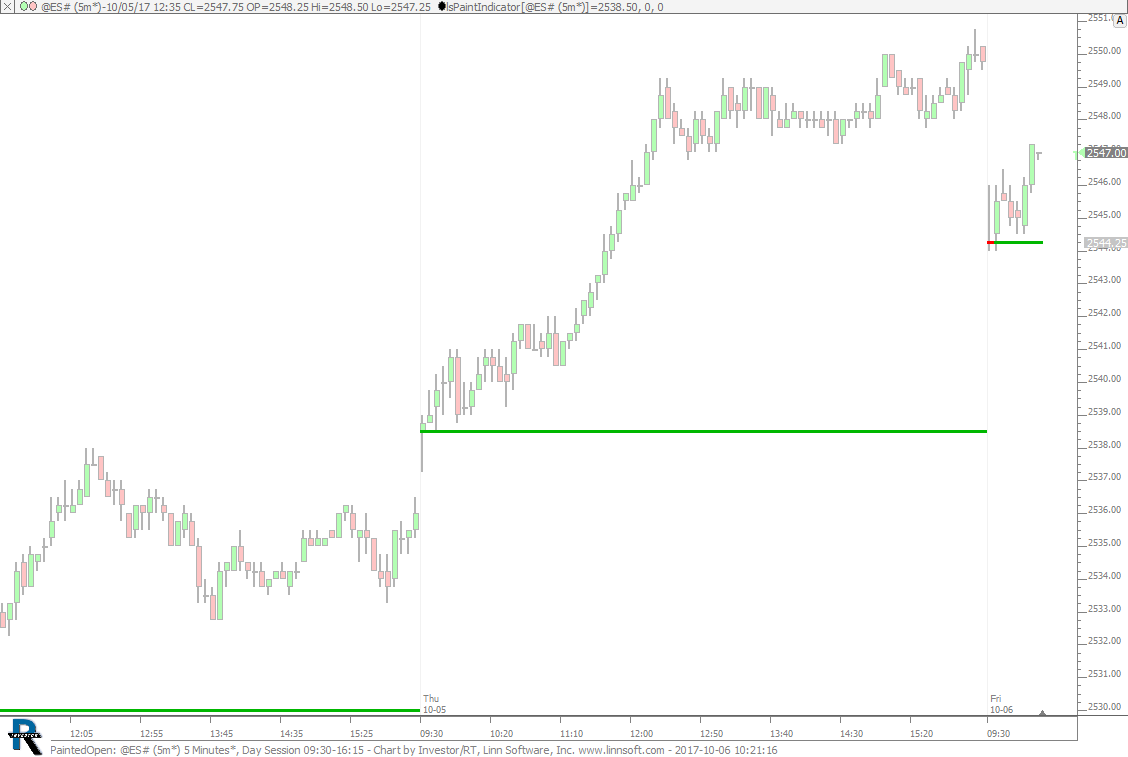
Painted Open Line using Paint Indicator. This chart was uploaded by Investor/RT 13.1.1 showing symbol: @ES#.
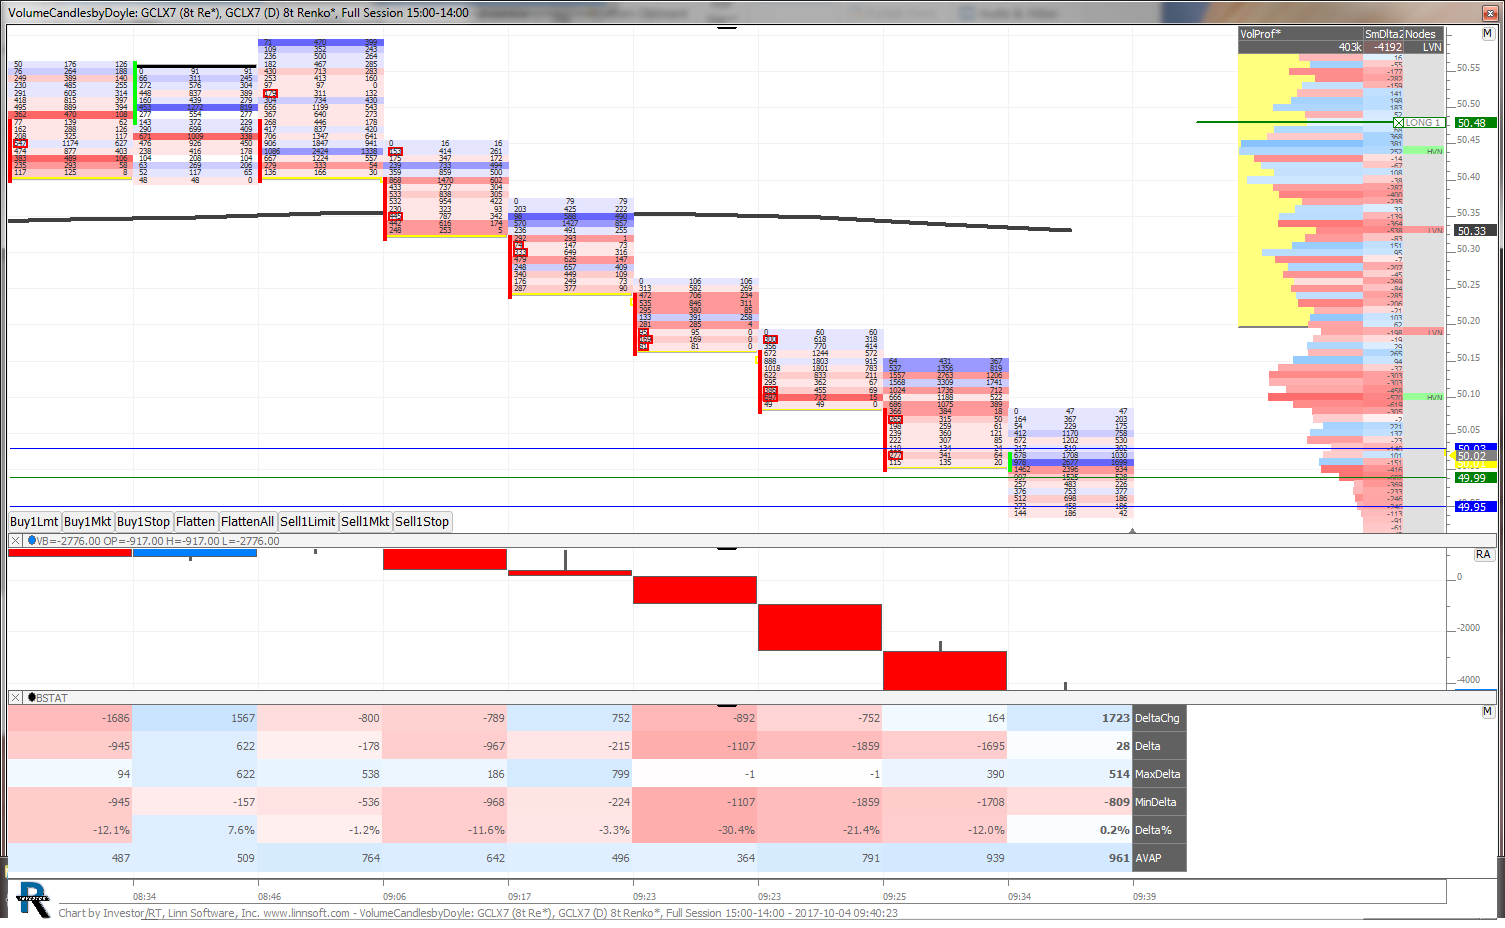
This chart was uploaded by Investor/RT 12.7.6 showing symbol: GCLX7.
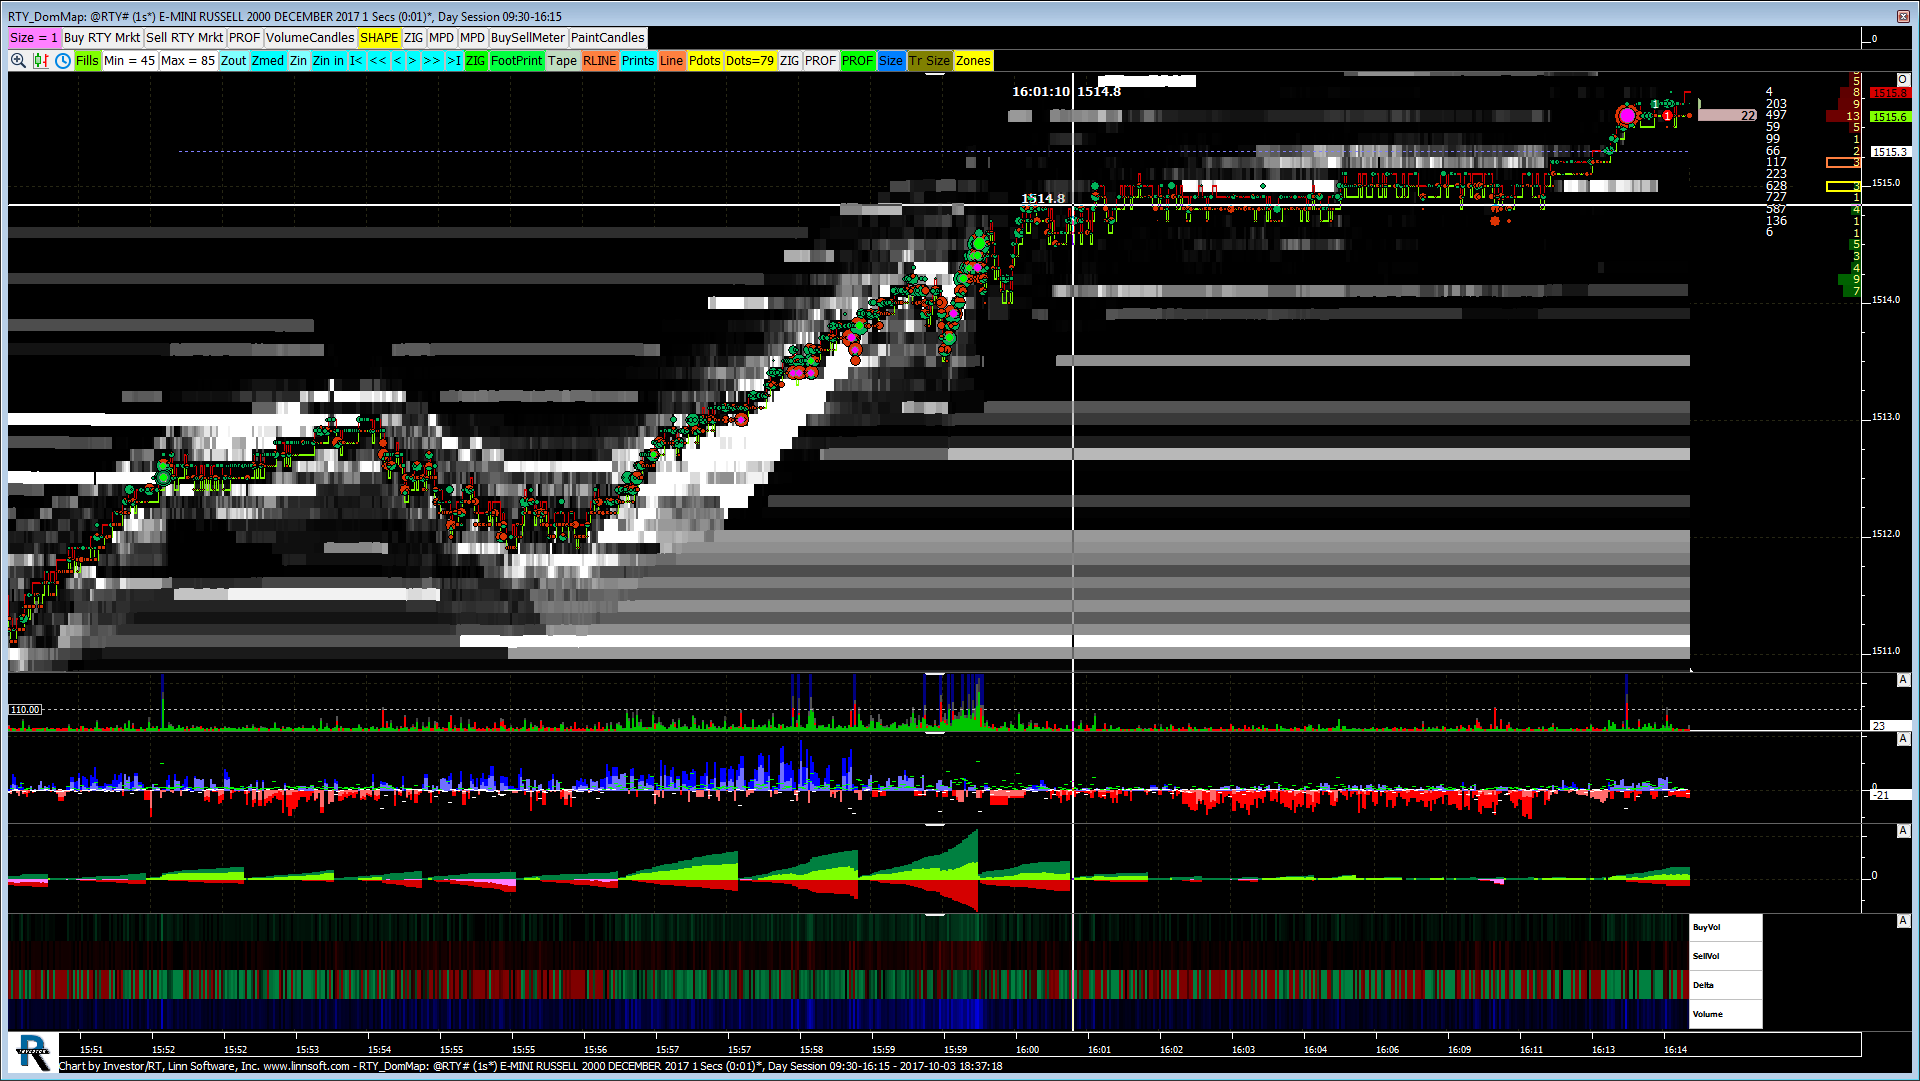
This chart was uploaded by Investor/RT 12.7.6 showing symbol: @RTY#.
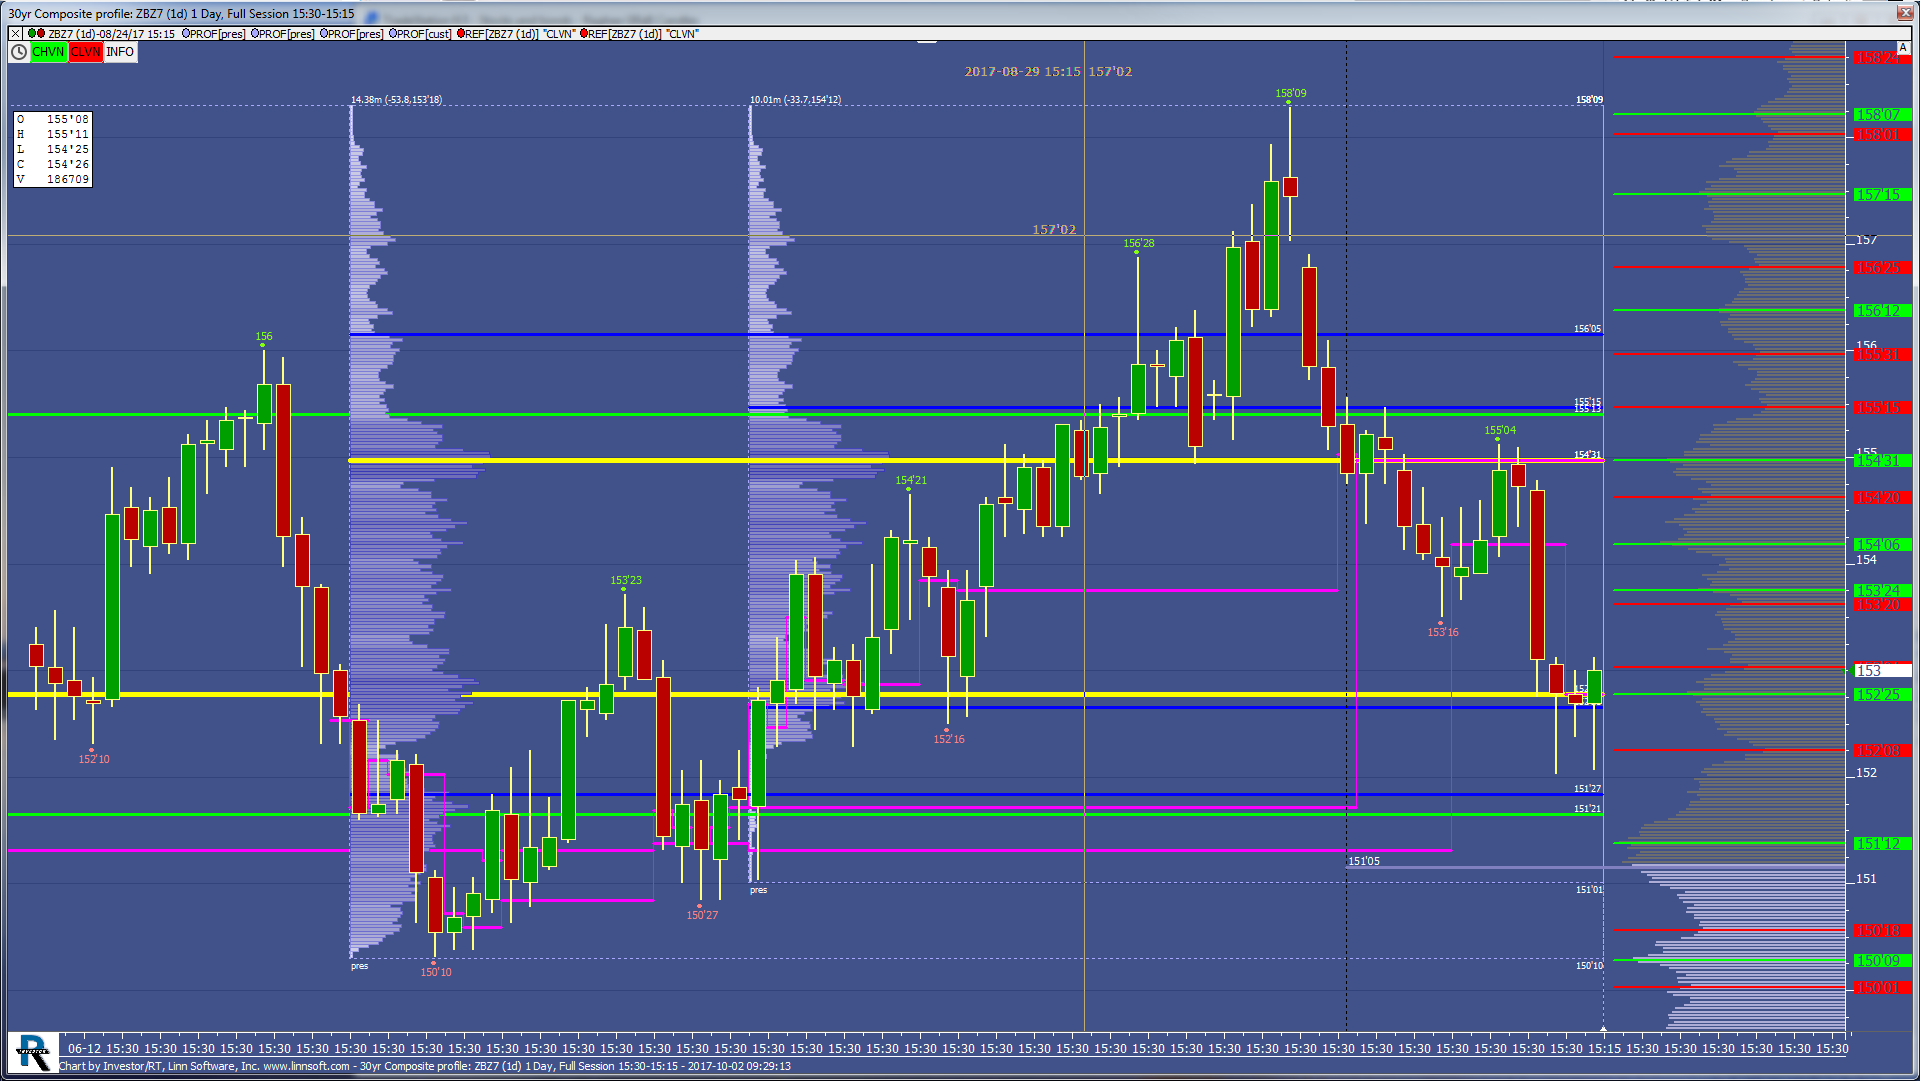
This chart was uploaded by Investor/RT 12.7.1 showing symbol: ZBZ7.
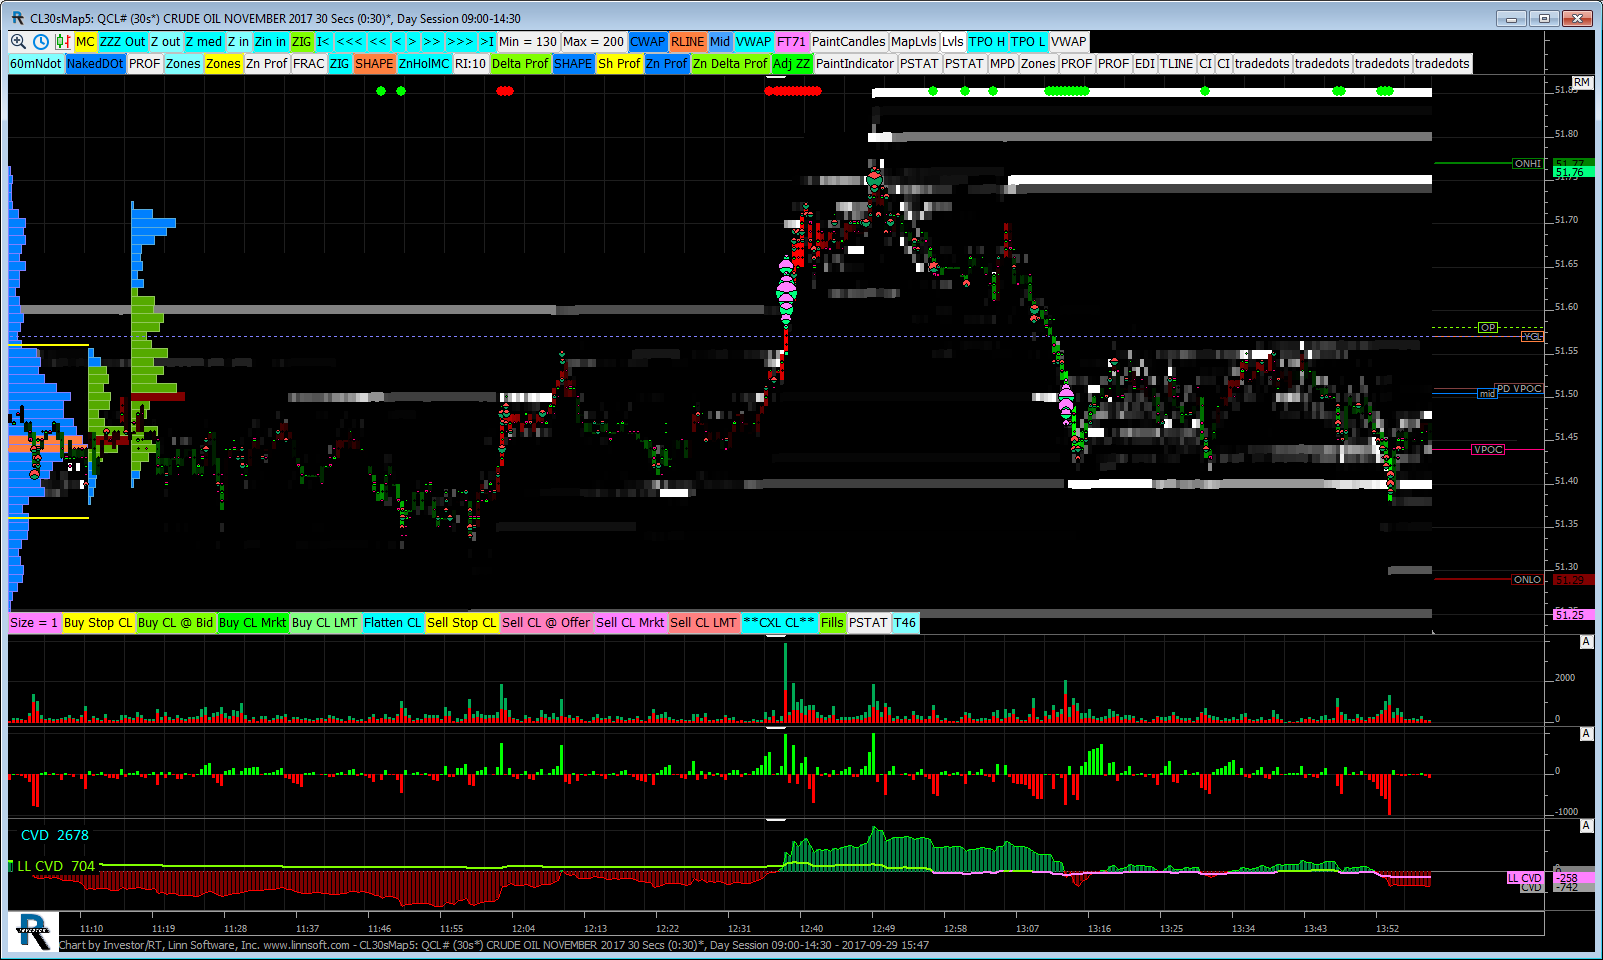
This chart was uploaded by Investor/RT 12.7.6 showing symbol: QCL#.
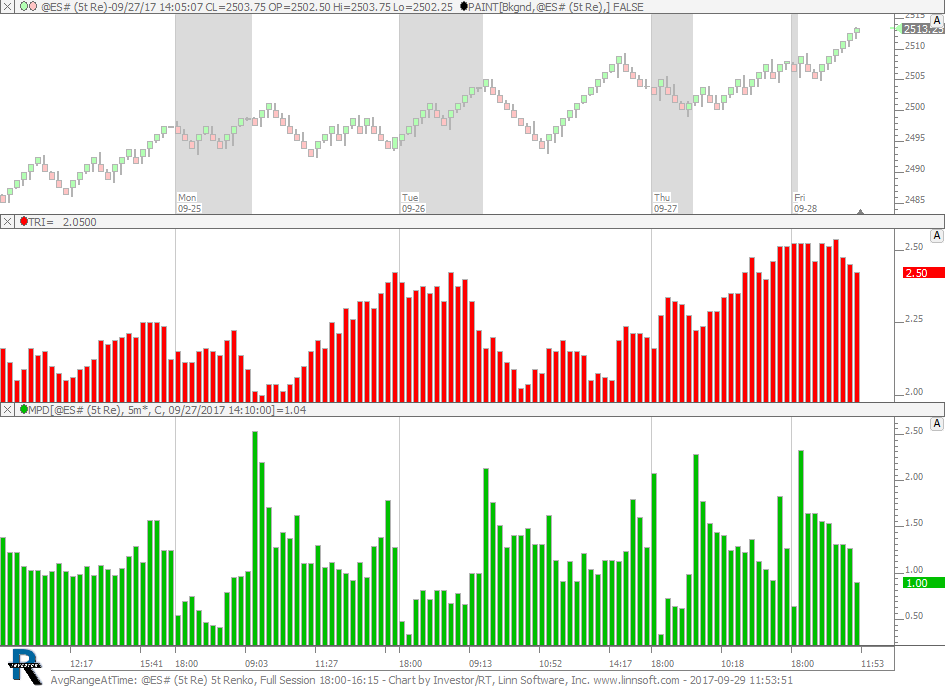
Average Range at Time of Day. This chart is explained in the video Better Volatility. This chart was uploaded by Investor/RT 13.1.1 showing symbol: @ES#.
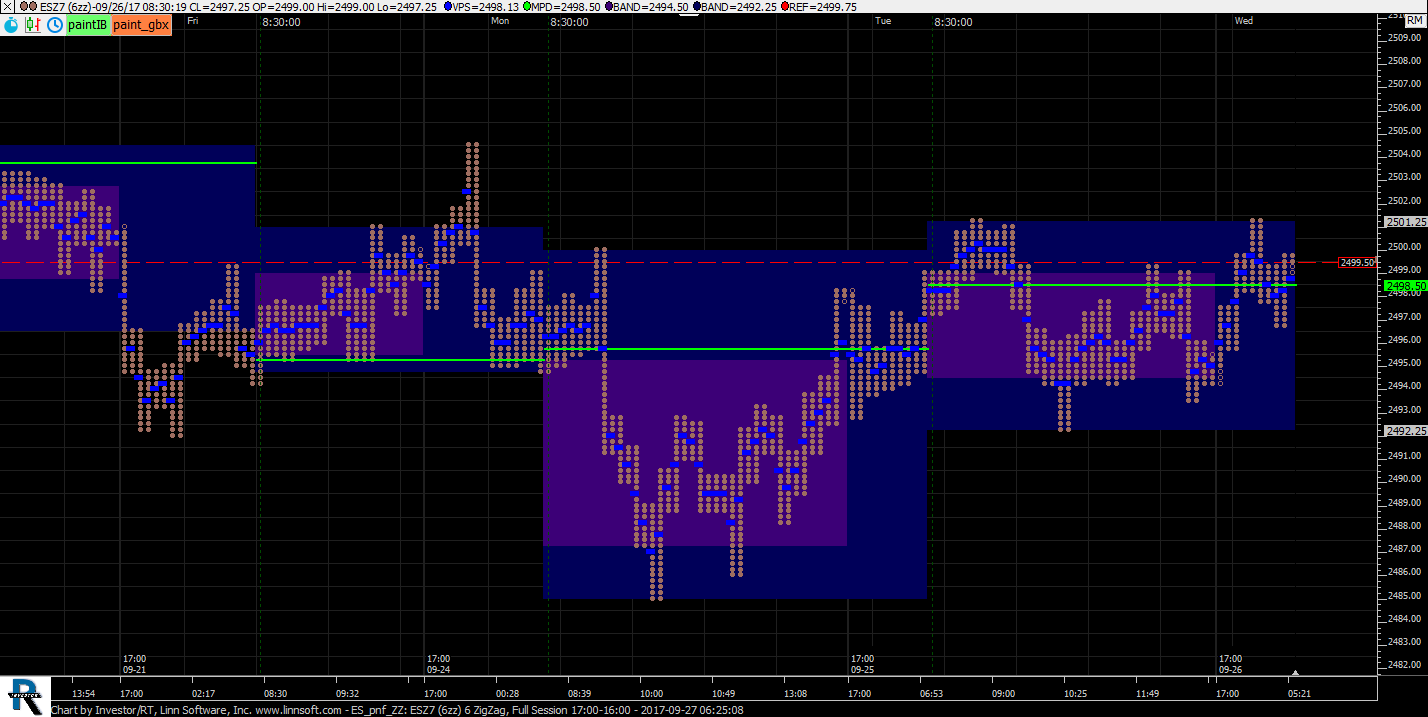
pnf style on ZigZag periodicity. This chart was uploaded by Investor/RT 12.7.6 showing symbol: ESZ7.