AverageChangeByMonth (@ES#)
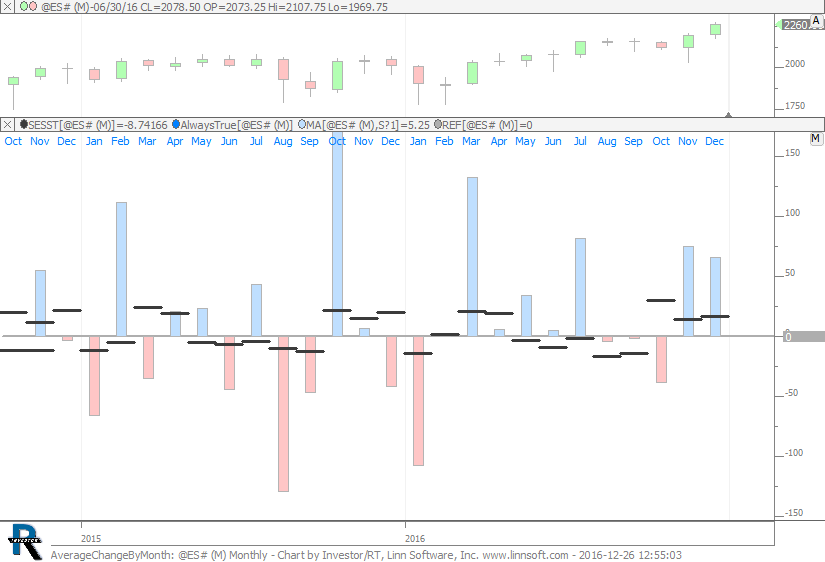
Average Change By Month - Black is Average since 1998. Histogram is change of that month. This chart was uploaded by Investor/RT 12.7.1 showing symbol: @ES#.
Average Change By Month - Black is Average since 1998. Histogram is change of that month. This chart was uploaded by Investor/RT 12.7.1 showing symbol: @ES#.
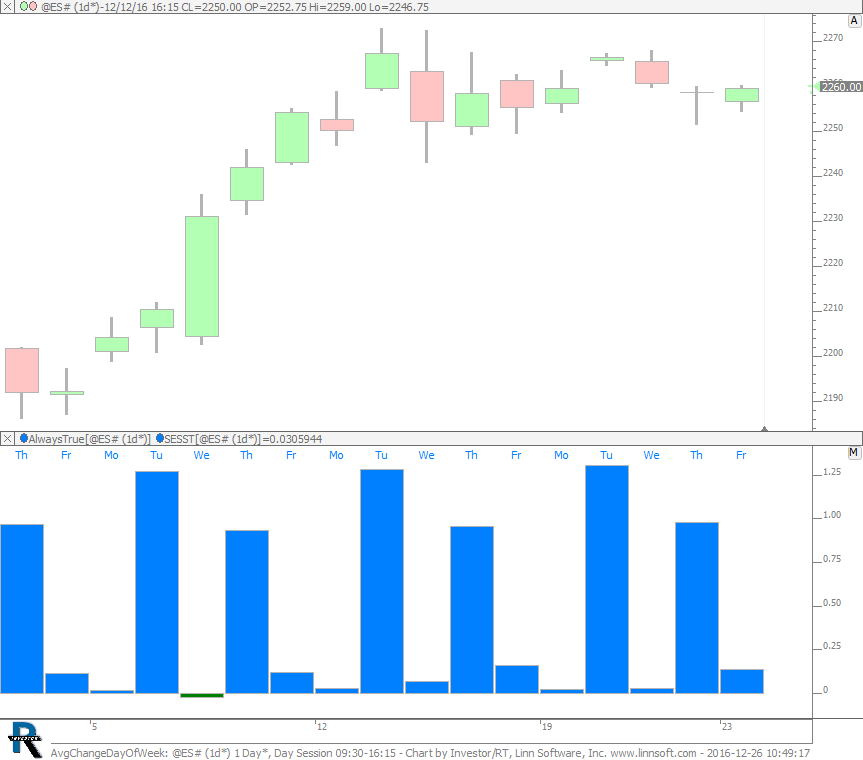
Average Change by Day of Week. This chart was uploaded by Investor/RT 12.7.1 showing symbol: @ES#.
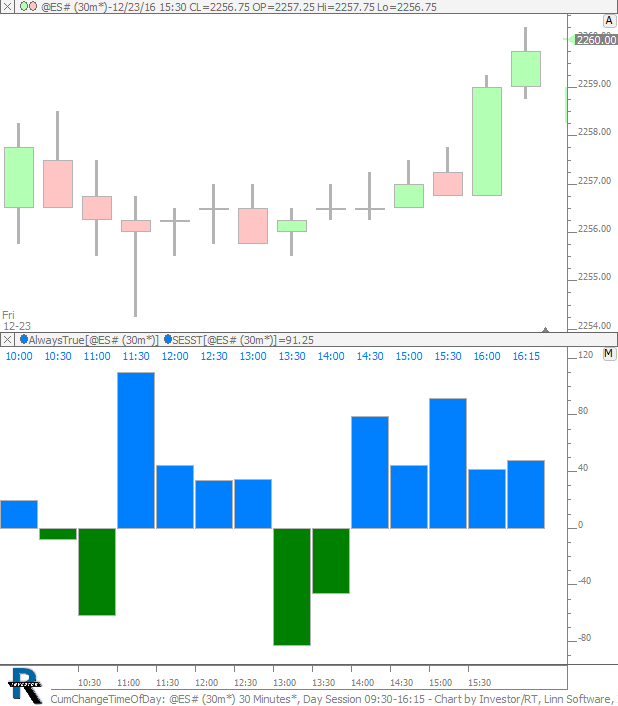
Cumulative Change by Time of Day. This chart was uploaded by Investor/RT 12.7.1 showing symbol: @ES#.
Cumulative Change by Time of Day using 30-minute periods. This chart was uploaded by Investor/RT 12.7.1 showing symbol: @ES#.
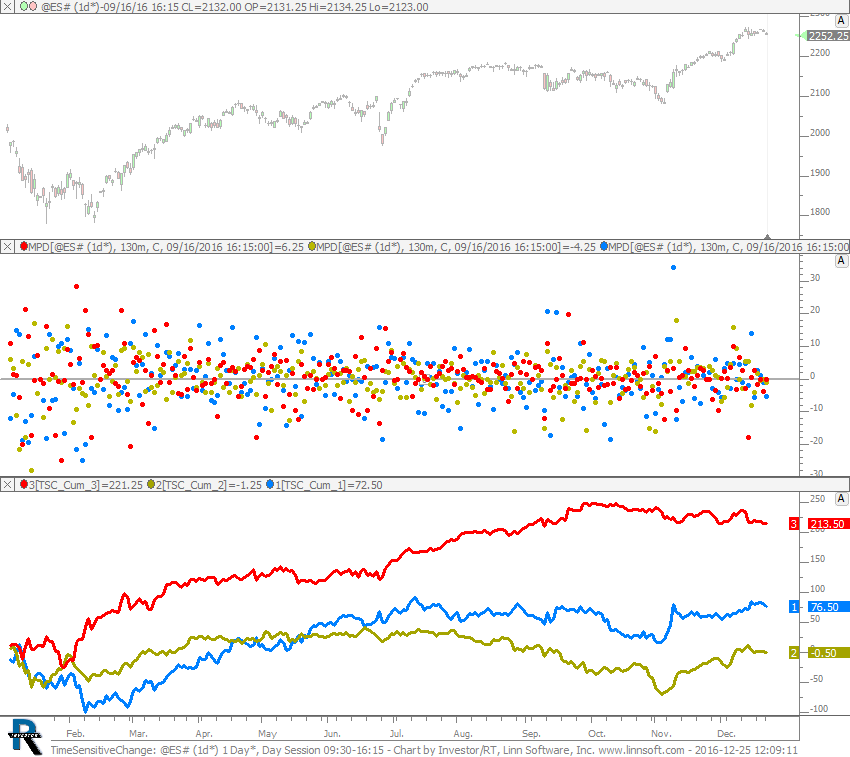
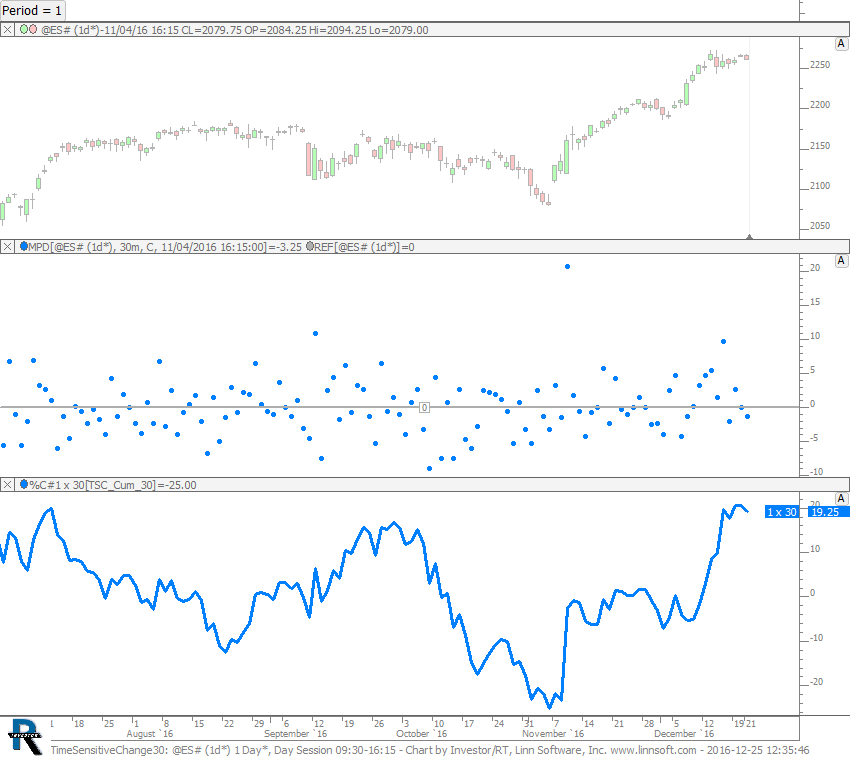
Time Sensitive Change - Blue is 1st 130 minutes. Gold is 2nd 130 minutes. Red is 3rd 130 minutes of day session. This chart was uploaded by Investor/RT 12.7.1 showing symbol: @ES#.
This chart was uploaded by Investor/RT 12.7.1 showing symbol: @ES#.
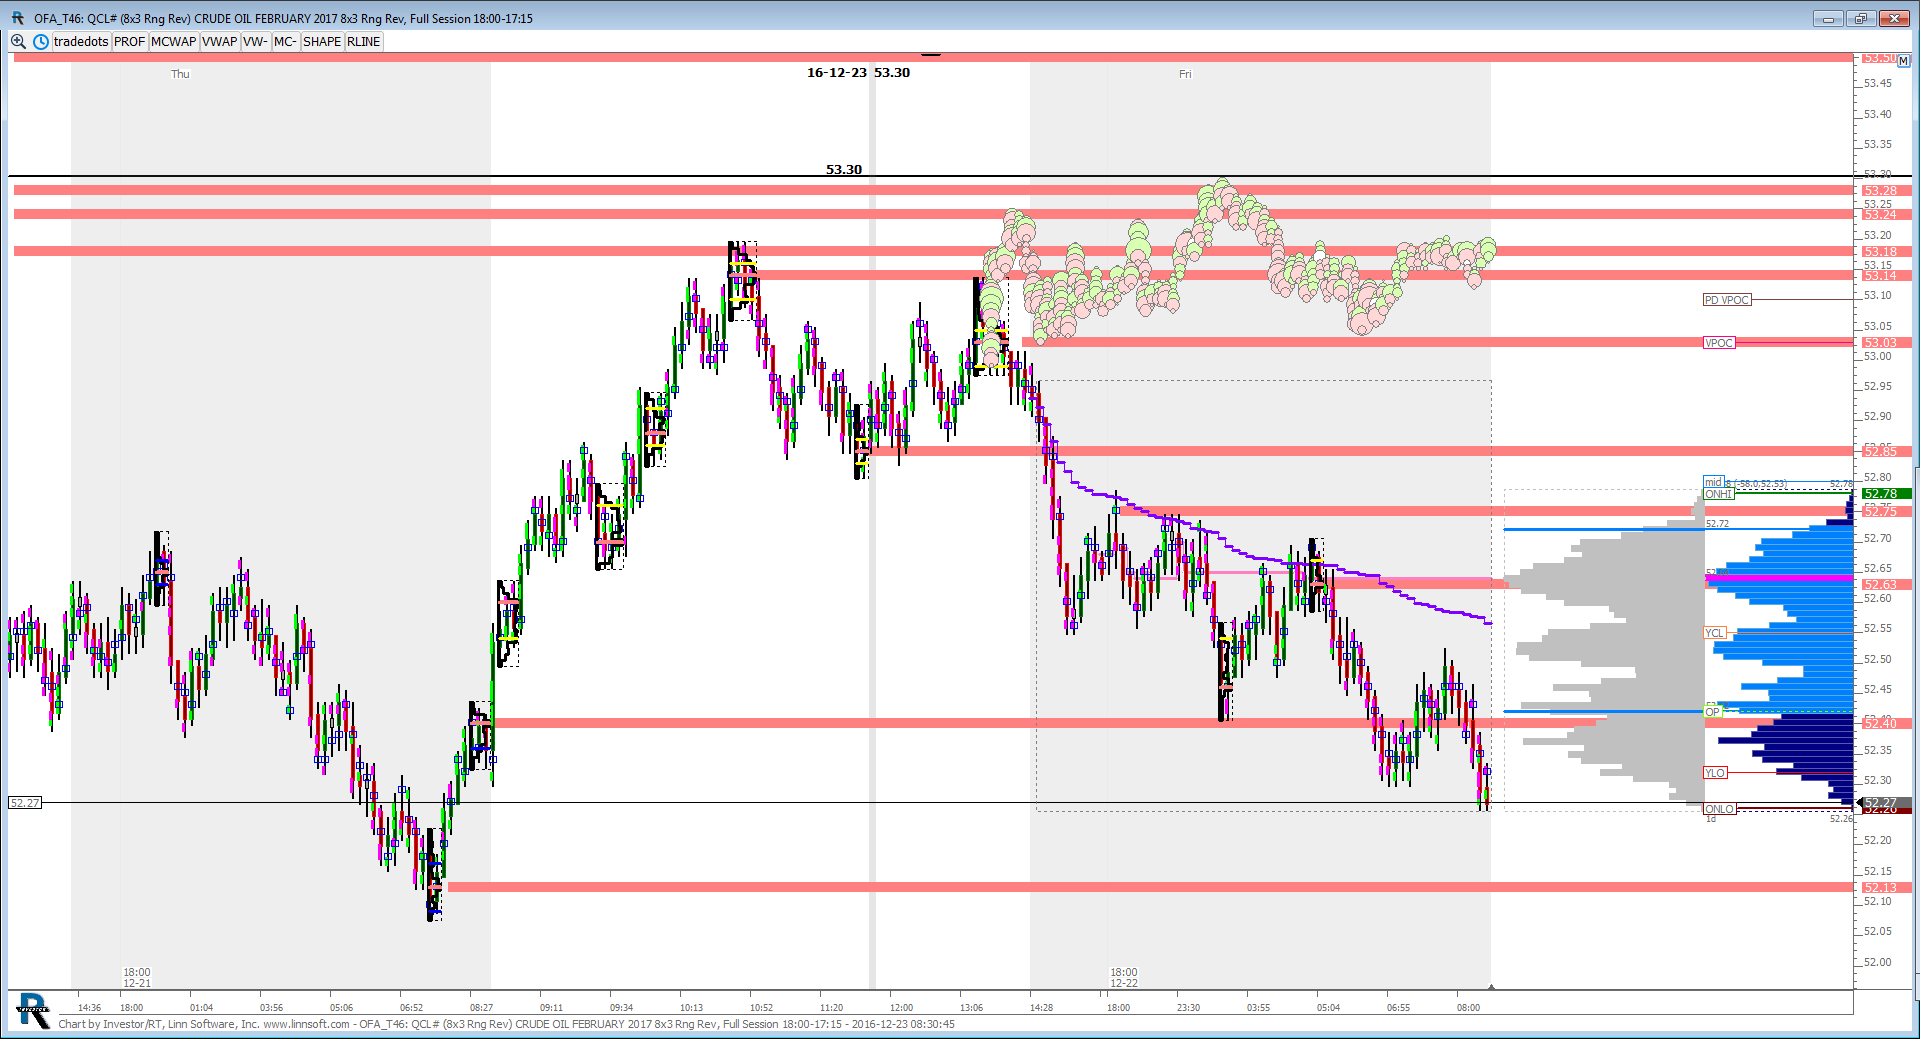
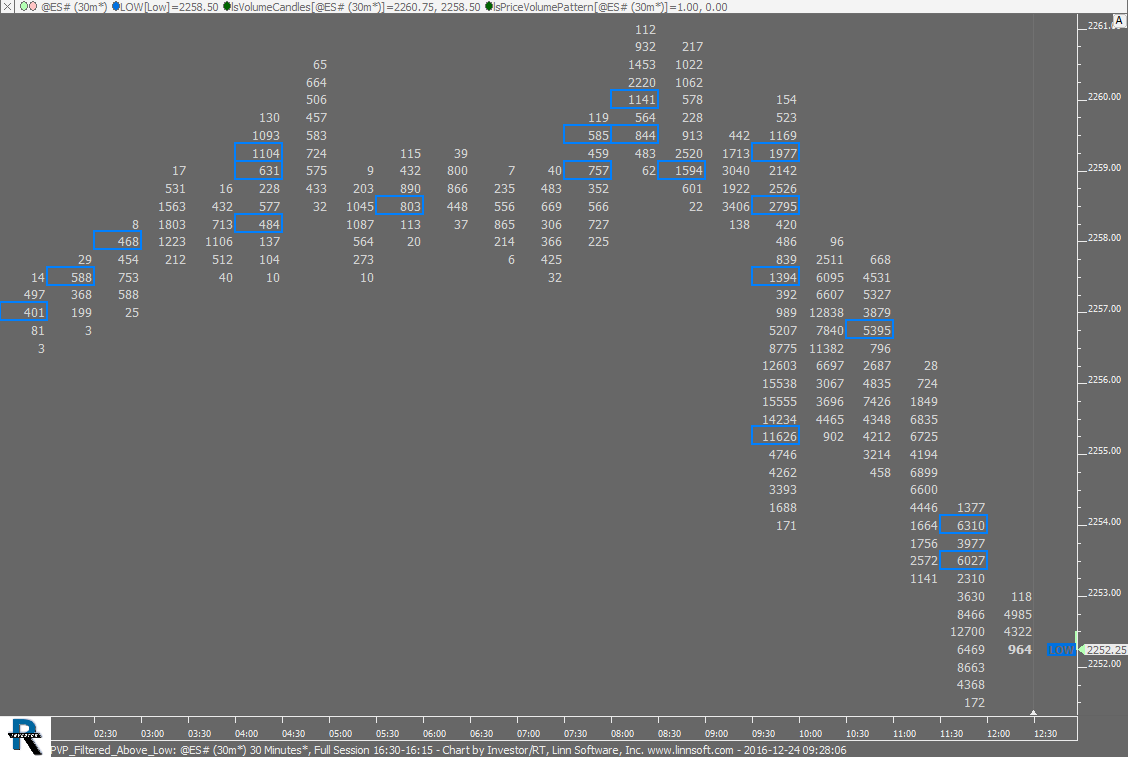
This chart was uploaded by Investor/RT 12.7.1 showing symbol: QCL#.
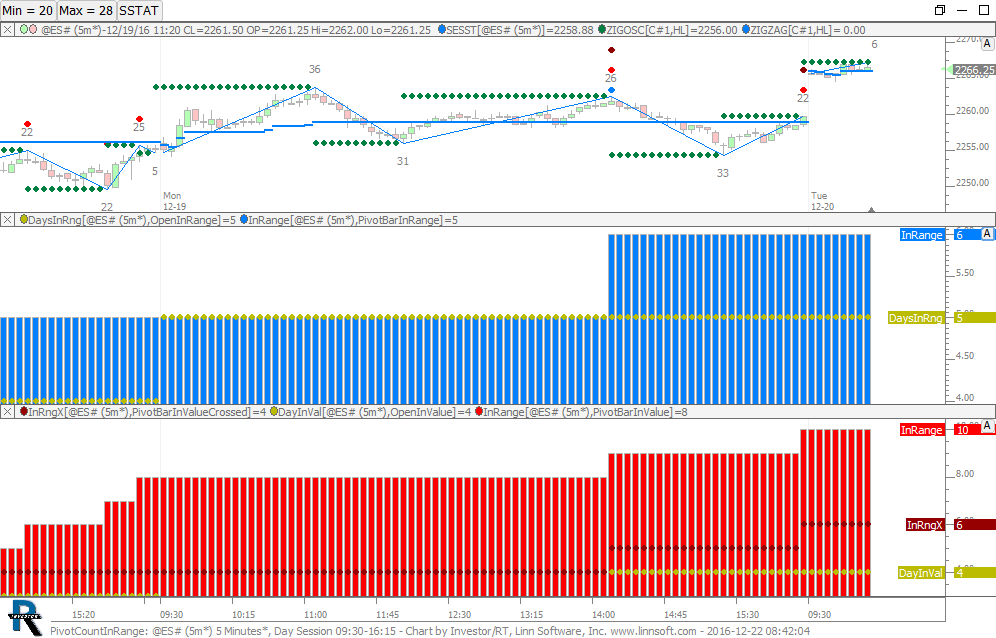
Pivot Count In Range?. This chart was uploaded by Investor/RT 12.7.1 showing symbol: @ES#.
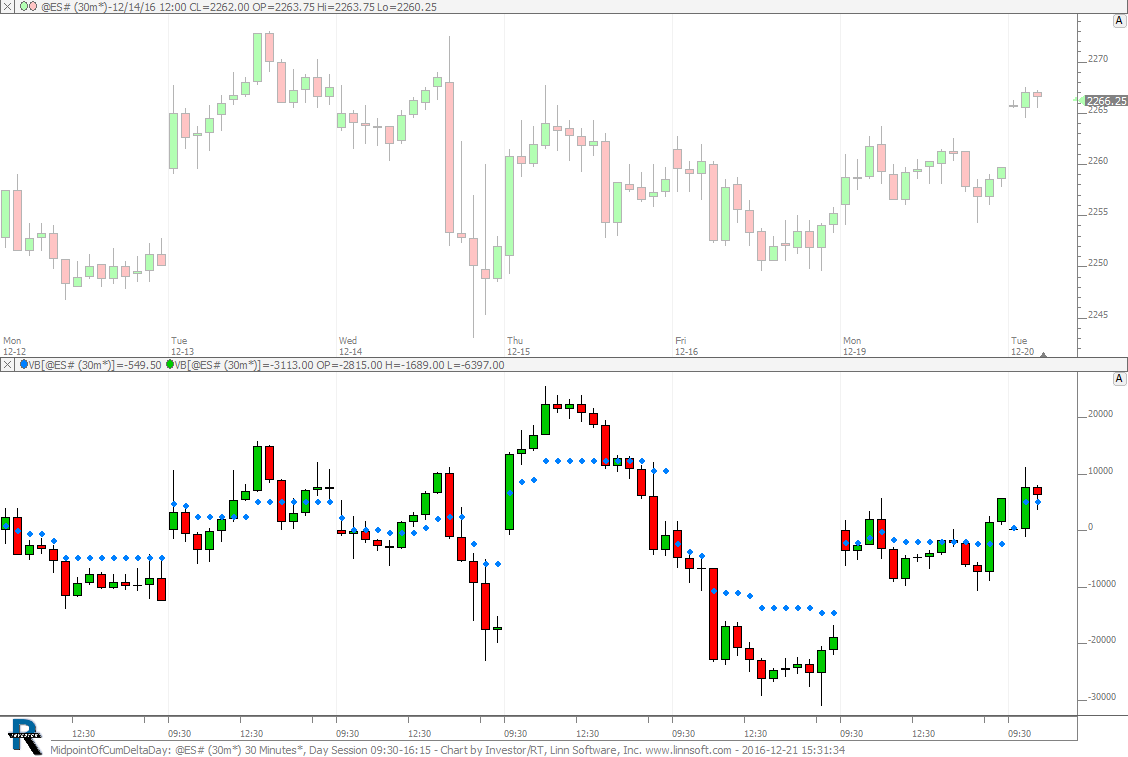
Midpoint of daily cumulative delta. This chart was uploaded by Investor/RT 12.7.1 showing symbol: @ES#.
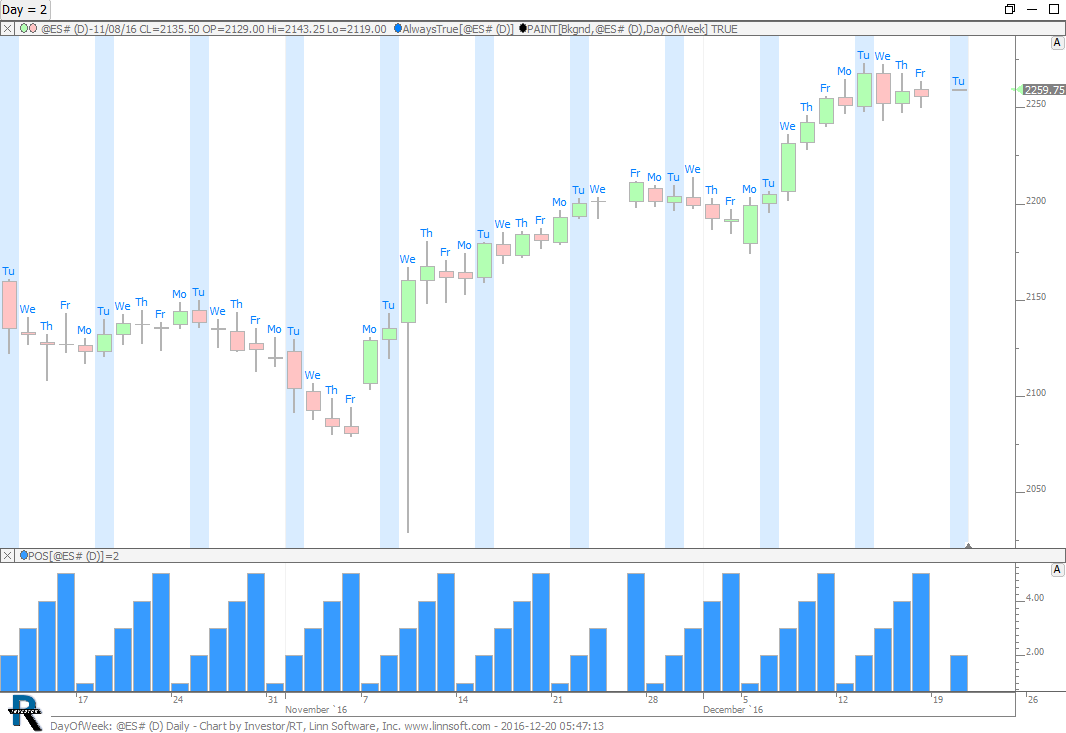
Day of Week. This chart was uploaded by Investor/RT 12.7.1 showing symbol: @ES#.