tutorials

Tutorial - Options Quotepage

The following steps will guide you through the process of setting up a quotepage to calculate and monitor these Option Analysis values:

  • Implied Volatility
  • Historical Volatility
  • Theoretical Value
  • Delta
  • Gamma
  • Theta
  • Vega
  • Rho
  • Lambda

Tutorial - Updating Charts

viewedit

If you're in a situation where your data feed is active and your charts are static (frozen), try stepping through this checklist until your charts update properly.

Tutorial - Three Line Break within a Custom QuotePage Column

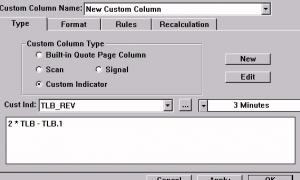
tlbCustColType

Now, let's create a Custom Column that builds off the TLB_REV Custom Indicator that we've already created, and then add this custom column to a quotepage.

First, go to "Setup Prefs: Custom Columns" and let's build our custom column. Starting with the "Type" tab, choose "Custom Indicator" as your Custom Column Type, and then choose the Custom Indicator "TLB_REV" from the list of Custom Indicators below. Choose the periodicity on which you would like your indicator evaluated. I'll use a periodicity of 3-minutes for this example. The window should now look like this...

Tutorial - Three Line Break with a Custom Indicator

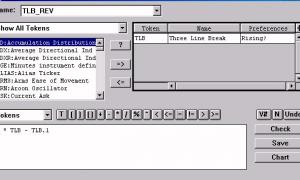
tlbRevCI

Now, let's create a custom indicator involving the TLB token. To create a custom indicator, go to "Setup: Custom Indicator", and setup the indicator based on the settings below.

Then save the custom indicator with a name like "TLB_REV" (for Three Line Break Reversal indicator).

In this custom indicator, we have set the TLB token up to use the data element "Rising?". As mentioned on the previous page, this token results numerically in a value of 1 when rising, and 0 when falling. Based on this, let's take a closer look at the syntax of our custom indicator...

Tutorial - Sending Your Database

Occasionally, when diagnosing a problem, Linn Software support may request that you send your data_f folder contents to enable us to reproduce the specific problem. Some problems are very specific to the particular way a chart or some other object is defined. Please do not email your database to support unless requested. The data_f folder/directory contains 59 files that constitute the Investor/RT database. Since this folder's contents can often be hundreds of megabytes in size, sending the data_f by email is impossible, even after compressing the files.

Tutorial - Scans - Renaming Tokens

Now let's look atthe following scan...

MAFIVE > MATEN AND MAFIVE1 <= MATEN1

The first thing you may notice about this scan expression is that the tokens MAFIVE and MATEN don't exist in the list of available scan tokens. These scan tokens names were the result of the renaming of two different moving average (MA) tokens. This scan required the use of the same token (MA) twice. In order to differentiate the two moving averages, we are required to rename MA.

Tutorial - Scans - Miscellaneous

Now let's look at some other useful scan operators and commands...

The command ROU(expression, n) takes the expression and rounds it based on the number n. For instance, if you supply an n of 0.01, it will round the value (HI + LO) / 2 to the nearest 100th. Similarly, if you specified a value for n of 1, it would have rounded the result to the nearest whole number, and assigned it to V#1.

Pages