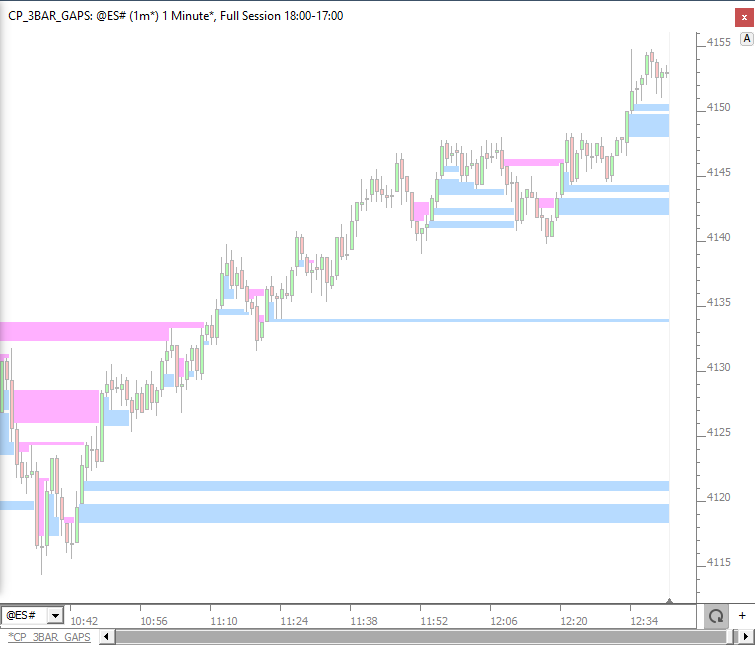
This chart demonstrates how to identify "3 Bar Gaps" in which the high of one bar is below the low of 2 bars before it...or, the low of one bar is above the high of 2 bars previous.
Chart definition: https://www.linnsoft.com/charts/cp-3bar-gaps-es

The blue bands identify 3-bar gaps up, and are implemented using the Bands indicator setup to draw a band between these 2 Custom Indicators...
(HI.2 < LO) * LO
and
(HI.2 < LO) * HI.2
The pink bands identify 3-bar gaps down, and are implemented using Bands indicator setup to draw a band between these 2 Custom Indicators...
(LO.2 > HI) * LO.2
and
(LO.2 > HI) * HI


