Hey!
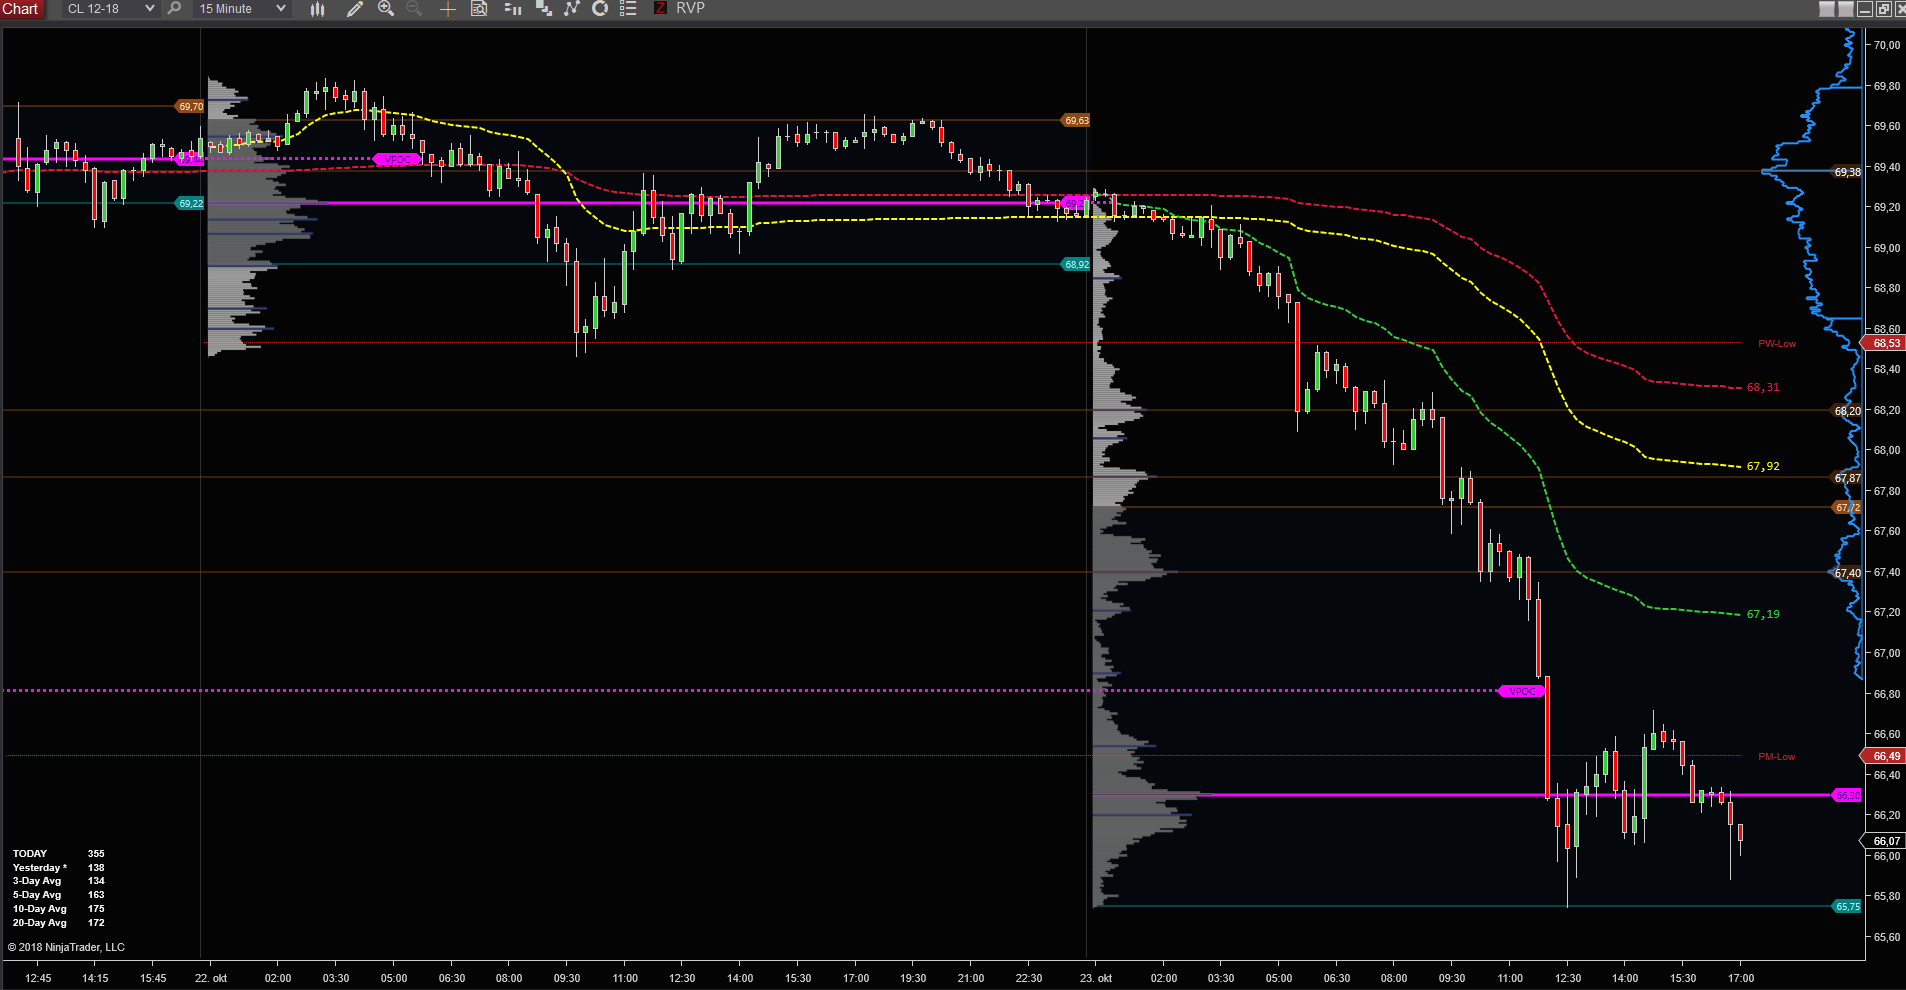
I am looking to create an overview map for myself with volume profile on it, VPOC from certain days and last but not least continued vwap. (See attached screenshot for example)
How would i go about doing this? Create a Volume profile chart - Mark VPOC (Which indicator is that?) and then add vwap to it?
When i add vwap to a 15 min chart, and scale out to see several days i get one vwap per day as default. But as seen on the screenshot i am looking to get at least 4 vwap lines.
Line 1 is current day vwap, line 2 is current day + yesterday added together, line 3 is today, yesterday and the day before that etc.
I hope some of you has an idea of how to accomplish this
Best
Chris


For your cumulative VWAPs, watch this video: https://www.linnsoft.com/videos/cumulative-vwap
The Profiles will use the Proifle Indicator: https://www.linnsoft.com/techind/profile