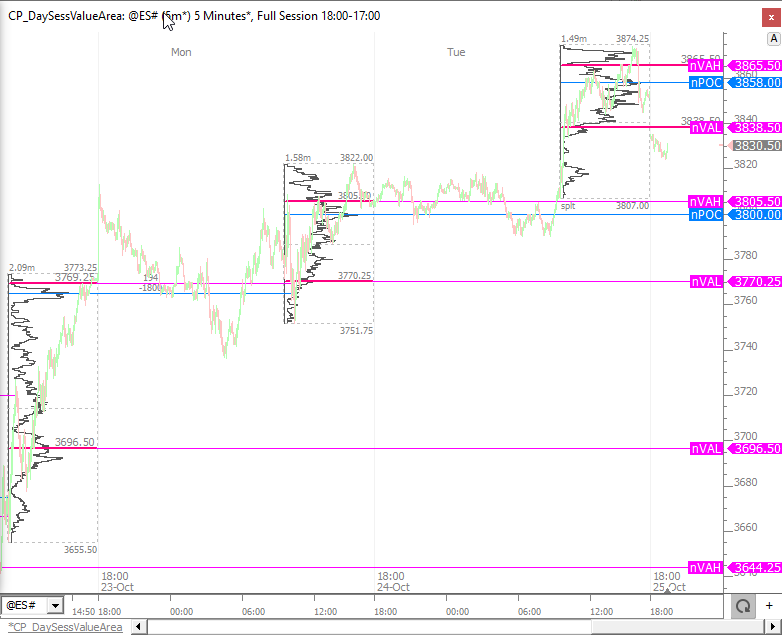
This post explains how to plot the naked day session VPOC, VAH, and VAL on a full session chart.
This can be accomplished using the Profile Indicator.

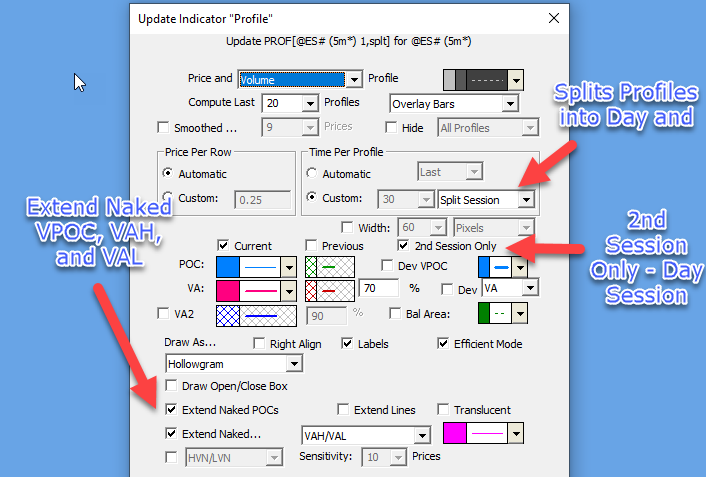
Several key settings of the Profile Indicator are highlighted below.

Note that the naked POC/VAH/VAL lines ignore the overnight data, and only terminate when they touch a future price during the day/RTH session.
Chart Definition: https://www.linnsoft.com/charts/cp-daysessvaluearea-es


