Hello.
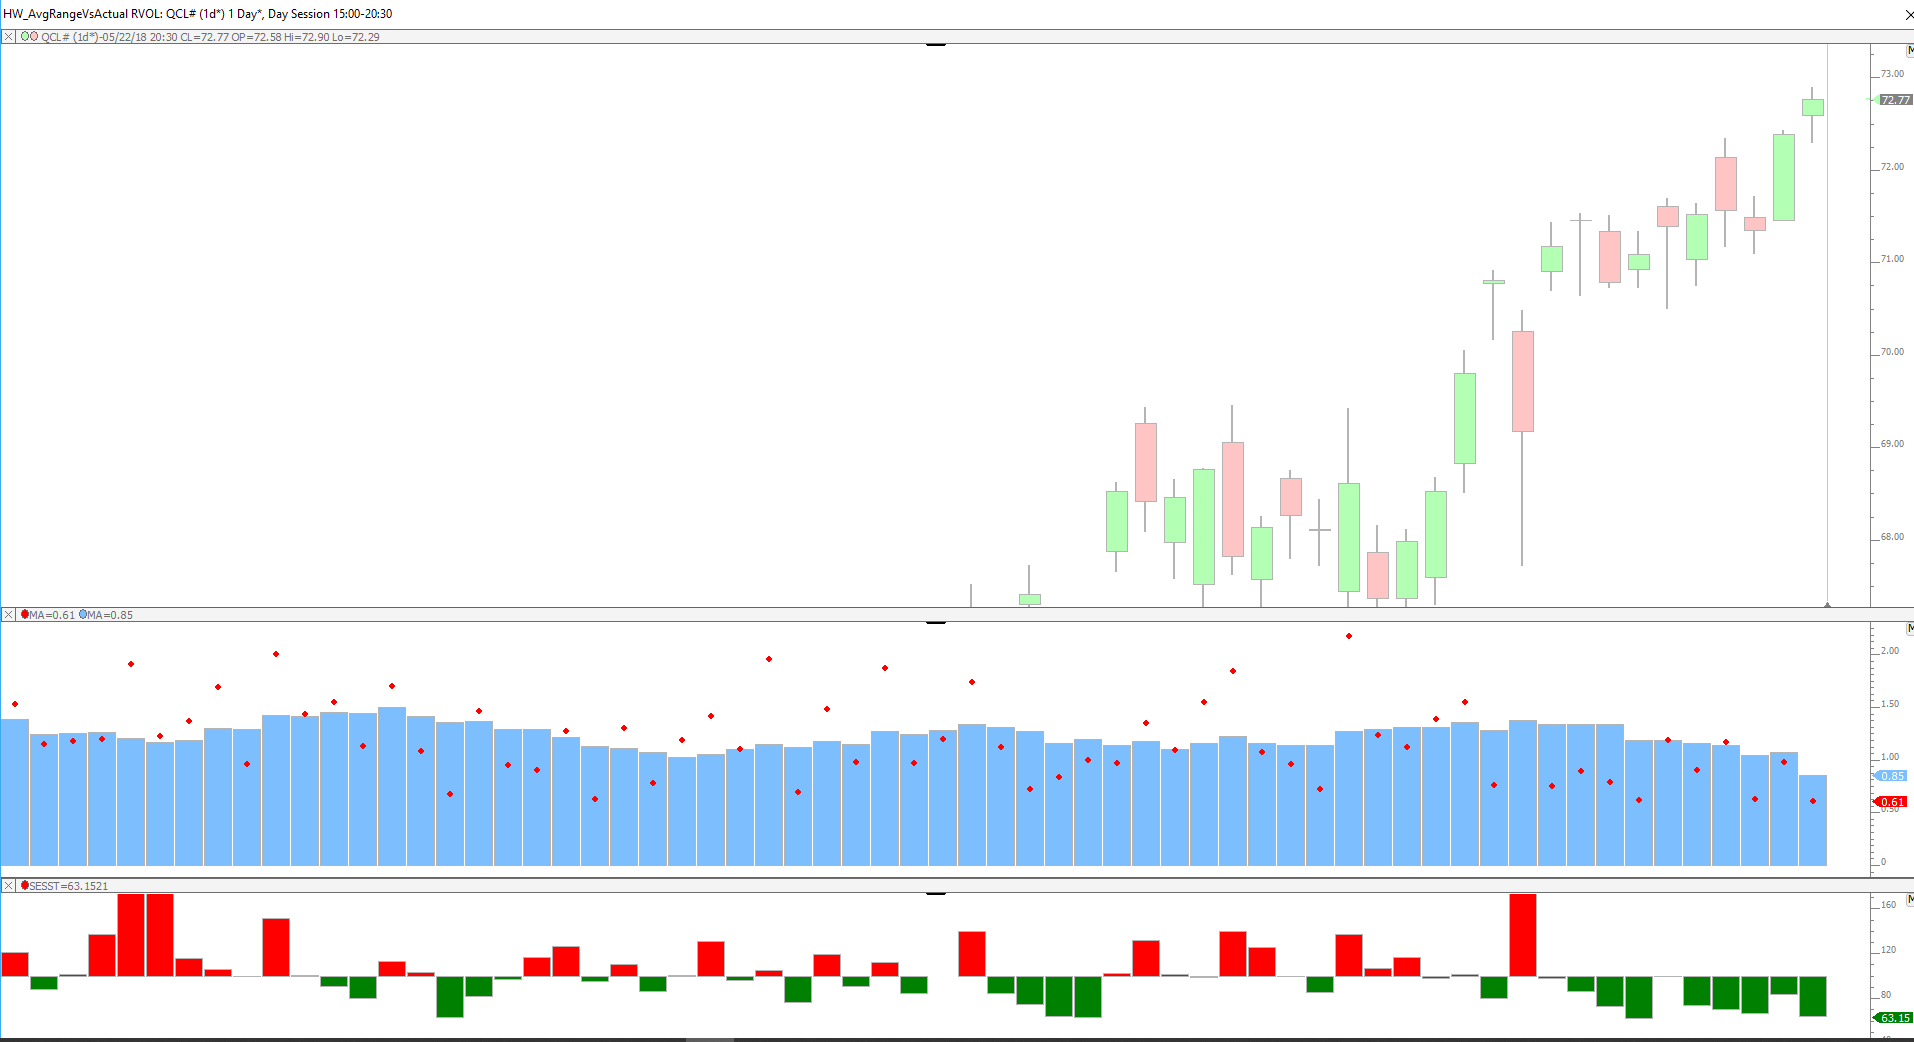
It's very odd looking at the chart I attached. Is there any way to have the view period fitted to the chart so everything can be seen at once?
For example if I wanted 1 year or 5 years. I'd like for all the data to fit on the chart regardless of the timeframe/view period.
Thank you


First, I'm sure you're aware that you can zoom the chart horizontally using the scroll wheel, and zoom the chart vertically using shift+scrollwheel, and scroll chart vertically using ctrl+scrollwheel. Also, you can operate the small button in upper right corner of scale and choose A for automatical scaling (scale to all elements in pane) or O for Instrument Only scaling (scale just to bars). Just in case you don't know these things, probably best to review this video > https://www.linnsoft.com/videos/investorrt-chart-setup-made-easy
However, there really is no way currently to force the data (all bars) to fit horizontally inside the space or width of the chart. I have added an option to the Button indicator which will do just this.... See image below. Simply choose the button purpose "Change the Pixels/Bar" and then instead of entering a number, just enter an A or Auto for the pixels. Now when clicking the button, the pixels per bar (bar width) will be adjusted, but will do so in a way when results in the data best fitting full inside the visible space. Keep in mind, if there are too many bars to fit (even at 1 pixel per bar), there is nothing that can be done to fit it all in. Also, it may not fit exactly (may be some whitespace on left) just because that's the best fit possible with each bar taking up the same amount space in pixels. This will be available in next release of IRT. Hope that helps.