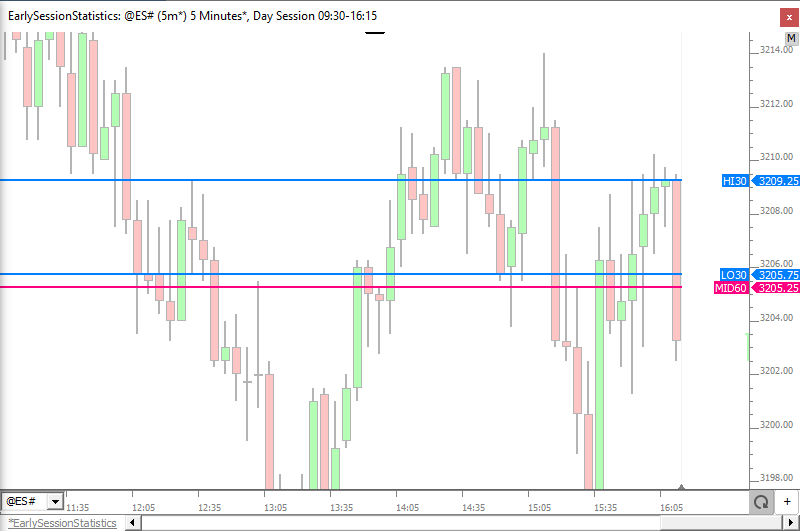
How do I plot the high and low of the first 30 seconds of the day session?
How do I plot the midpoint of the first hour of day session?
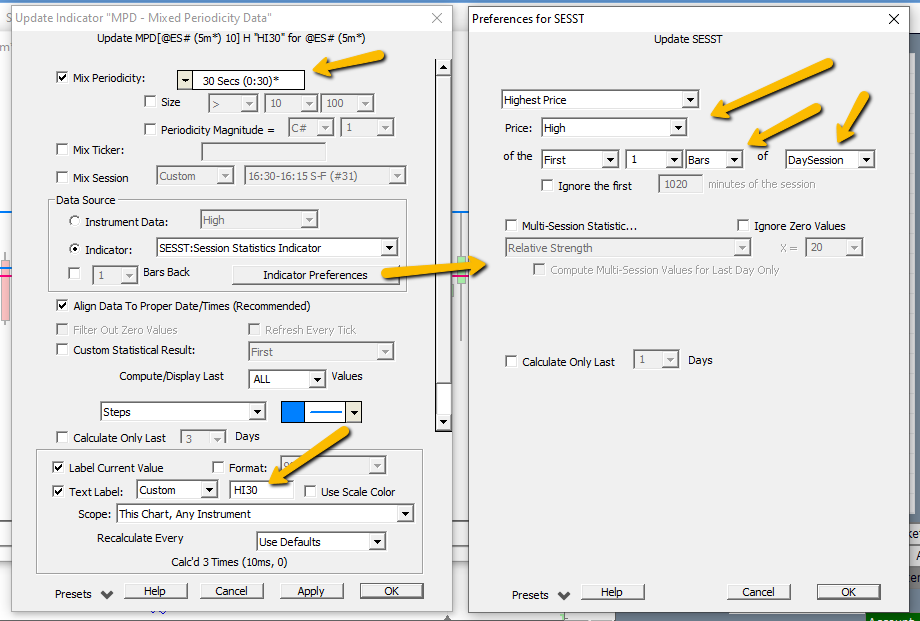
Use the MPD indicator with Session Statistics to plot each of these 3 prices. The image below demonstrates how to achieve the high of the first 30 seconds of the day session...

Import this chart definition to see all 3 prices implemented: https://www.linnsoft.com/charts/earlysessionstatistics-es
To change 30 seconds to 1 minute, simply change the periodicity within MPD to 1 minute (or 5 min for first 5 minutes of day session).


