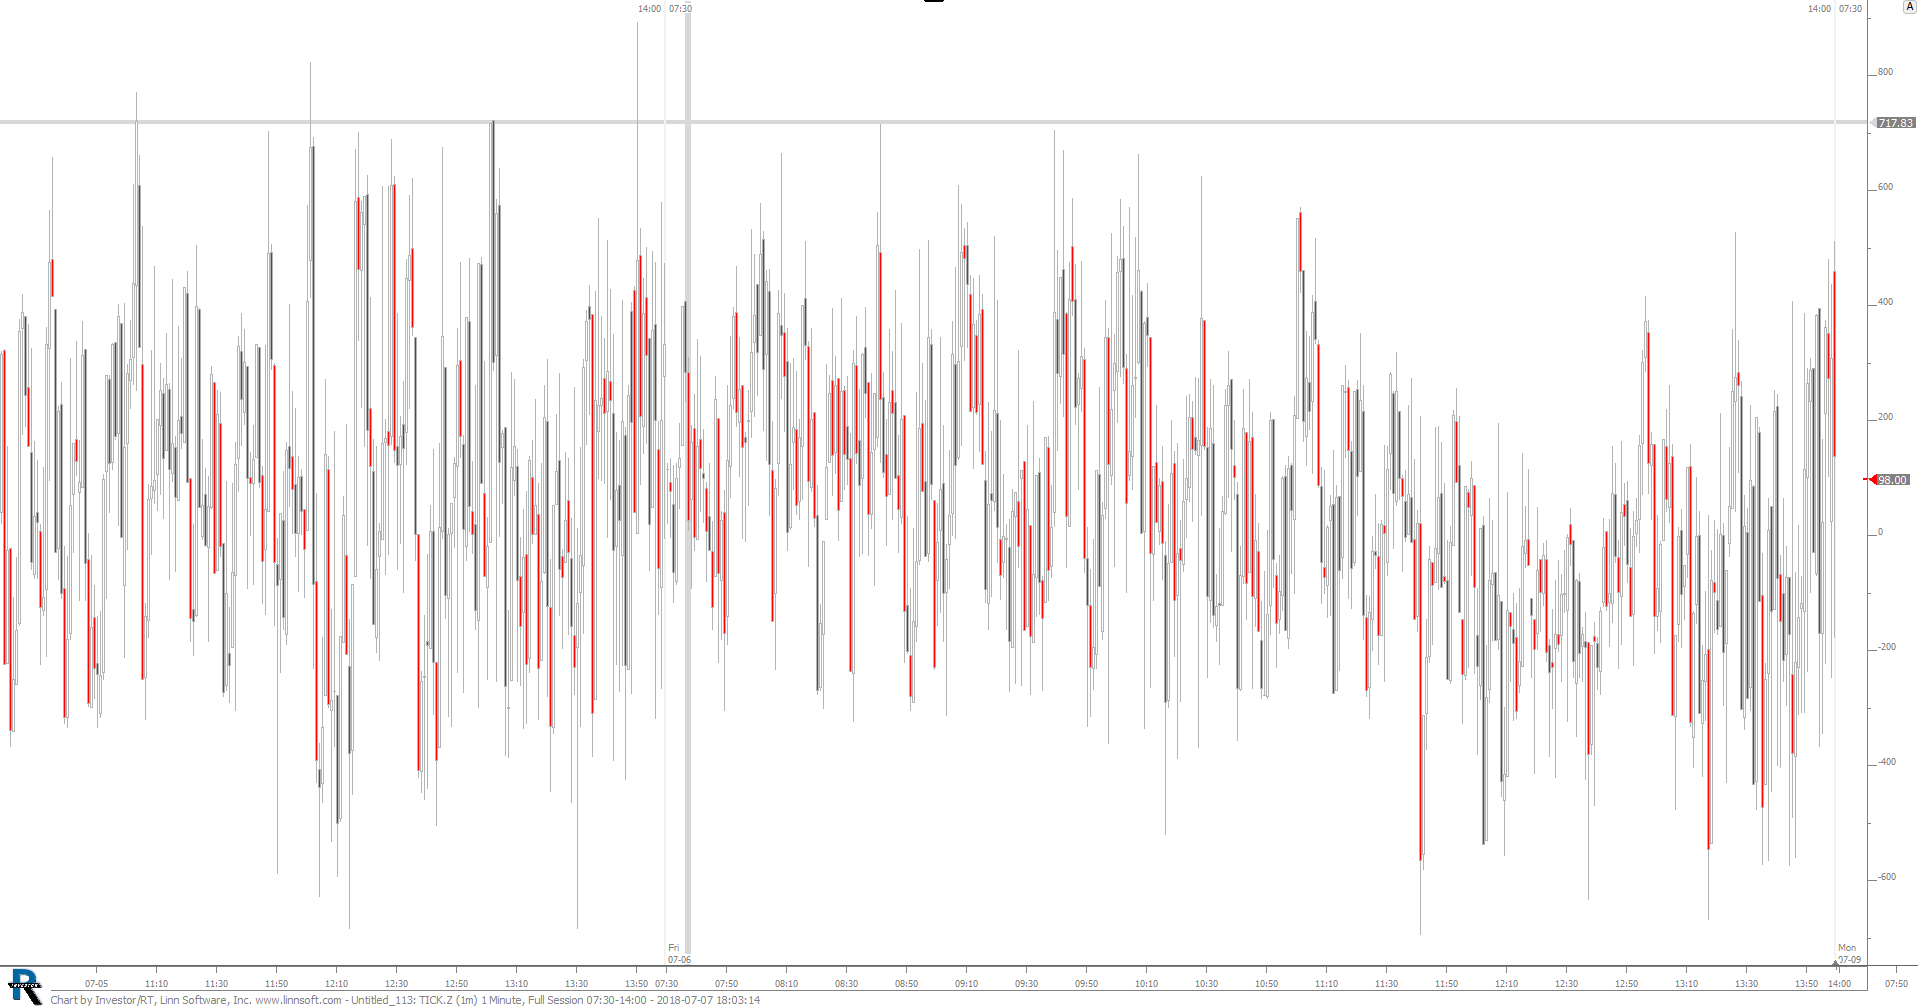
Hey Chad,
I'm working on a strategy to trade the volatility ETFs like VXX and UVXY.
One of the indicators I'm using is the NYSE Tick via IQ Feed (TICK.Z).
I want to chart the inverse of TICK.Z. Something like: 1 / TICK.Z.
This inverse NYSE Tick would then be positively correlated with VXX and UVXY.
How can I chart a 1 / TICK.Z, or the inverse? By "chart," I mean just a typical 1-minute candlestick chart with OHLC data like the attached example.
I'm aware of SVXY, which is positively correlated, but not trading.
Thanks in advance!


I figured this out last night and thought I'd share for anybody else that's run into this.
It's actually pretty simple, using a custom instrument.
I wanted the inverted version of the NYSE Tick as an instrument because I'm applying other indicators.
So the solution is to set-up a custom instrument and subtract TICK.Z from itself.
Best I can tell, this is the easiest way to handle the positive and negative values.
Looks something like this: TICK.Z x 1 - TICK.Z x 2
Gives me an NYSE Tick that's positively correlated to VXX and UVXY.