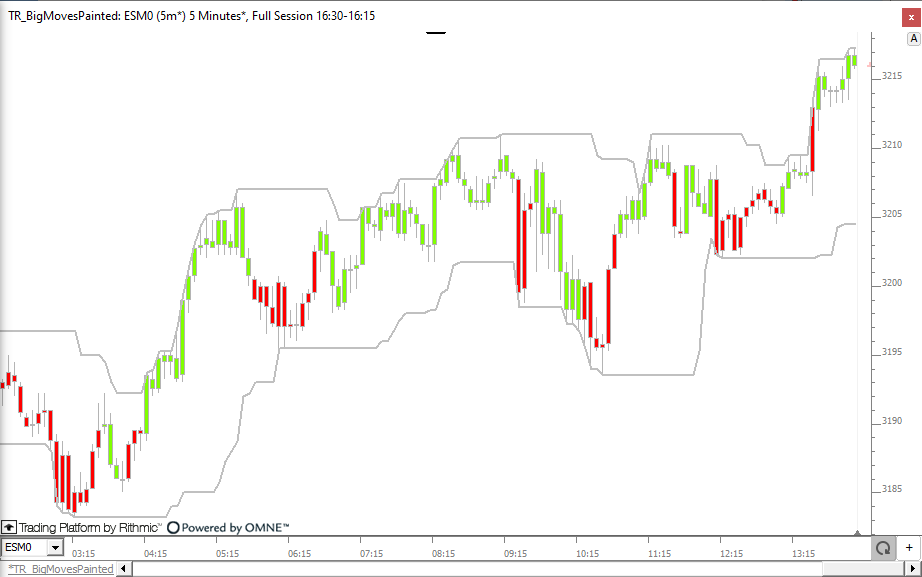
This chart demonstrates how to paint bars green when price moves 1.5 x ATR from the lowest low of last 16 bars, and hold that color until price moves down 1.5 x ATR from highest high of last 16 bars.

Chart Definition: https://www.linnsoft.com/charts/tr-bigmovespainted-esm0


