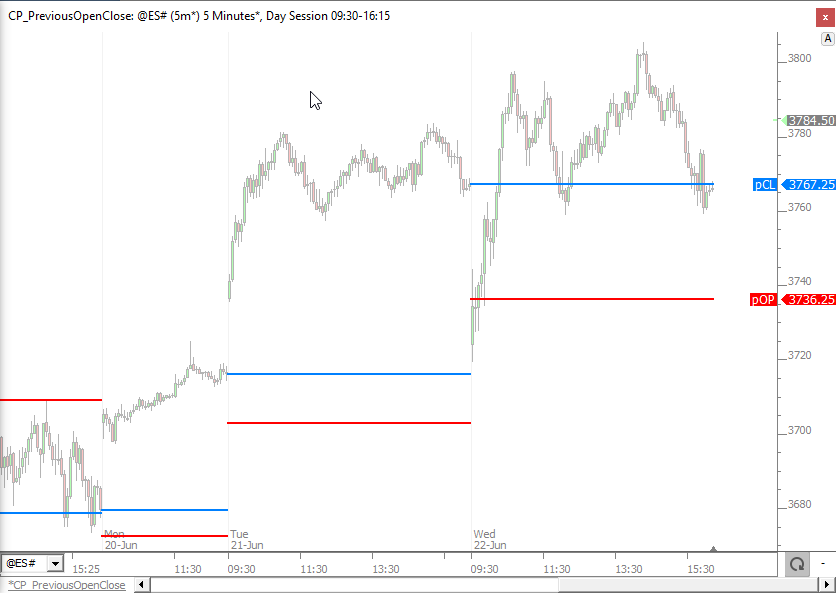
The chart below plots the previous days close (blue) and open (red)...
https://www.linnsoft.com/charts/cp-previousopenclose-es

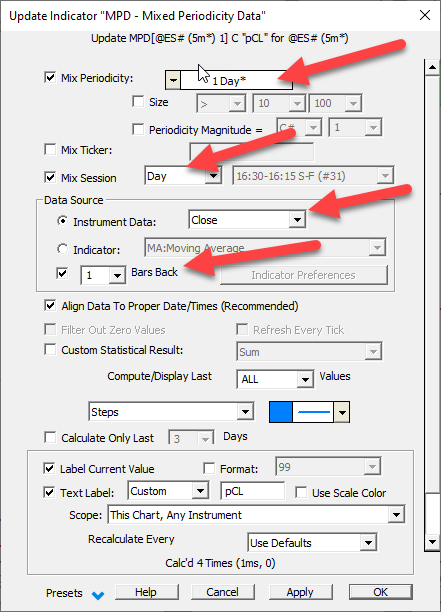
Both are using the MPD (Mixed Periodicity Data) indicator set to periodicity "Time Per Bar: 1 Day" with data of "Close - 1 Bar Back" (which results in 1 day back with the daily periodicity). Also have "Mix Session: Day" to force it to just work with the day session data an give us both the open and close of the day session. At the bottom, the text label is turned on and set to pCL and pOP.

To plot the open or close of 2 days back, simply change the Bars Back setting to 2. (or 3 for 3 days back, etc). To plot the high or low of previous days, simply change the Instrument Data from Close to High or Low (or HI+LO/2 for midline).


