This topic explains how to configure charts so that each symbol has a unique periodicity as you switch the chart from one symbol to another. For instance, @ES# uses 5 minutes, @NQ# uses 10 minutes. Or @ES# uses 5000 volbar while @NQ# uses 10000 volbar.
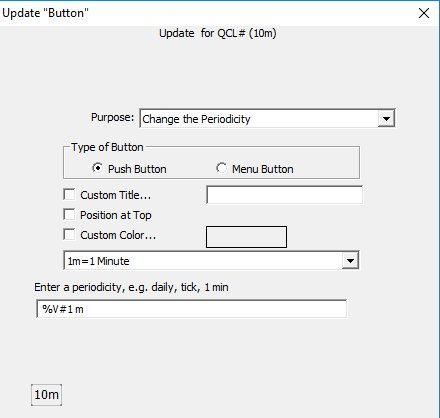
To accomplish this, simply add a Button Indicator to your chart with these settings...

Notice the periodicity is setup as
%V#1 m
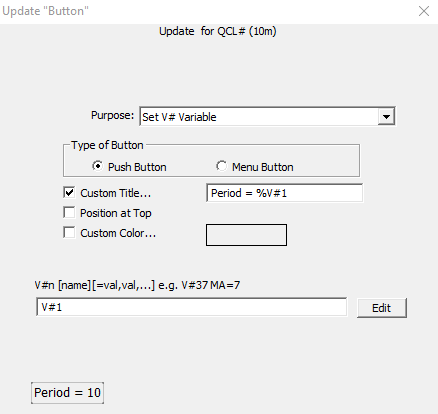
It could be %V#1 Volume Bar or %V#1 TickBar or %V#20 min, or %V#21 Renko, etc. It can handle any periodicity and use any V#. In this case, each time you change the symbol in the chart (by simply clicking on chart, typing ticker symbol, hit enter), not only will the symbol change, but the periodicity will also change using the V#1 value of the new symbol as the number of minutes. It might also be convenient to add another Button indicator to the chart like you see below to allow you to quickly adjust the value of V#1.

Or you can just add the V#1 column to a quotepage so you can quickly adjust V#1 for any symbol there. You also could have a custom quotepage column setting V#1 dynamically based on various other criteria (like average daily volume or average daily range).


