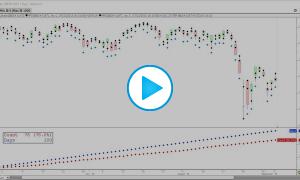
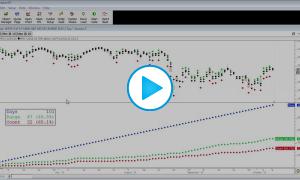
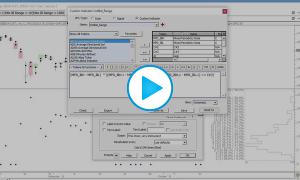
In this video, Homework #22 and Lesson #6 in "Extracting Market Behavior" series, we explore how to filter distributions to help identify sequential relationships in data. Specifically, we look at the day session change, and evaluate the effect of the overnight change on the day session change. For instance, if we had a very positive overnight session, what did the distribution of the day session change look like? What was the median, the mean, the mode, etc. If we had a very negative overnight session, how did that effect the day session change? This concept can be applied to any sequential events, such as how the IB Range effected the Range of the remainder of the session. How did the volume of one day effect the volume of the following day.


Comments
Hi! I'm trading a swedish