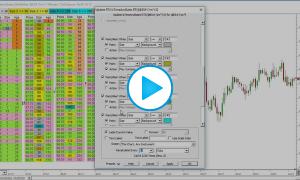
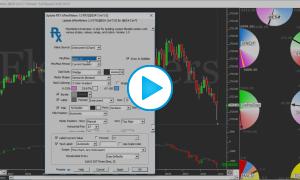
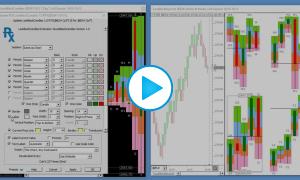
The RTX TimeAndSales extension (TAS) is used to embed time and sales displays into any Investor/RT chart window. TAS introduces a variety of new time and sales capabilities such as flexible filtering, highlighting and alerting options and much more. Display columns are user customizable. These include new data items of interest to traders: Skips, Bid Volume, Ask Volume, Age, Ticks Back and Consolidated Trades. A typical usage scenario would be to show only those trades with size > 30 and/or to highlight any trades >= 100 visually and/or with an audible alert. Another example might to use the accumulate data feature (a one row display) while the auction (bid/ask price) remains the same. The row will then show accumulated bid and ask volume, total volume, and delta for that auction and enables alerting and highlighting on any of those data values. The power of TAS is the ability to extract and/or accumulate key data items from the tape and present it in a concise, well decorated form. Up to 8 painting and alerting options are available with great flexibility in respect to the data used as a basis. TAS may be positioned anywhere in a chart. A variety of options are available for row/column width and space, font size and style, and text/background coloring/painting. TAS may be dragged and dropped anywhere in the chart using the mouse or fine-tuned using the up/down/left/right arrows on the keyboard. The TAS display is populated using historical tick data when opening the chart or changing symbols; thereafter the presentation updates as bid/ask changes and new trades occur in realtime. TimeAndSales can be used during Playback to experiment with various settings and to observe display behavior during prior trading sessions. Buttons can be used to dynamically adjust the filtering or painting/alerting options (using C# chart variables) with immediate feedback upon changes.


Comments
T&S