 |
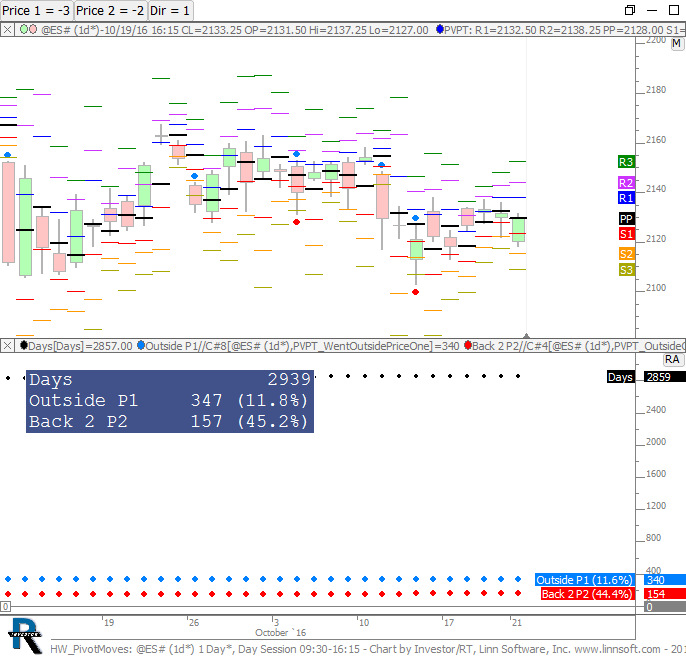
HW PivotMoves (@ES#) cpayne [totalcount]
8 years 1 month ago
Analyze Moves Between Any Two Pivot Levels. This chart was uploaded by Investor/RT 12.7.1 showing symbol: @ES#. |
View |
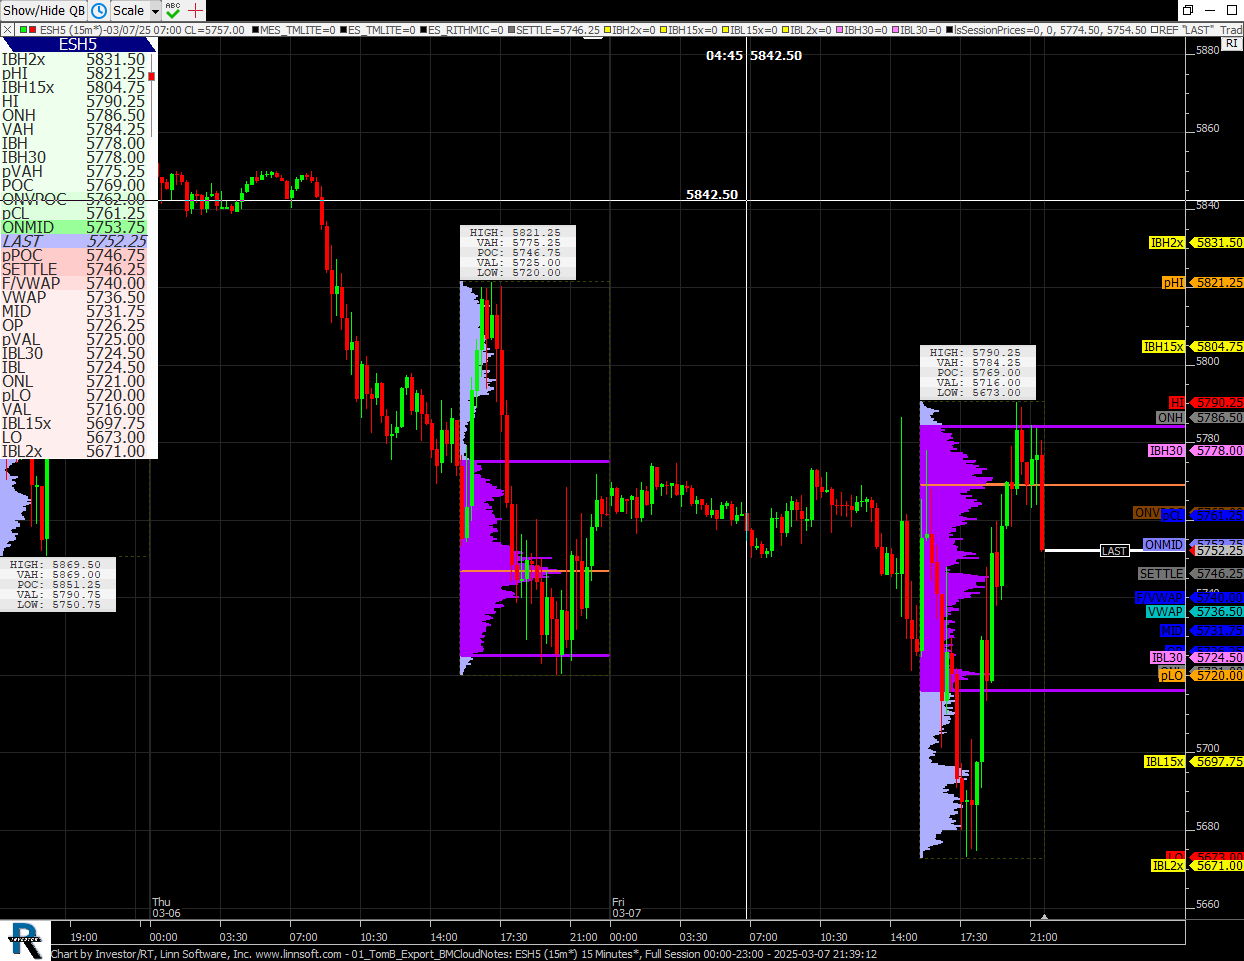 |
01 TomB Export BMCloudNotes (ESH5) Eddy [totalcount]
1 month 1 week ago
Tom B Traders Lab - Export to Bookmap Cloud Notes. This chart was uploaded by Investor/RT 15.2.6 showing symbol: ESH5. |
View |
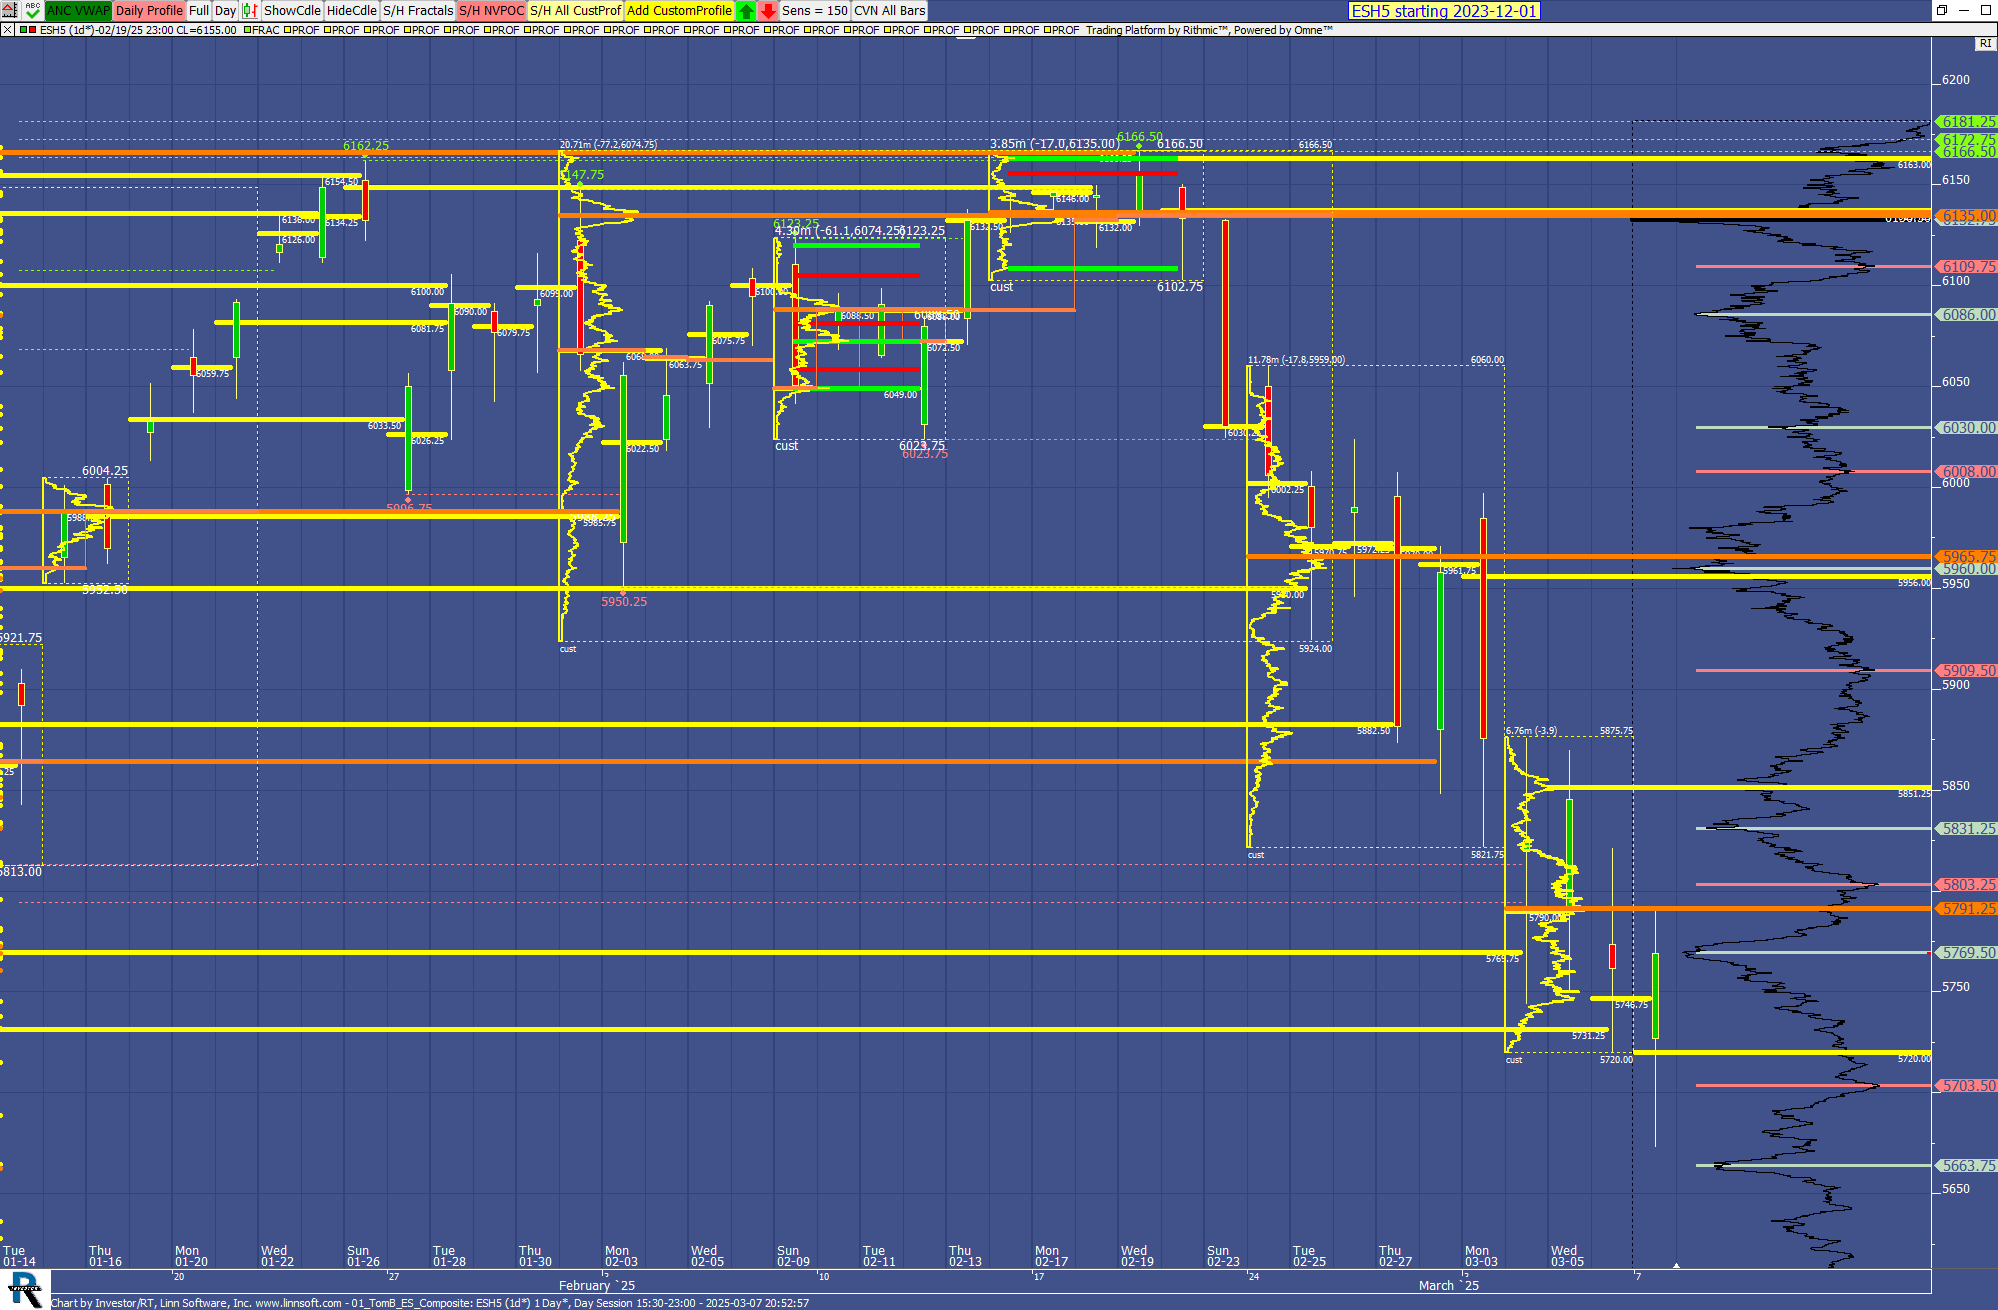 |
01 TomB ES Composite (ESH5) Eddy [totalcount]
1 month 1 week ago
Tom B Traders Lab - Composite profile chart. This chart was uploaded by Investor/RT 15.2.6 showing symbol: ESH5. |
View |
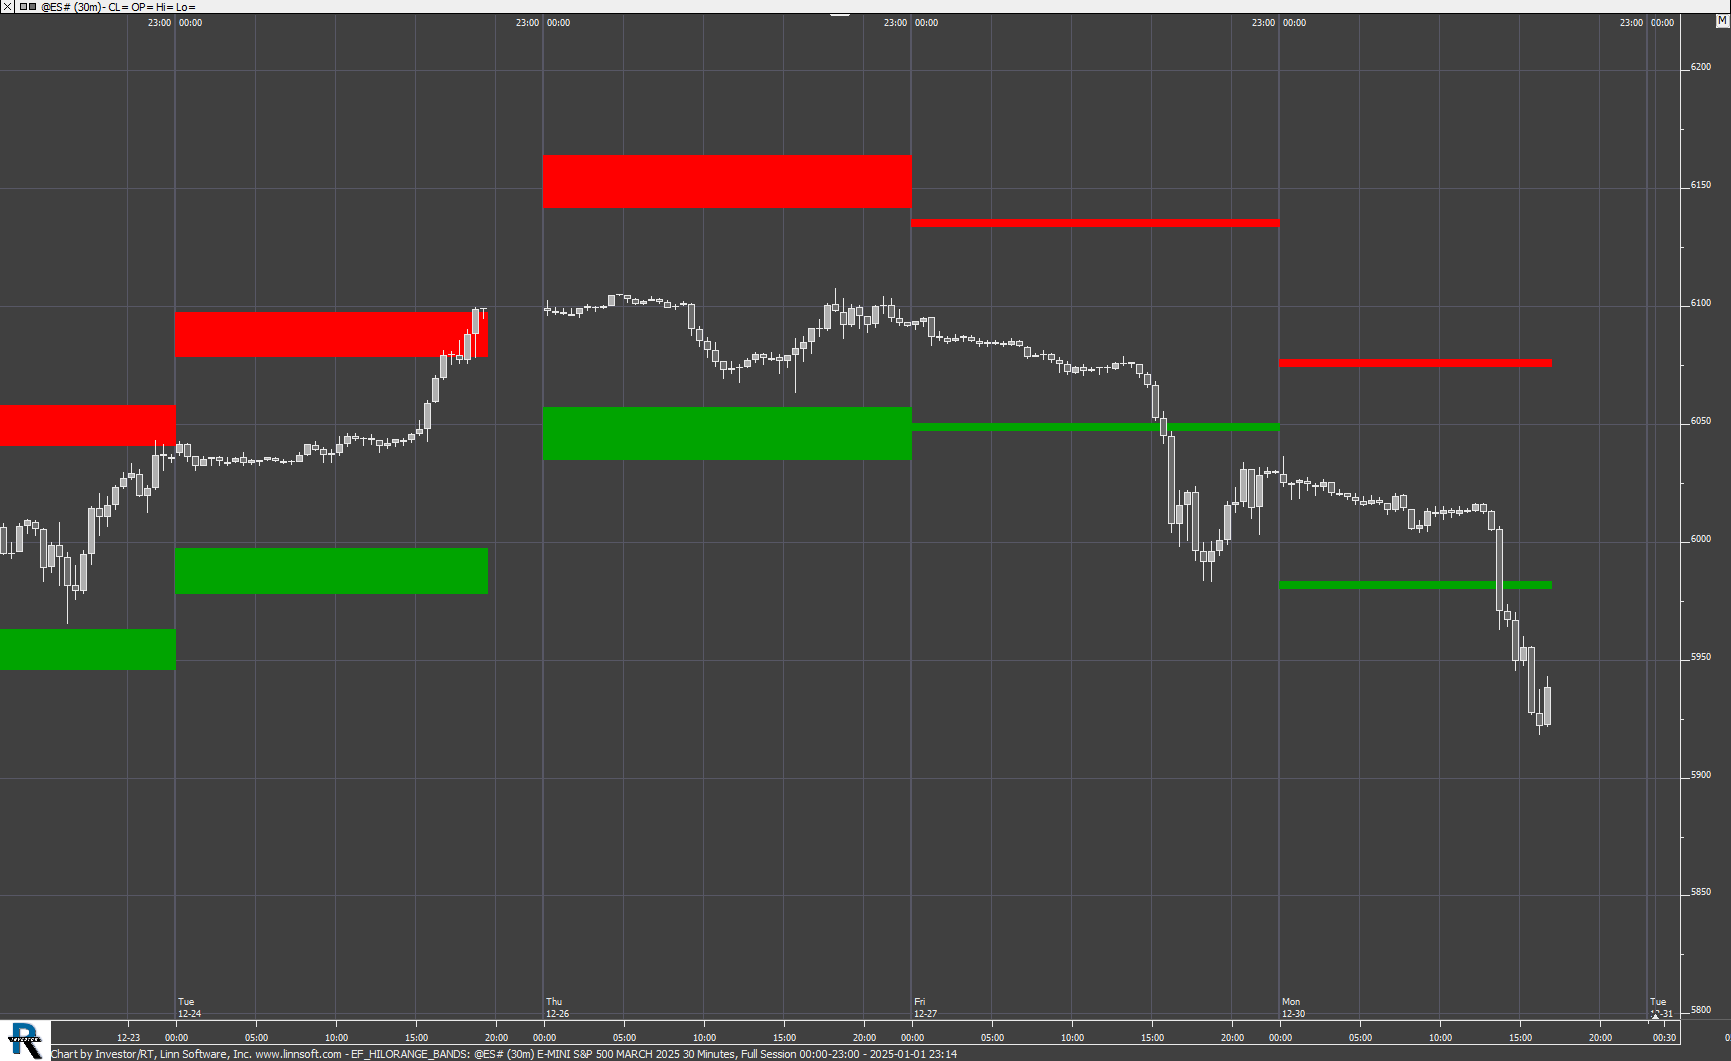 |
EF HILORANGE BANDS (@ES#) Eddy [totalcount]
3 months 1 week ago
Example for using the MPD token and displaying zone (on an intraday chart) derived from daily average HI-LO range. |
View |
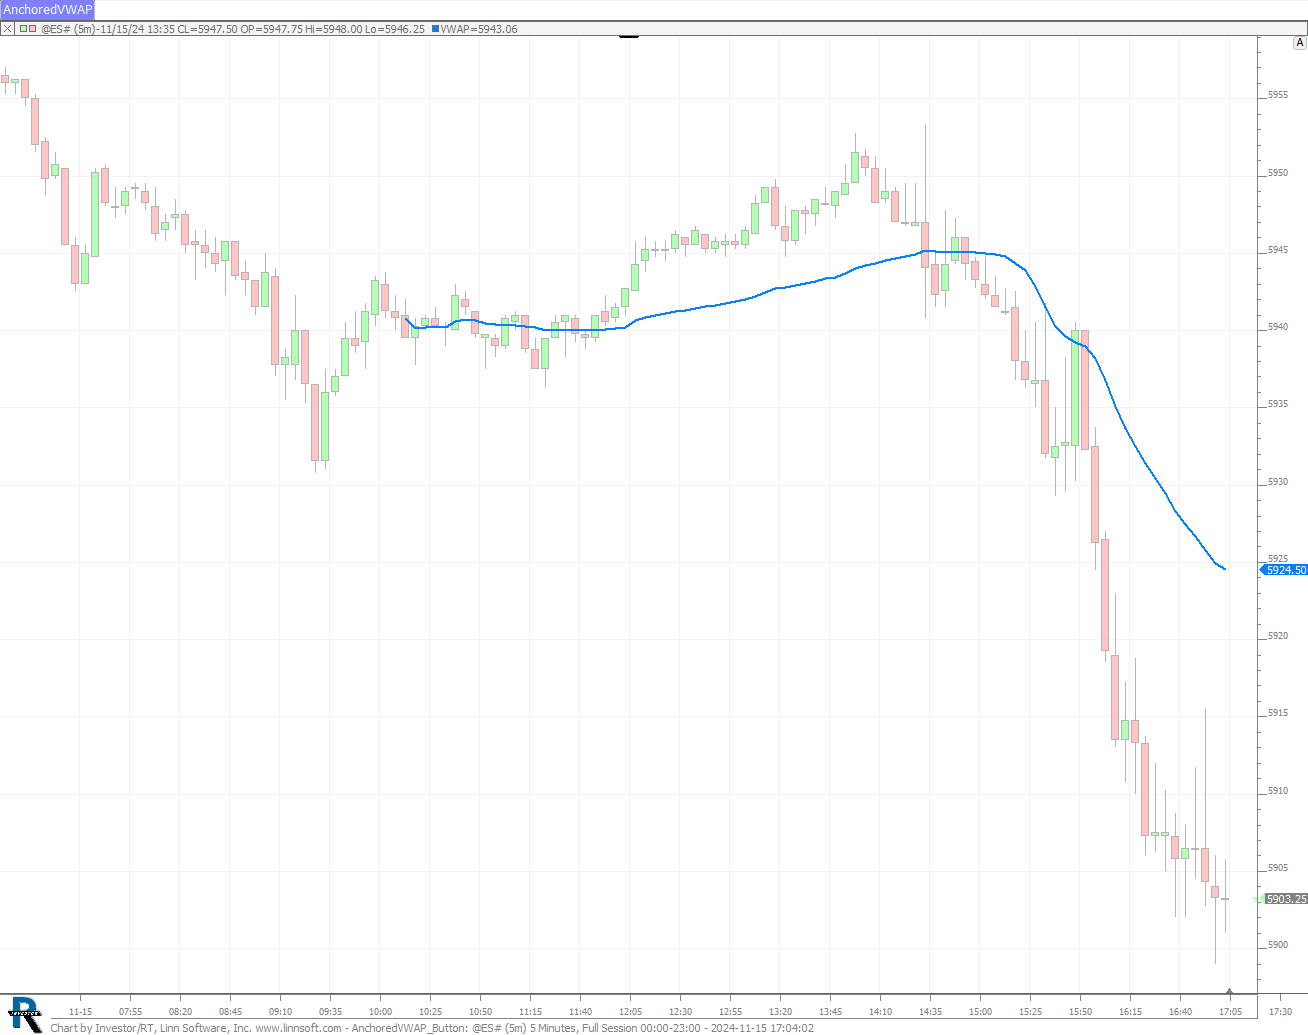 |
AnchoredVWAP Button (@ES#) Eddy [totalcount]
5 months 17 hours ago
AnchoredVWAP Button. This chart was uploaded by Investor/RT 15.2.1 showing symbol: @ES#. |
View |
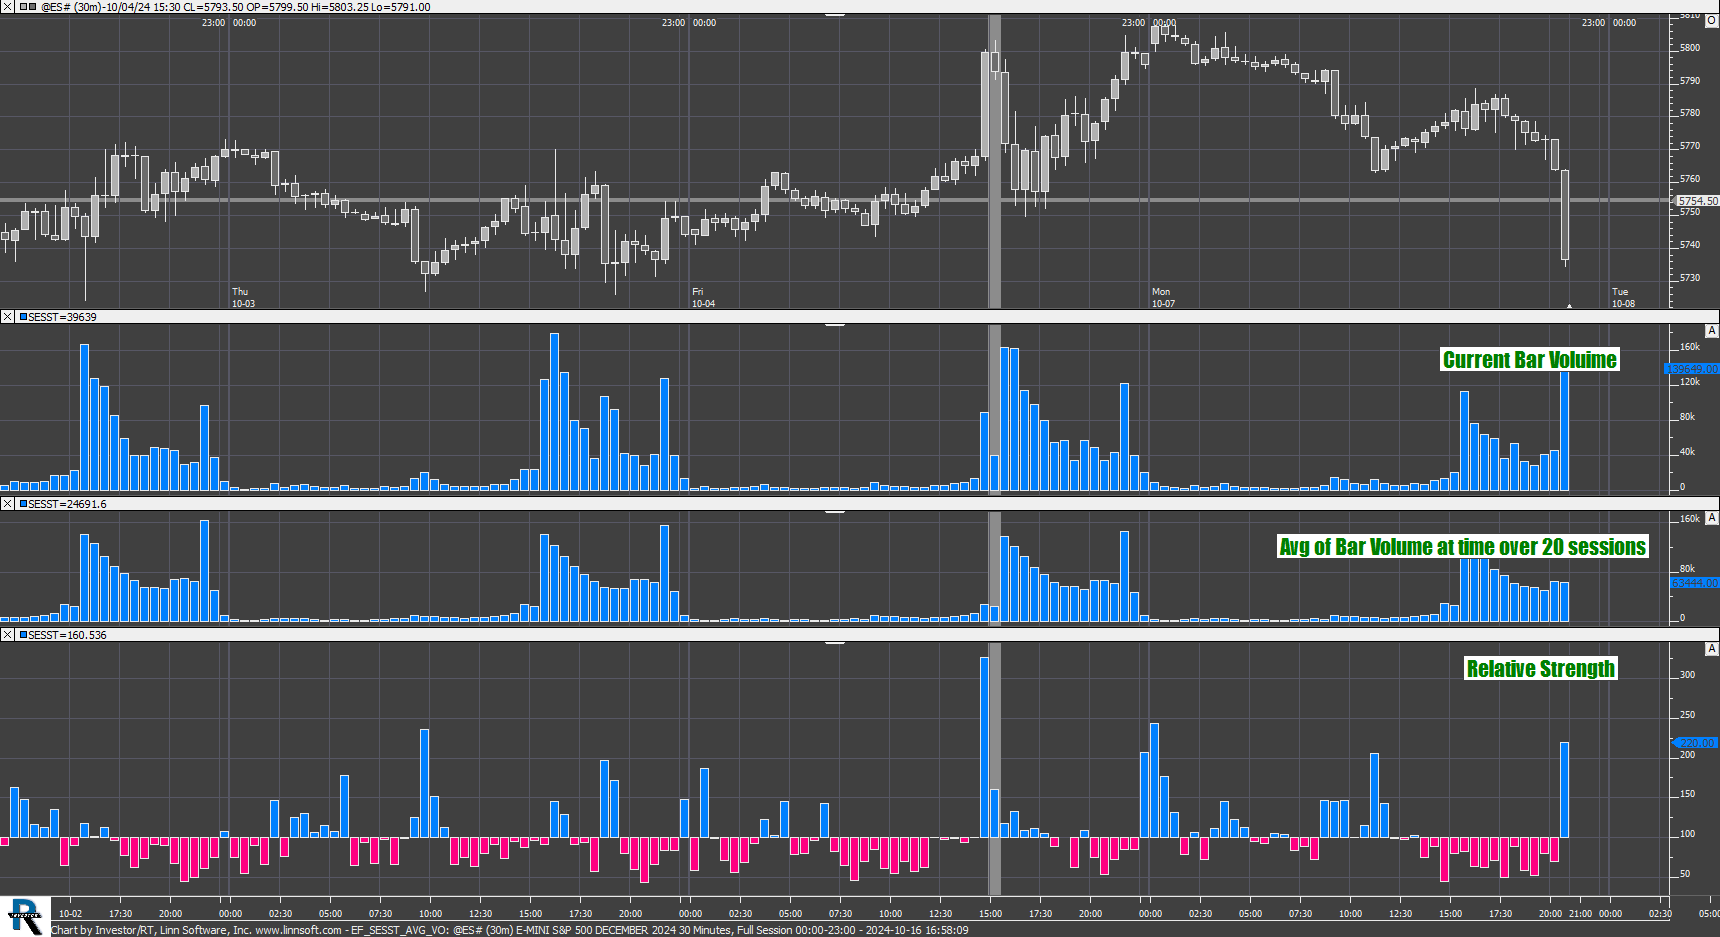 |
EF SESST AVG VO (@ES#) Eddy [totalcount]
6 months 19 hours ago
Highlighting Session Statistics feature : Relative strength (for the Avg Volume at Time). This chart was uploaded by Investor/RT 15.1.26 showing symbol: @ES#. |
View |
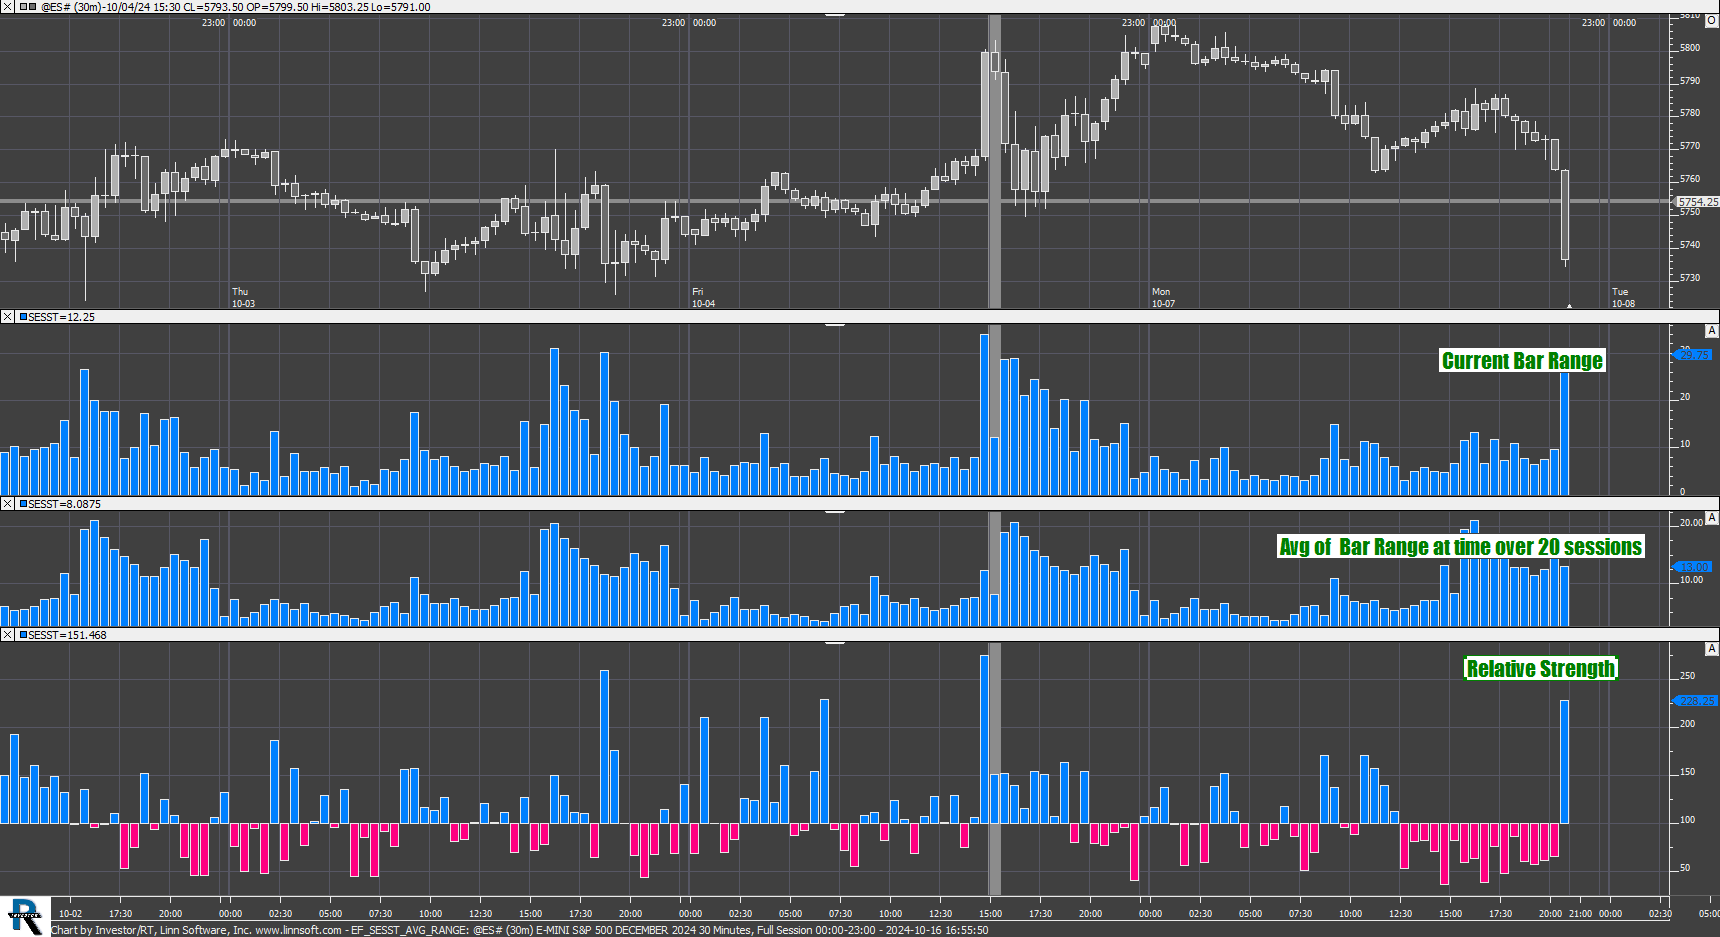 |
EF SESST AVG RANGE (@ES#) Eddy [totalcount]
6 months 19 hours ago
Highlighting Session Statistics feature : Relative strength (for the Avg Range at Time). This chart was uploaded by Investor/RT 15.1.26 showing symbol: @ES#. |
View |
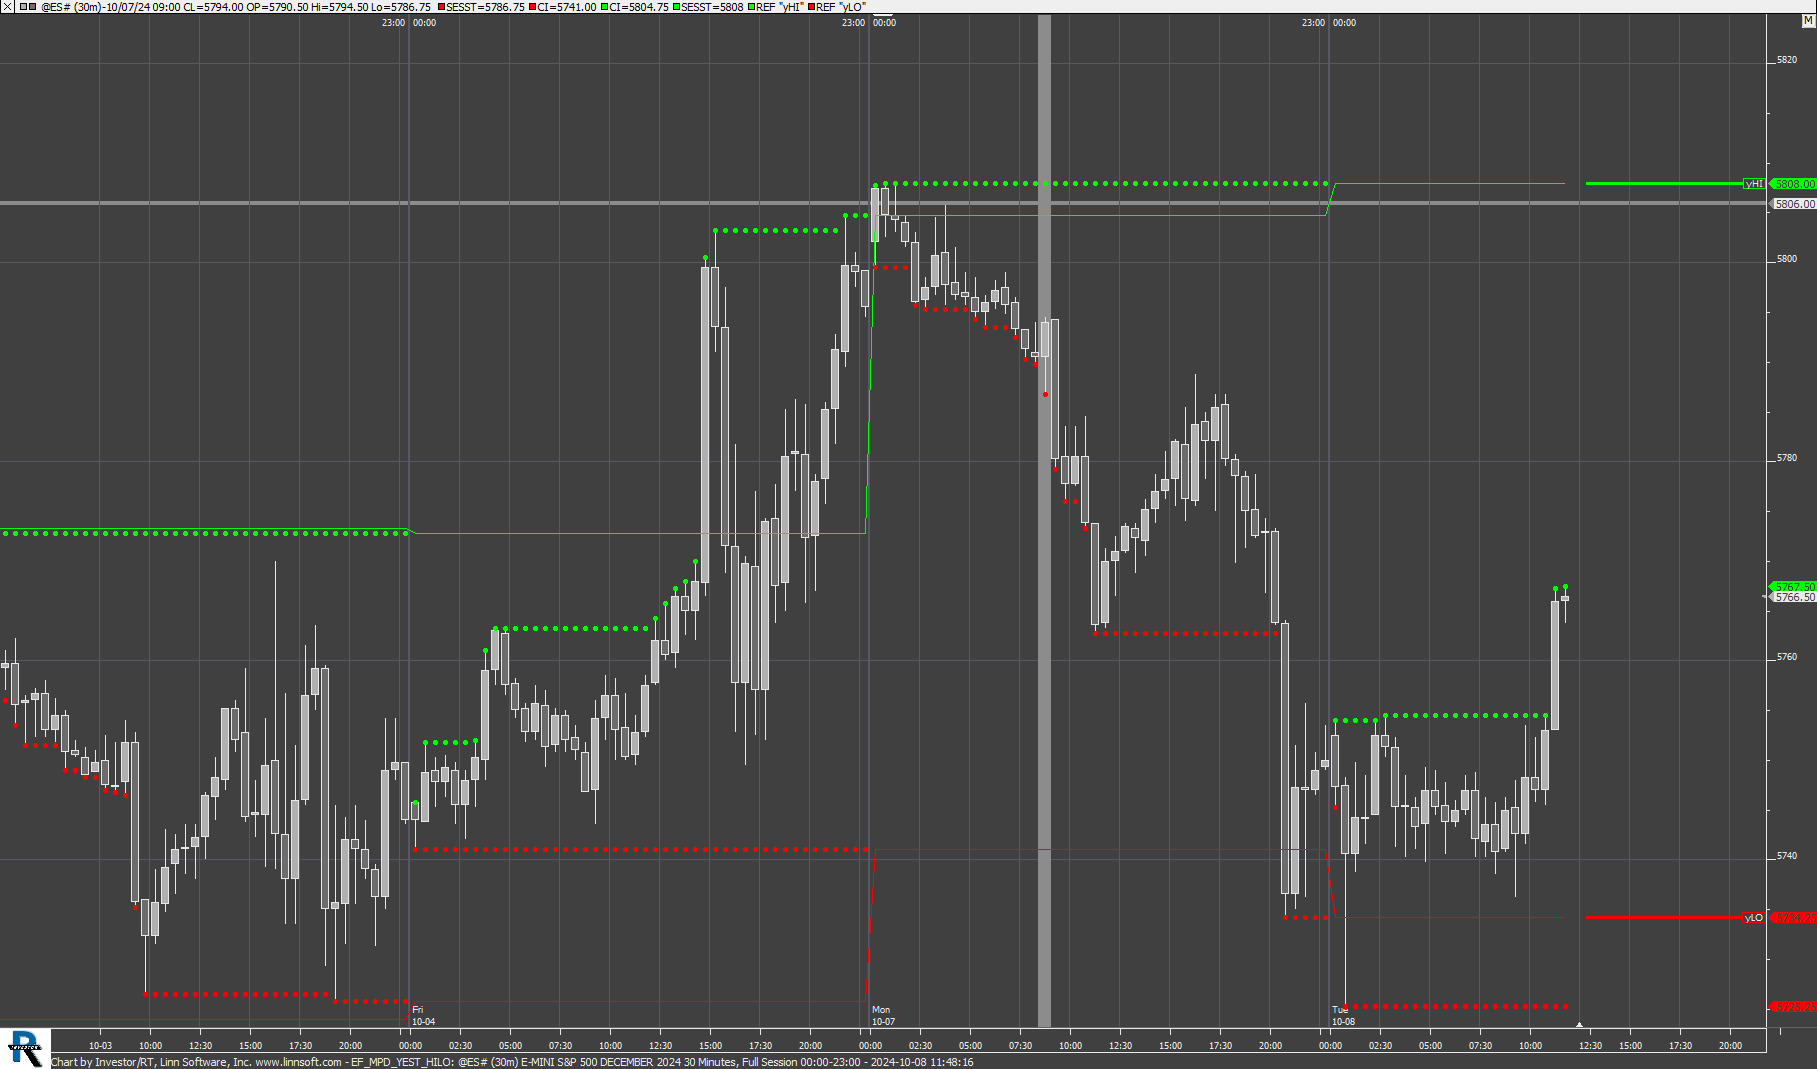 |
EF MPD YEST HILO (@ES#) Eddy [totalcount]
6 months 1 week ago
Using the MPD indicator to display the Daily High and low of the previous full session (and the SESST to display the "developing" value). |
View |
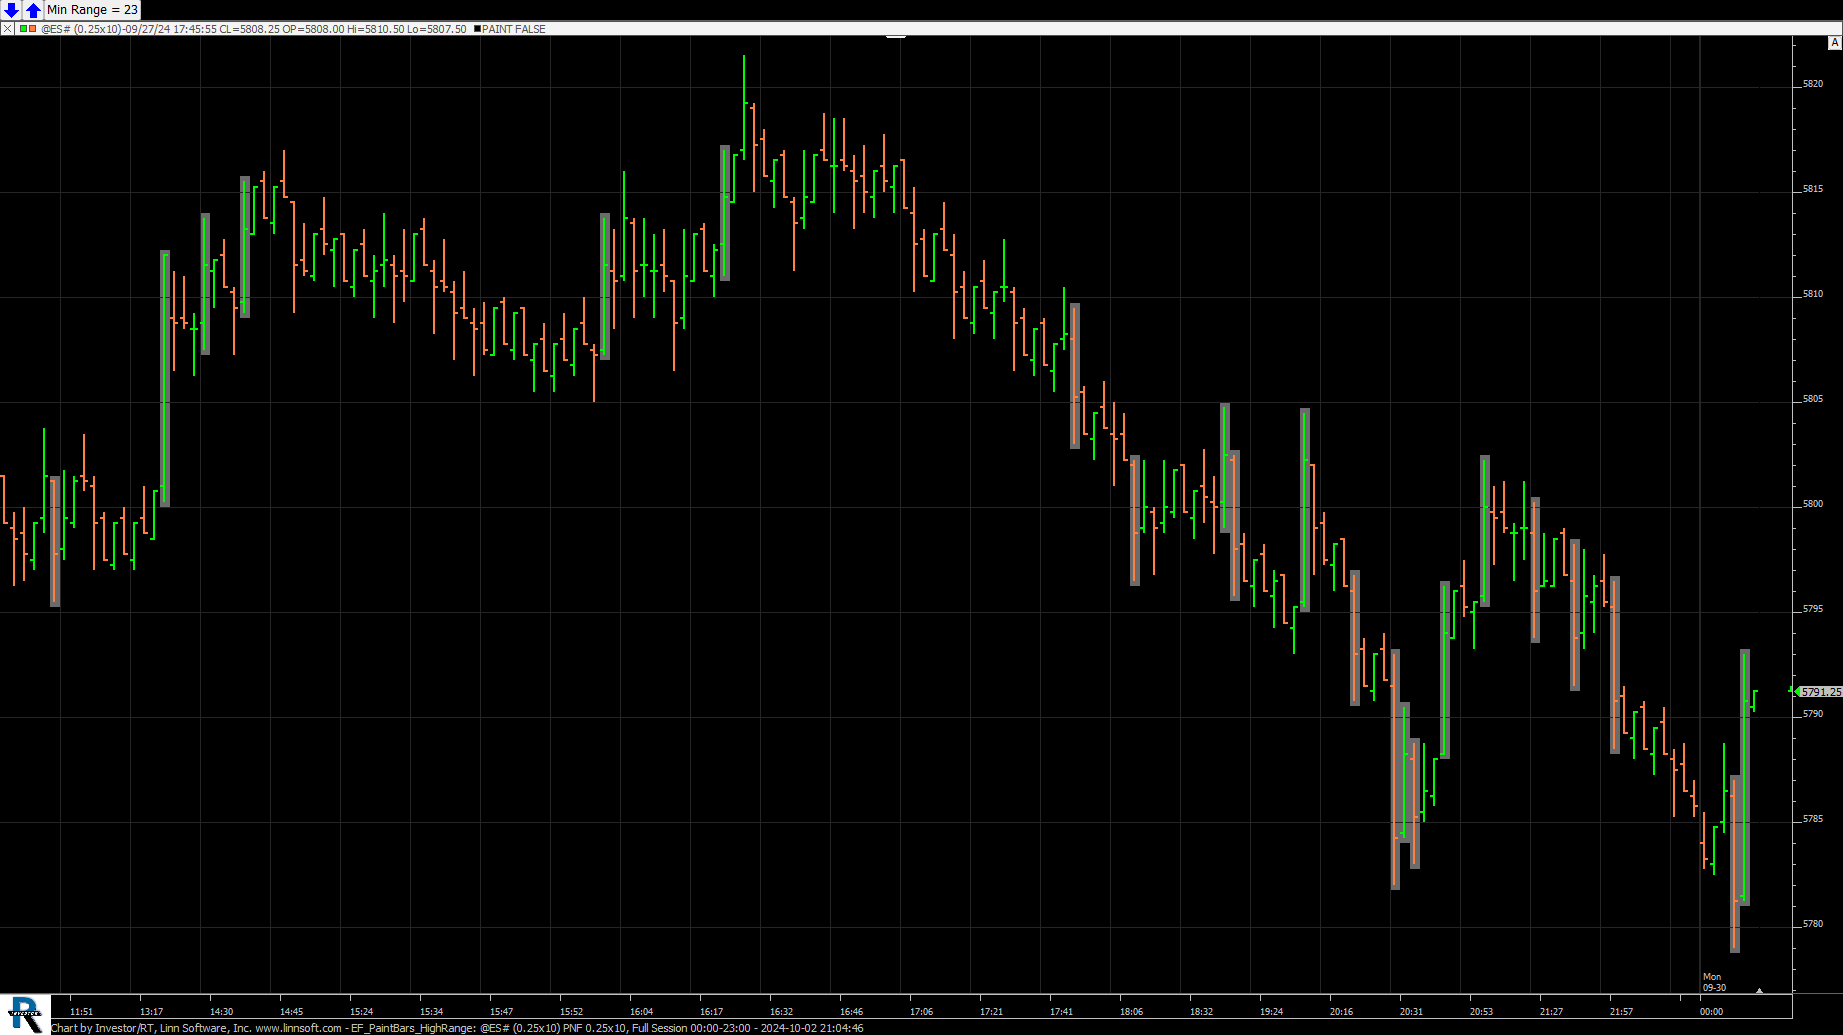 |
EF PaintBars HighRange (@ES#) Eddy [totalcount]
6 months 2 weeks ago
Paint background of bars achieving a min range (expressed as price level count) => using the HLP token. This chart was uploaded by Investor/RT 15.2.1 showing symbol: @ES#. |
View |
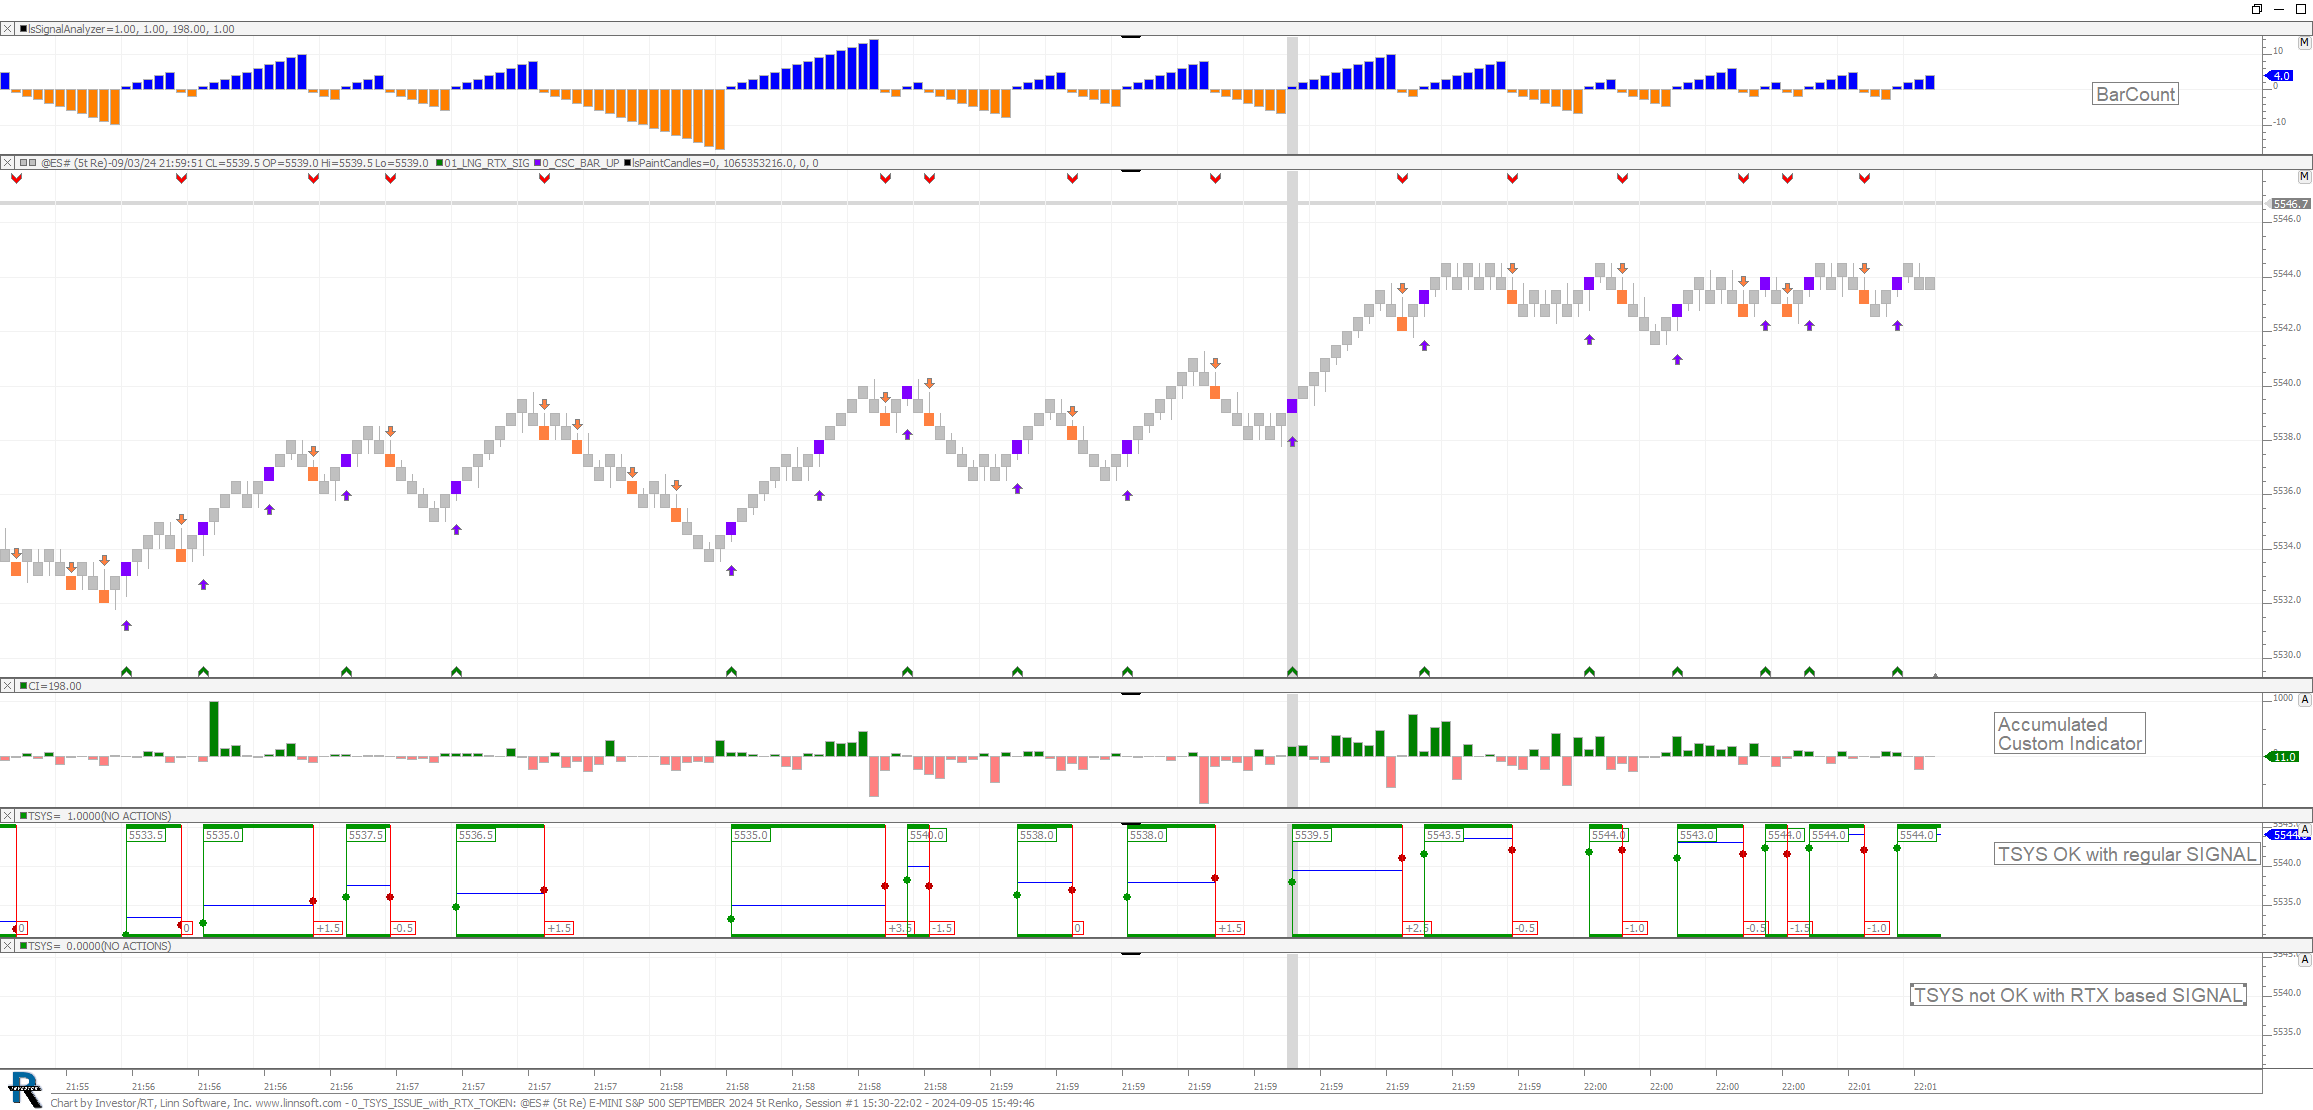 |
0 TSYS ISSUE with RTX TOKEN (@ES#) Eddy [totalcount]
7 months 1 week ago
Issue with Signal including RTX-based on Signal Analyzer token. This chart was uploaded by Investor/RT 15.1.26 showing symbol: @ES#. |
View |
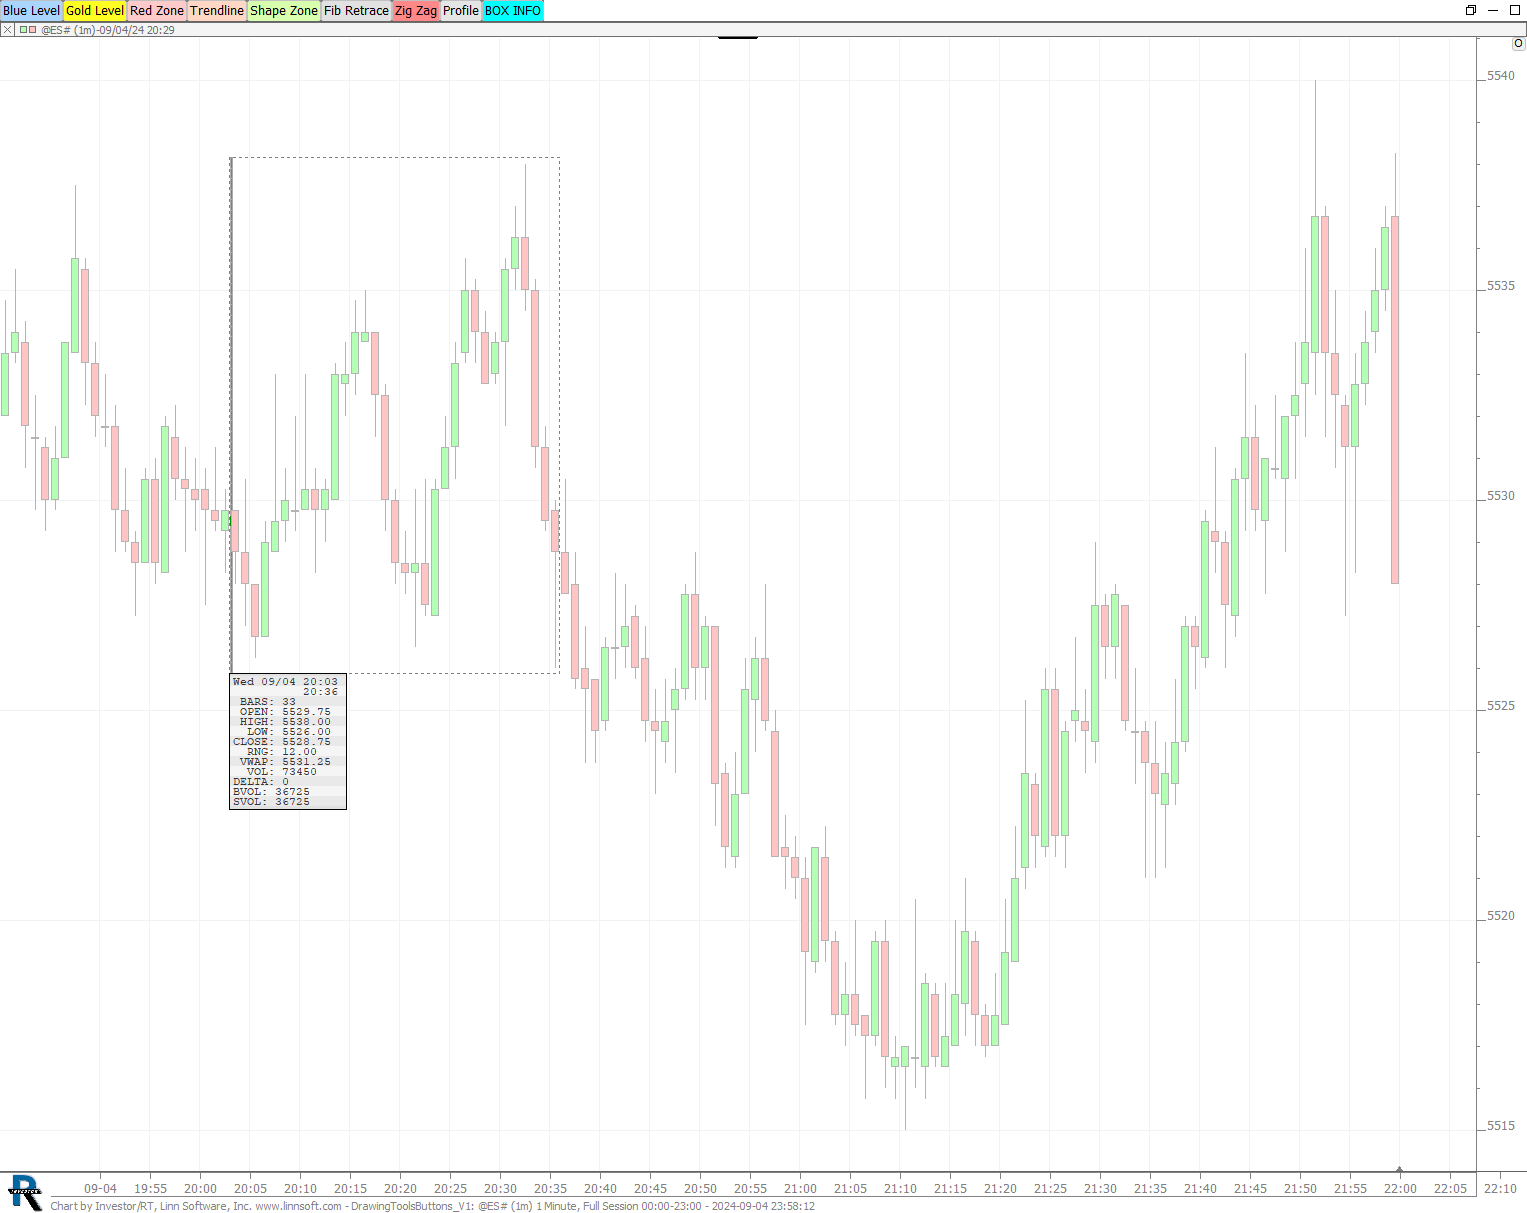 |
DrawingToolsButtons V (@ES#) Eddy [totalcount]
7 months 1 week ago
Using the Draw custom Profile button to generate informztion over a boxed area (Light Blue Button). This chart was uploaded by Investor/RT 15.1.26 showing symbol: @ES#. |
View |
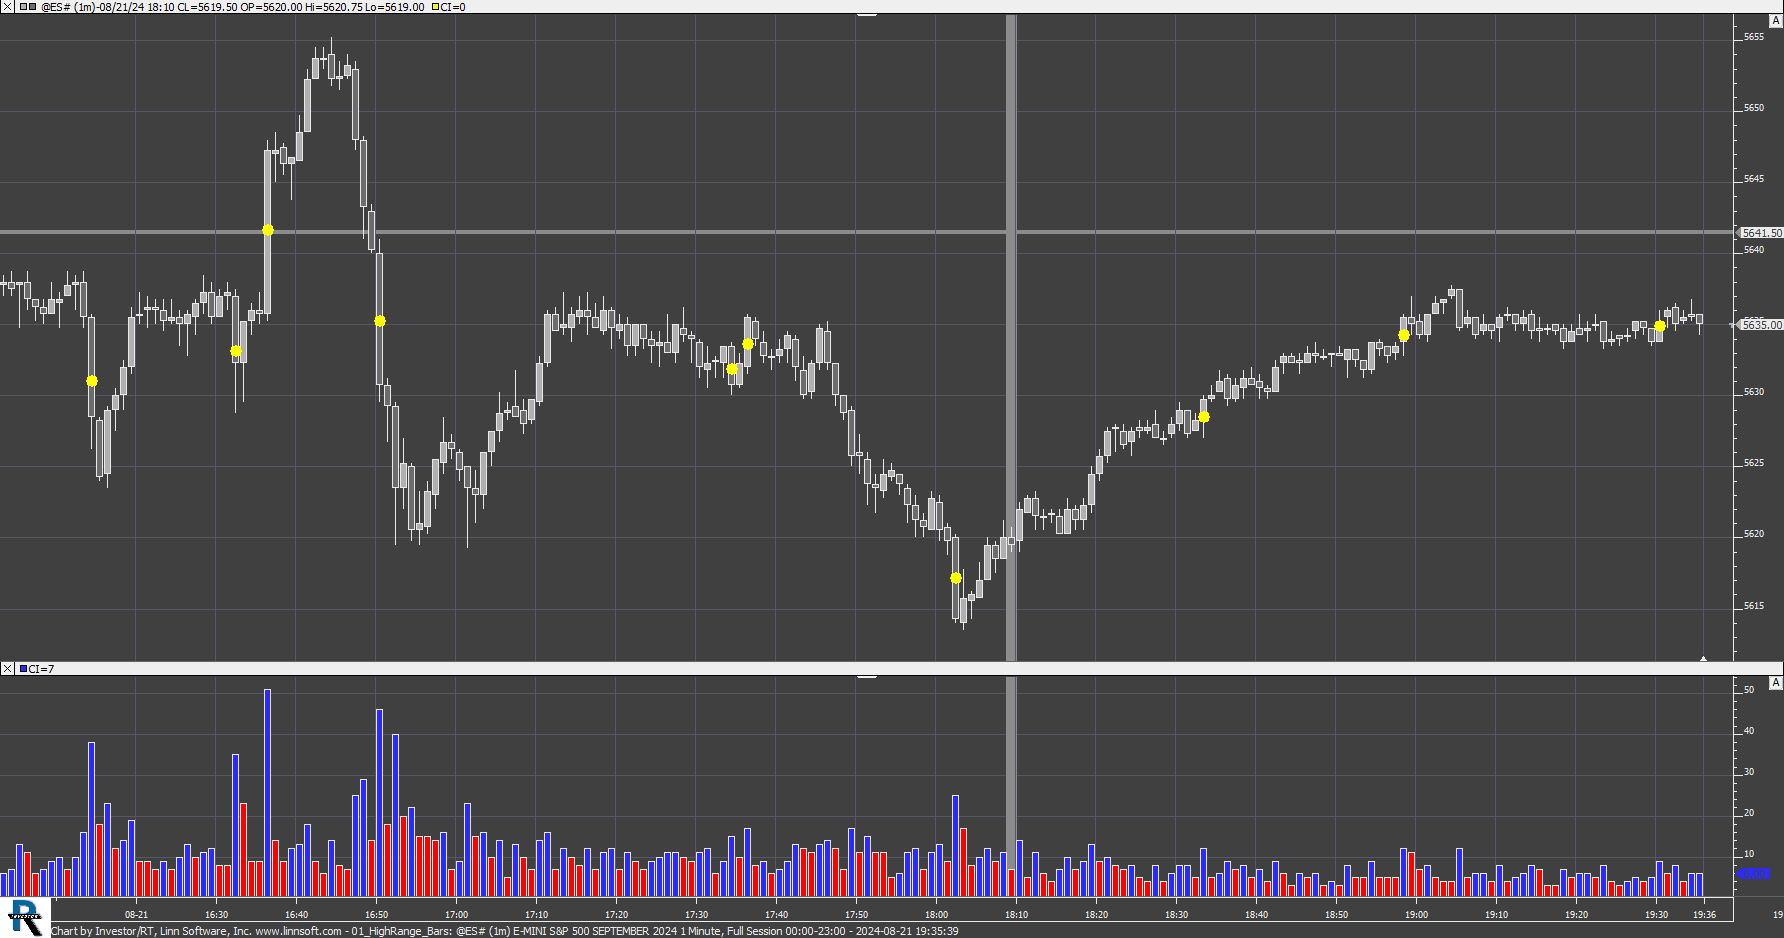 |
01 HighRange Bars (@ES#) Eddy [totalcount]
7 months 3 weeks ago
Display a Dot on the medium point of a Candlestick when the high low range of the current bar is the widest compared to the previous 13 bar. |
View |
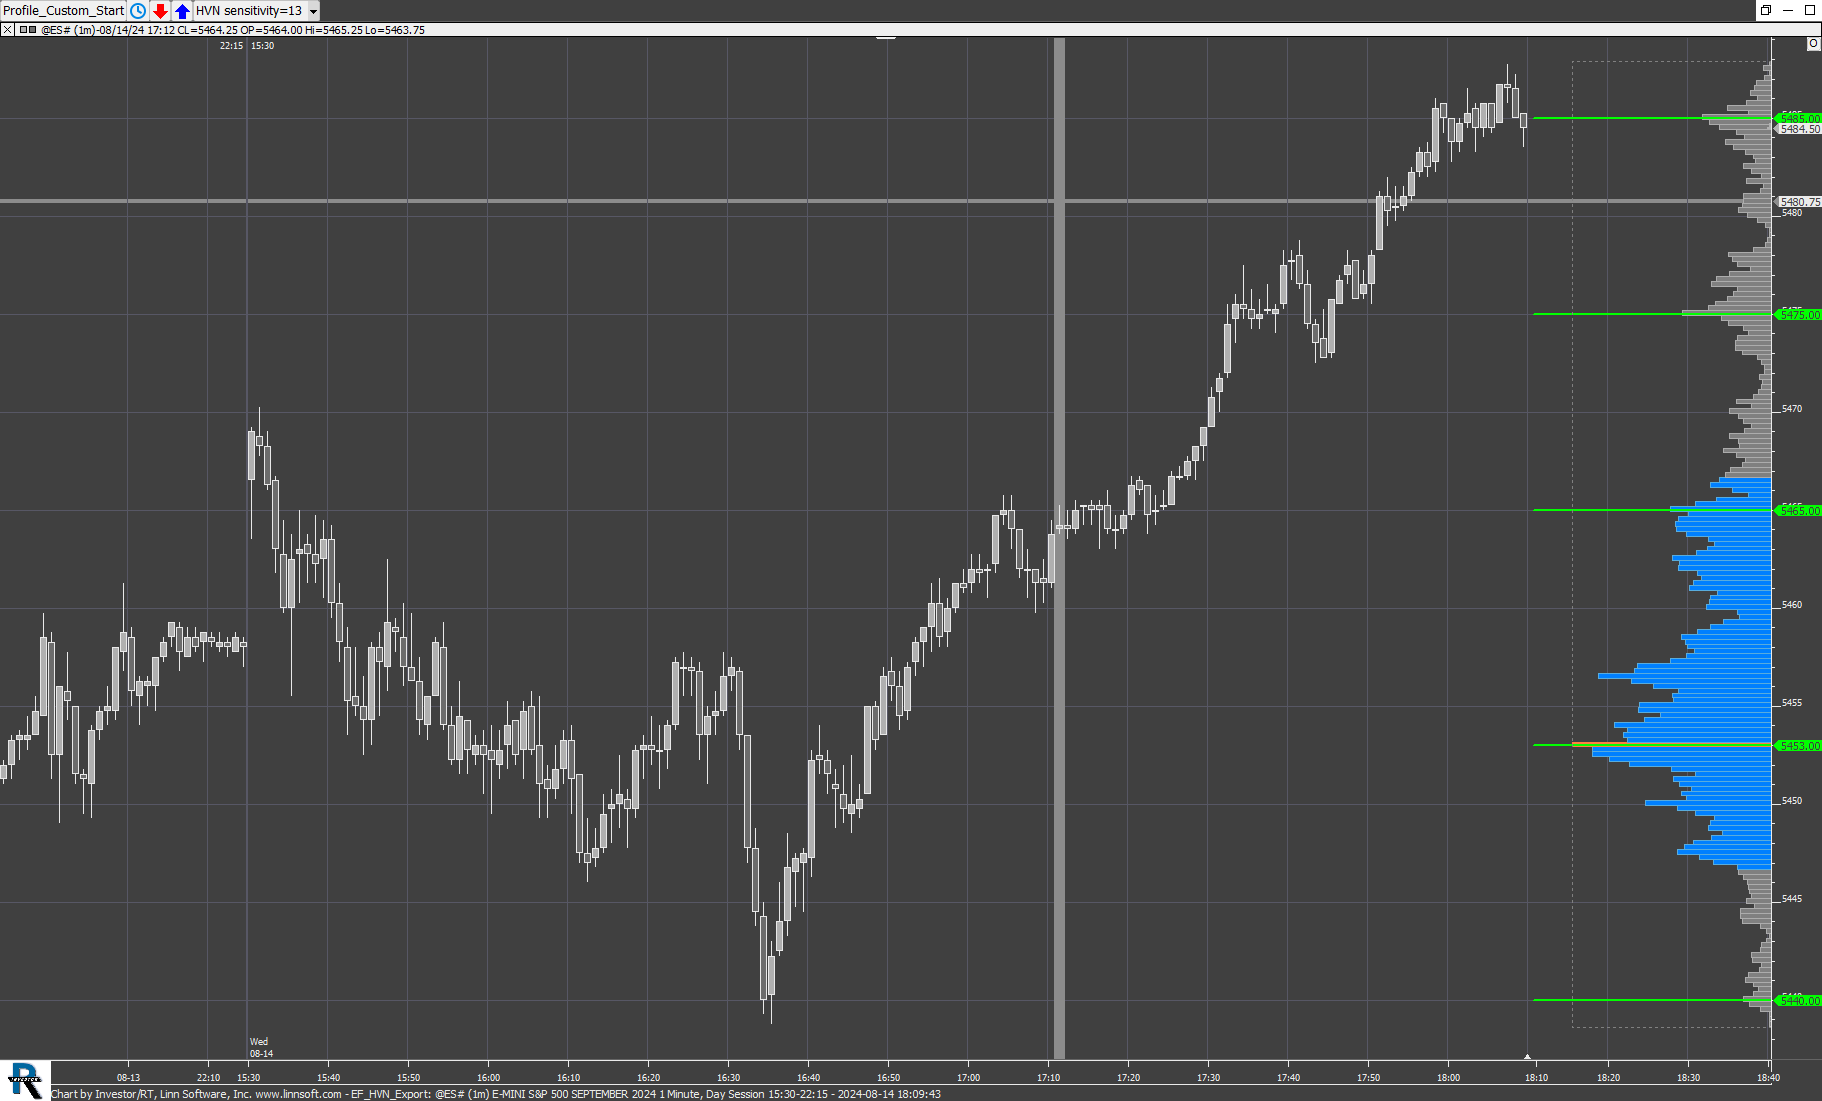 |
EF HVN Export (@ES#) Eddy [totalcount]
8 months 3 days ago
HVN value Export with Sensitivity controlled through a C variable. This chart was uploaded by Investor/RT 15.1.26 showing symbol: @ES#. |
View |
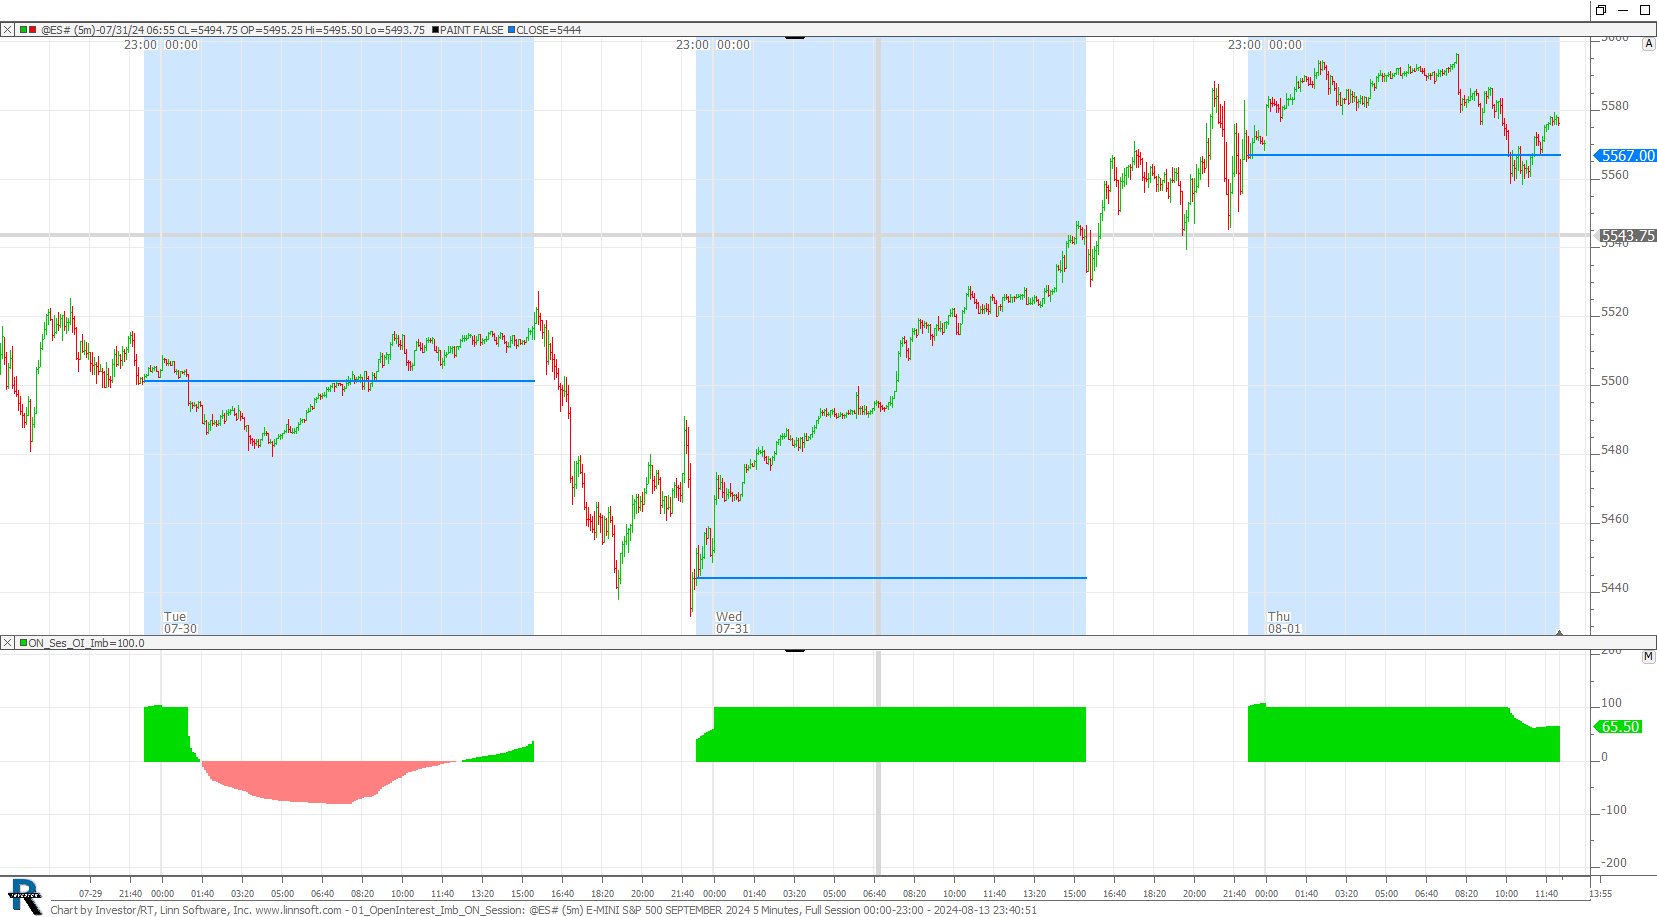 |
01 OpenInterest Imb ON Session (@ES#) Eddy [totalcount]
8 months 4 days ago
Overnight Open Interest imbalance. This chart was uploaded by Investor/RT 15.1.26 showing symbol: @ES#. |
View |
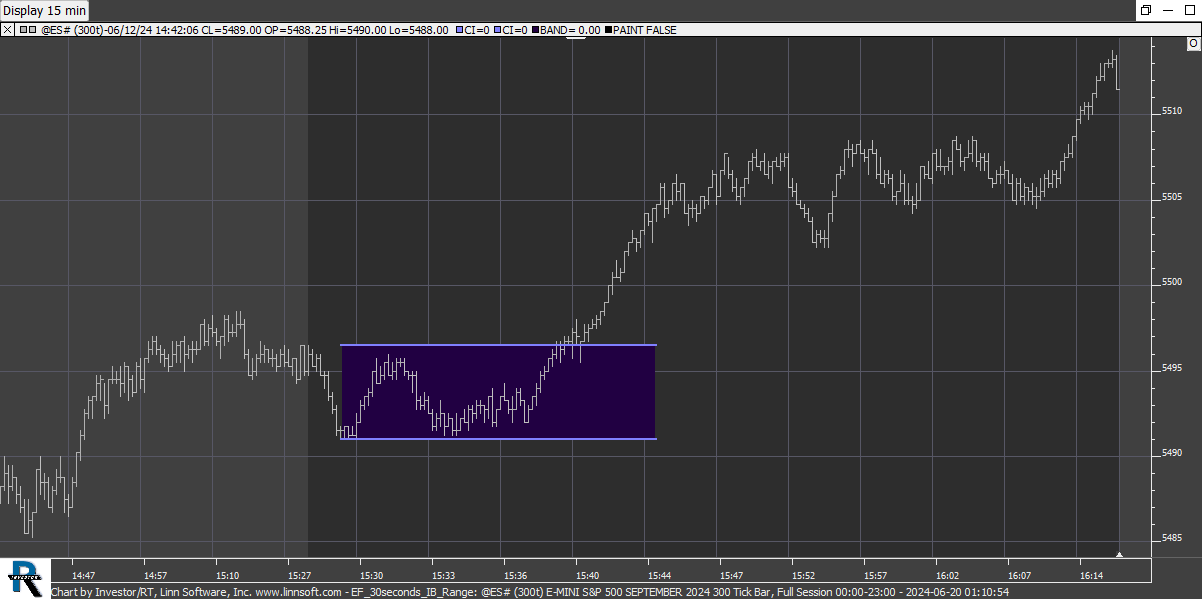 |
EF 30seconds IB Range (@ES#) Eddy [totalcount]
9 months 4 weeks ago
Creating a custom indicator (using the MPD, Signal Statistics and Positions tokens) to display a 30 second IB range band on a full session 300 tick ES charts. |
View |
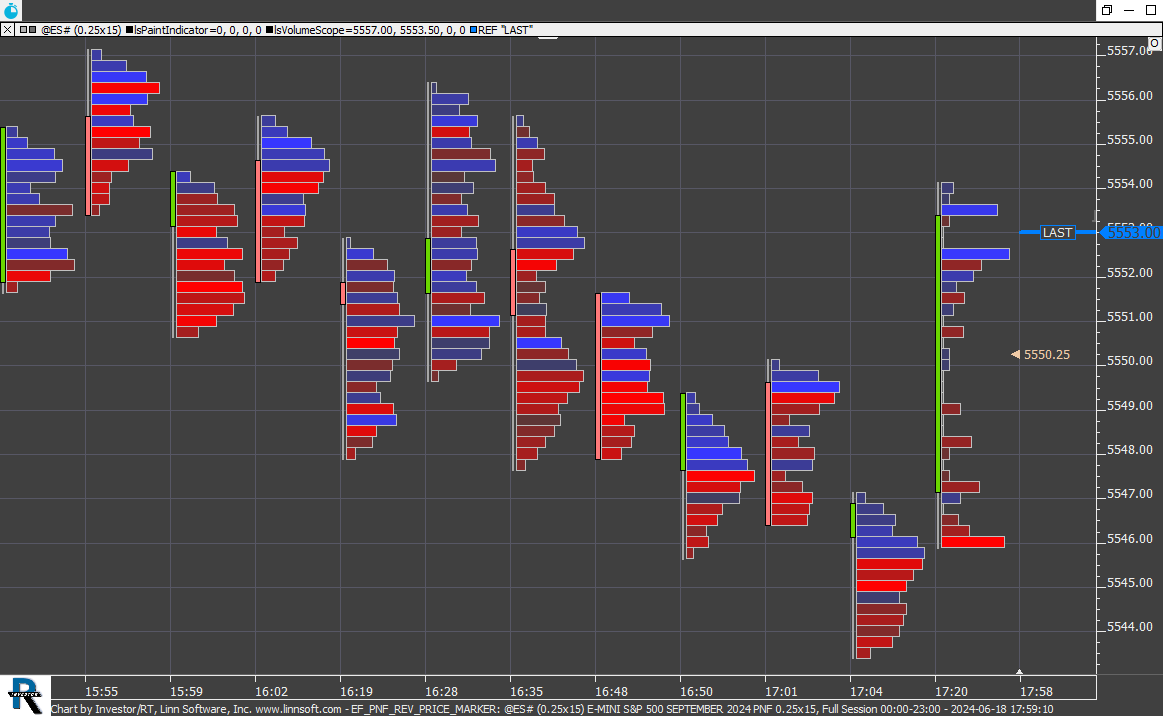 |
EF PNF REV PRICE MARKER (@ES#) Eddy [totalcount]
10 months 18 hours ago
Using the PaintIndicator to create a marker indicating the PNF Reversal Price on a miultipane chart. This chart was uploaded by Investor/RT 15.1.26 showing symbol: @ES#. |
View |
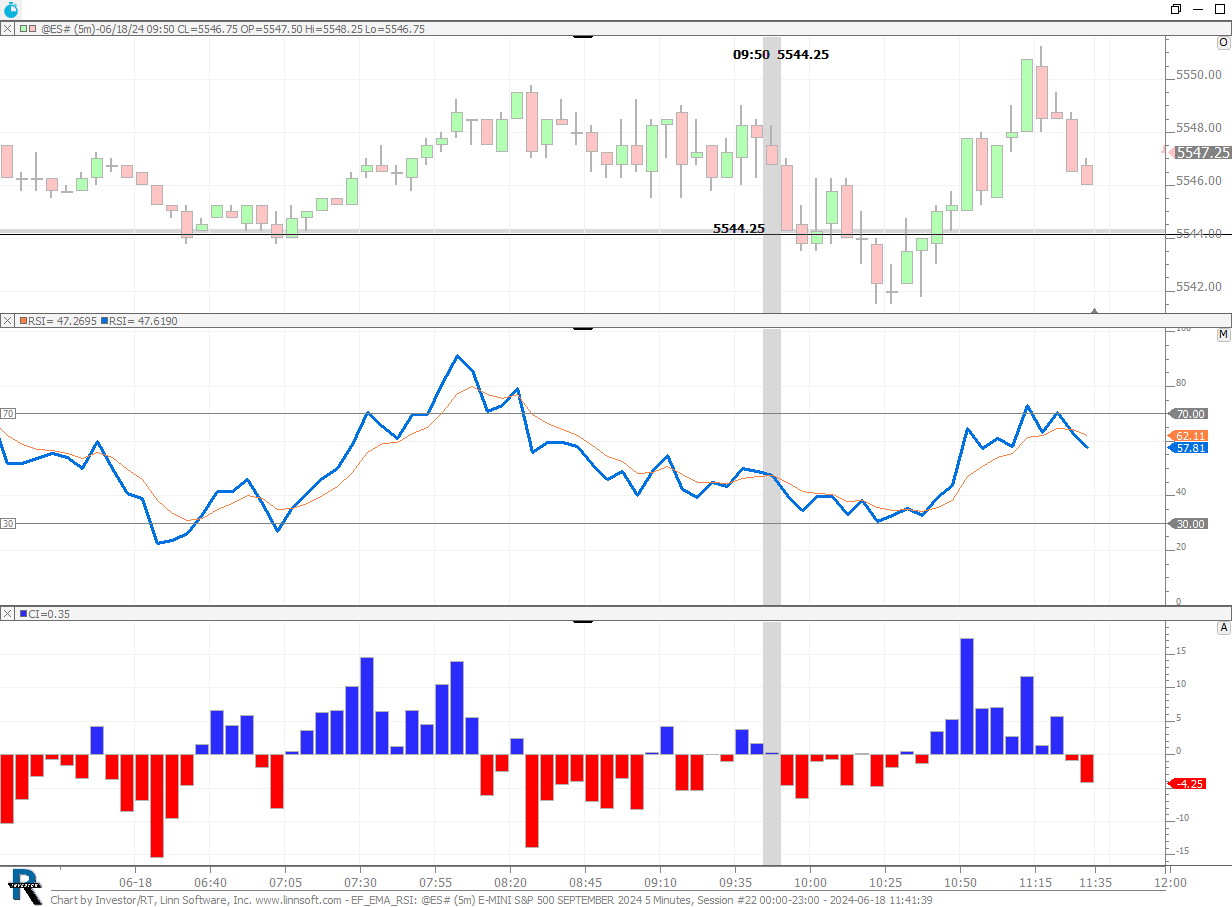 |
EF EMA RSI (@ES#) Eddy [totalcount]
10 months 1 day ago
Smoothing an RSI (applying an 5 EMA to a 12 bar RSI) - The custom indicator calculates the difference. This chart was uploaded by Investor/RT 15.1.26 showing symbol: @ES#. |
View |
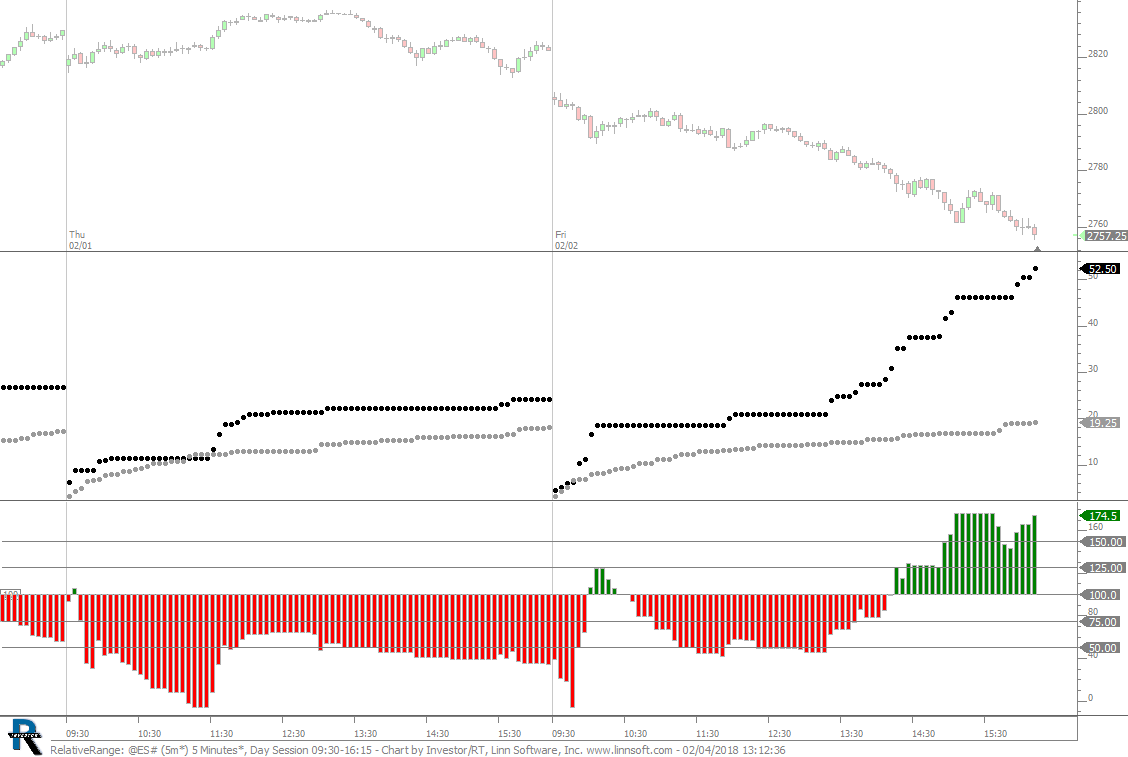 |
RelativeRange (@ES#) cpayne [totalcount]
7 years 2 months ago
Relative Session Range . This chart was uploaded by Investor/RT 12.6.1 showing symbol: @ES#. |
View |
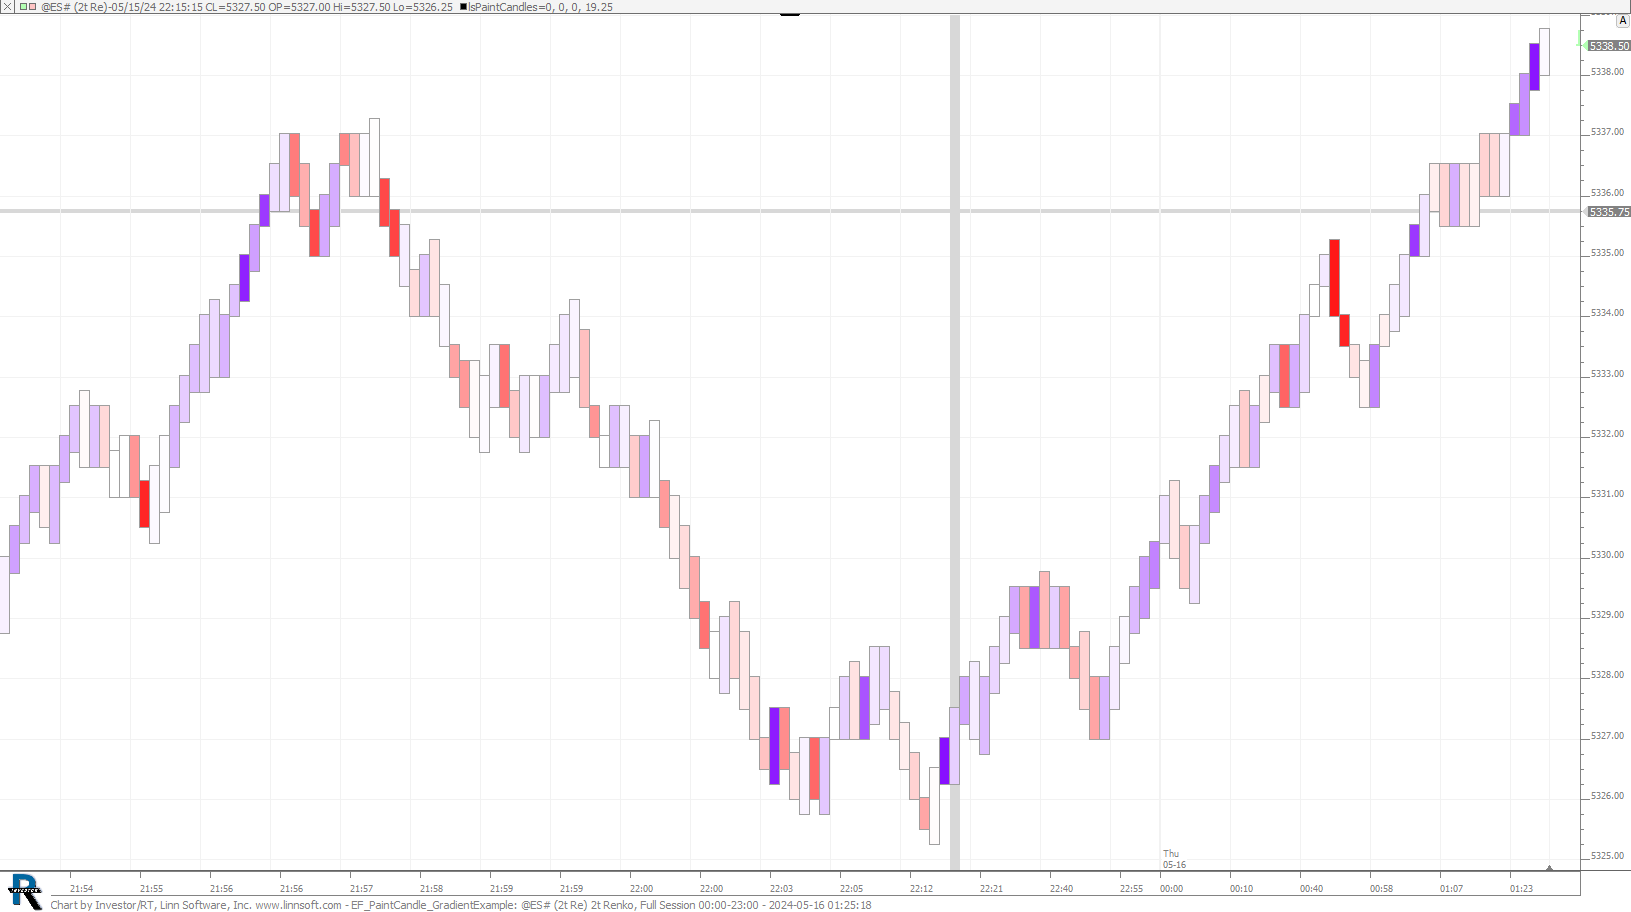 |
EF PaintCandle GradientExample (@ES#) Eddy [totalcount]
11 months 4 days ago
Showcasing PaintCandles Gradient coloring feature. This chart was uploaded by Investor/RT 15.1.26 showing symbol: @ES#. |
View |
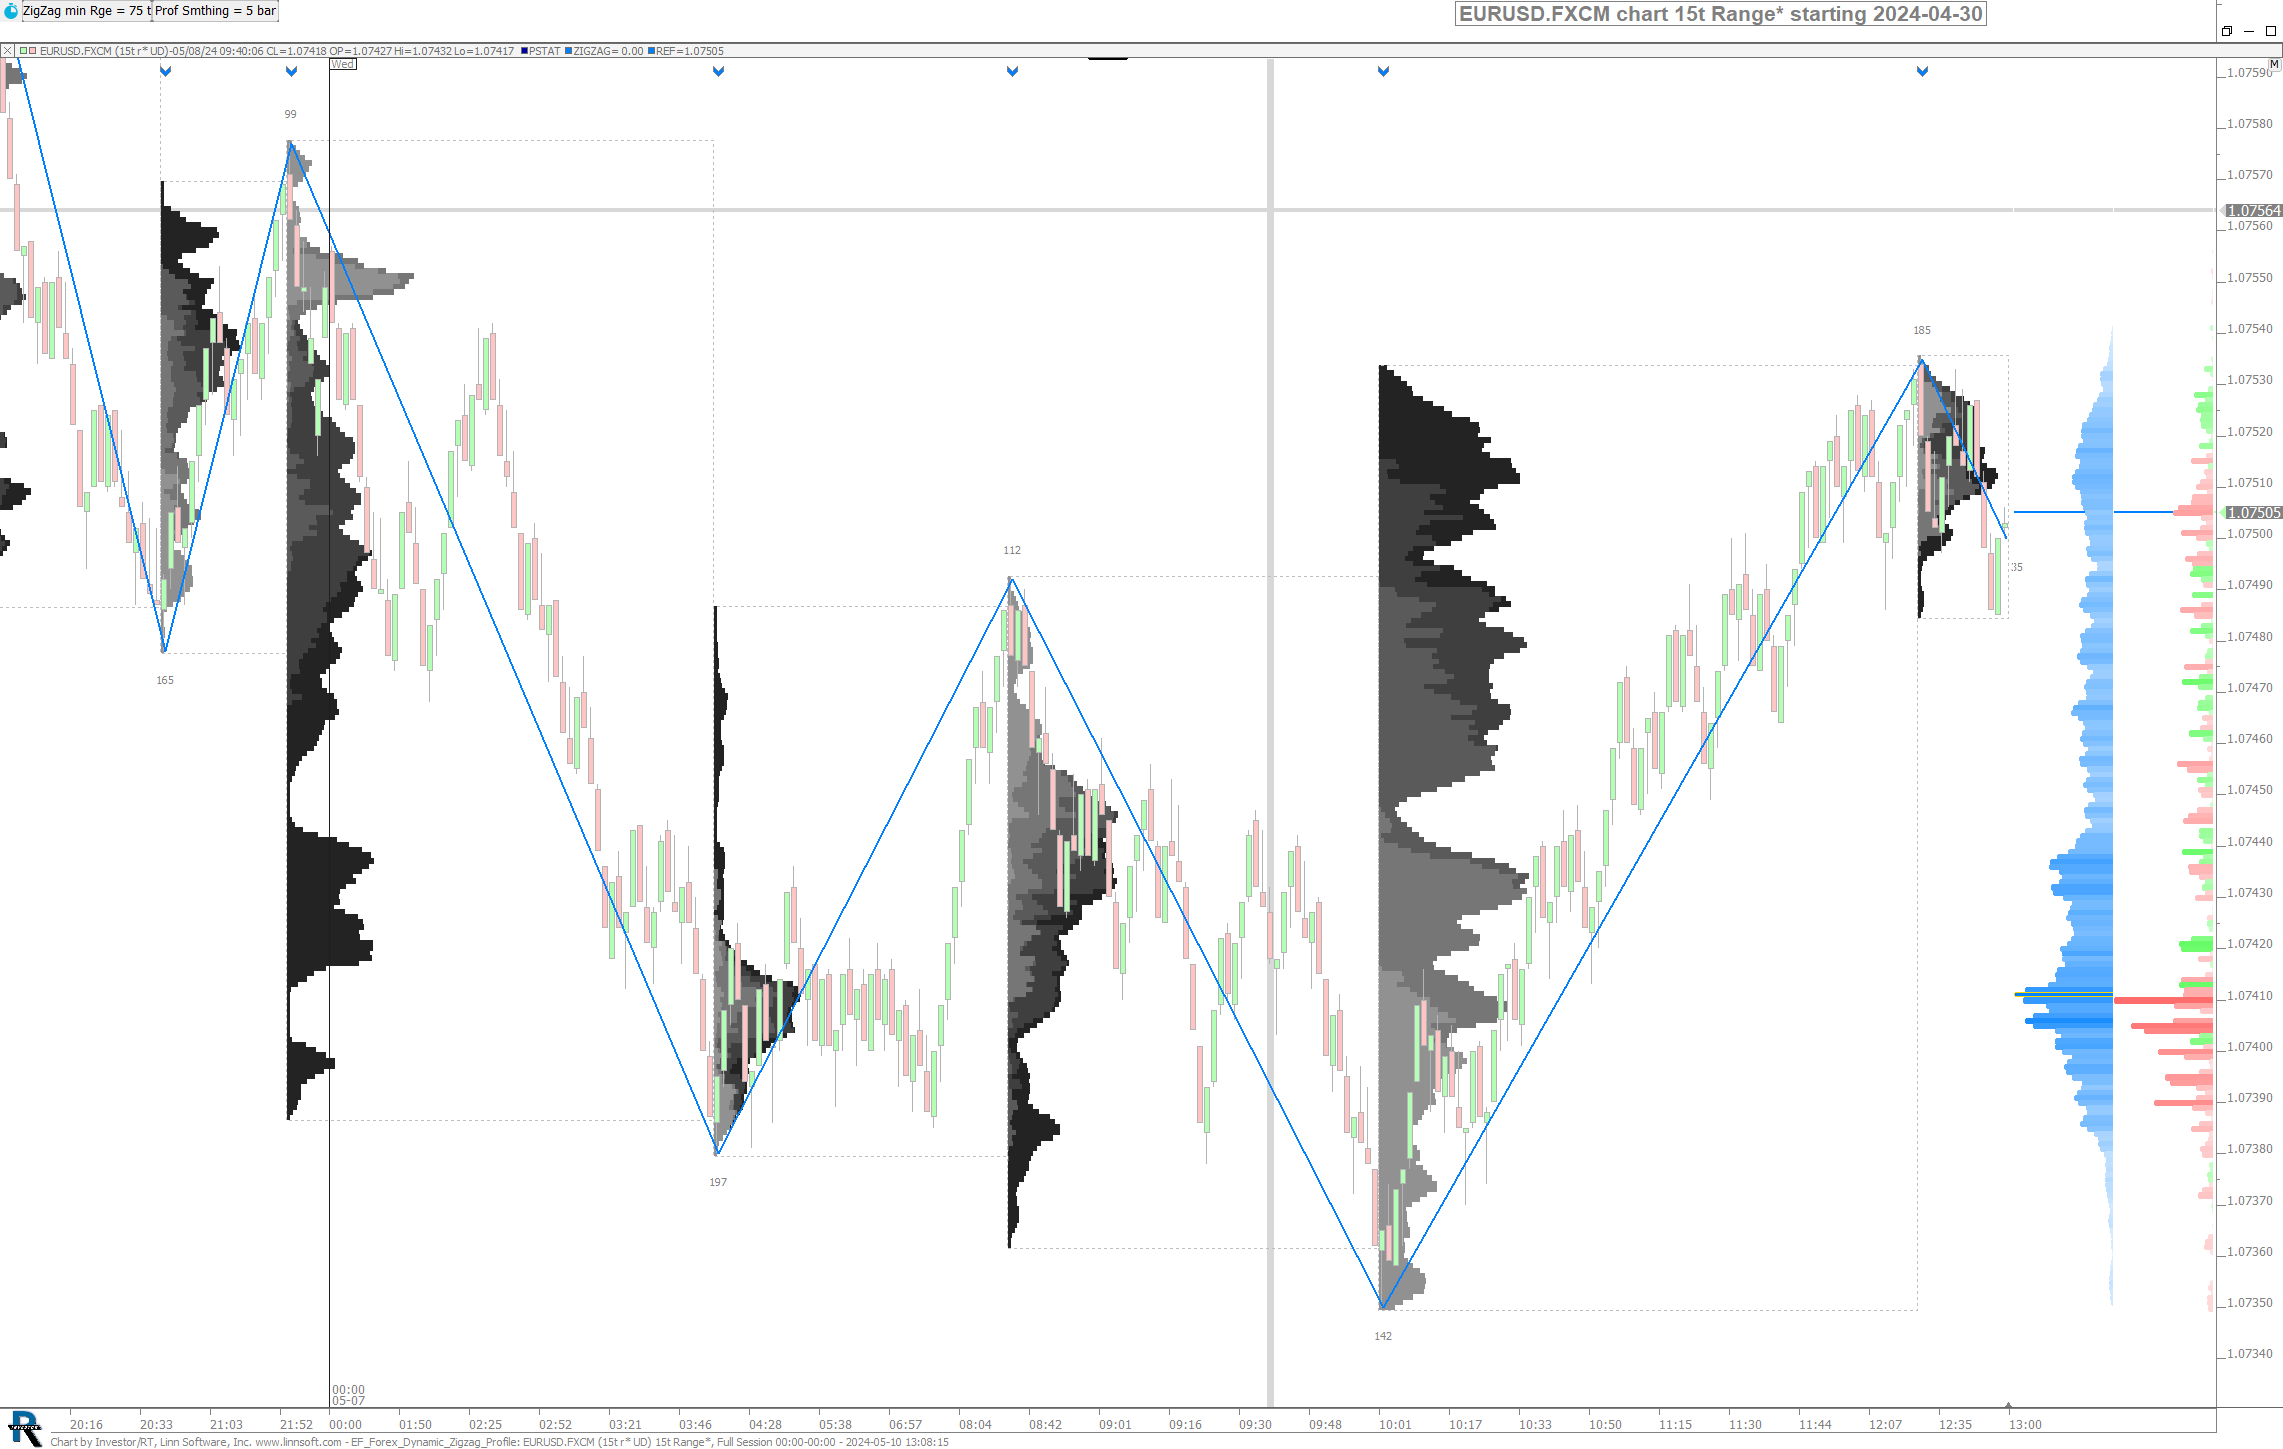 |
EF Forex Dynamic Zigzag Profile (EURUSD.FXCM) Eddy [totalcount]
11 months 1 week ago
Dynamic ZigZag profiles applied to Forex symbols. This chart was uploaded by Investor/RT 15.1.26 showing symbol: EURUSD.FXCM. |
View |
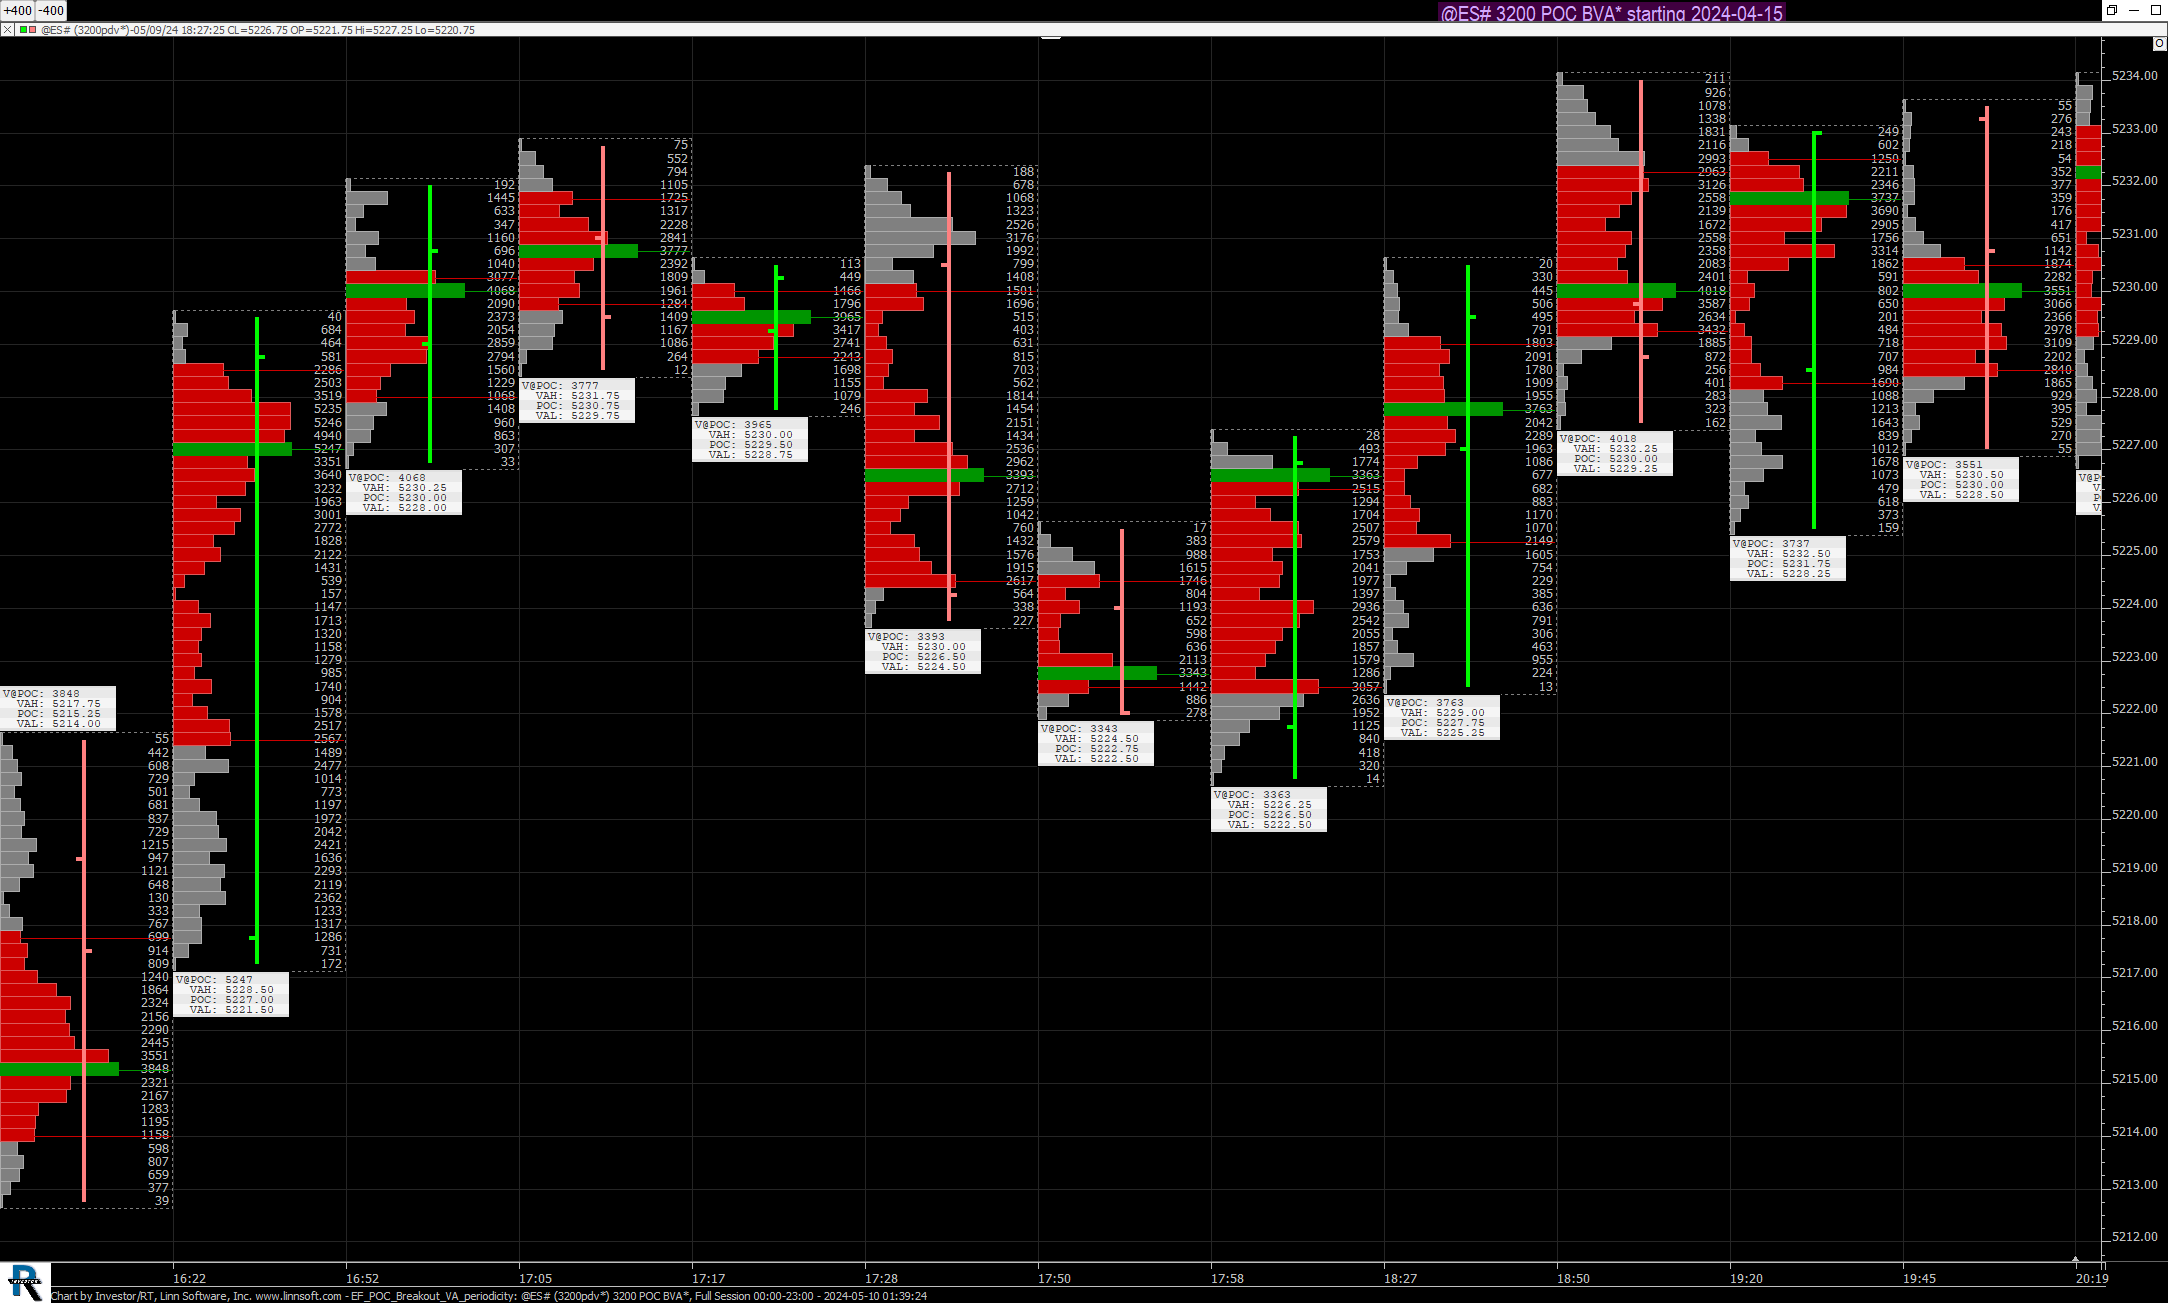 |
EF POC Breakout VA periodicity (@ES#) Eddy [totalcount]
11 months 1 week ago
Showcasing the POC Breakout VA periodicity. This chart was uploaded by Investor/RT 15.1.26 showing symbol: @ES#. |
View |
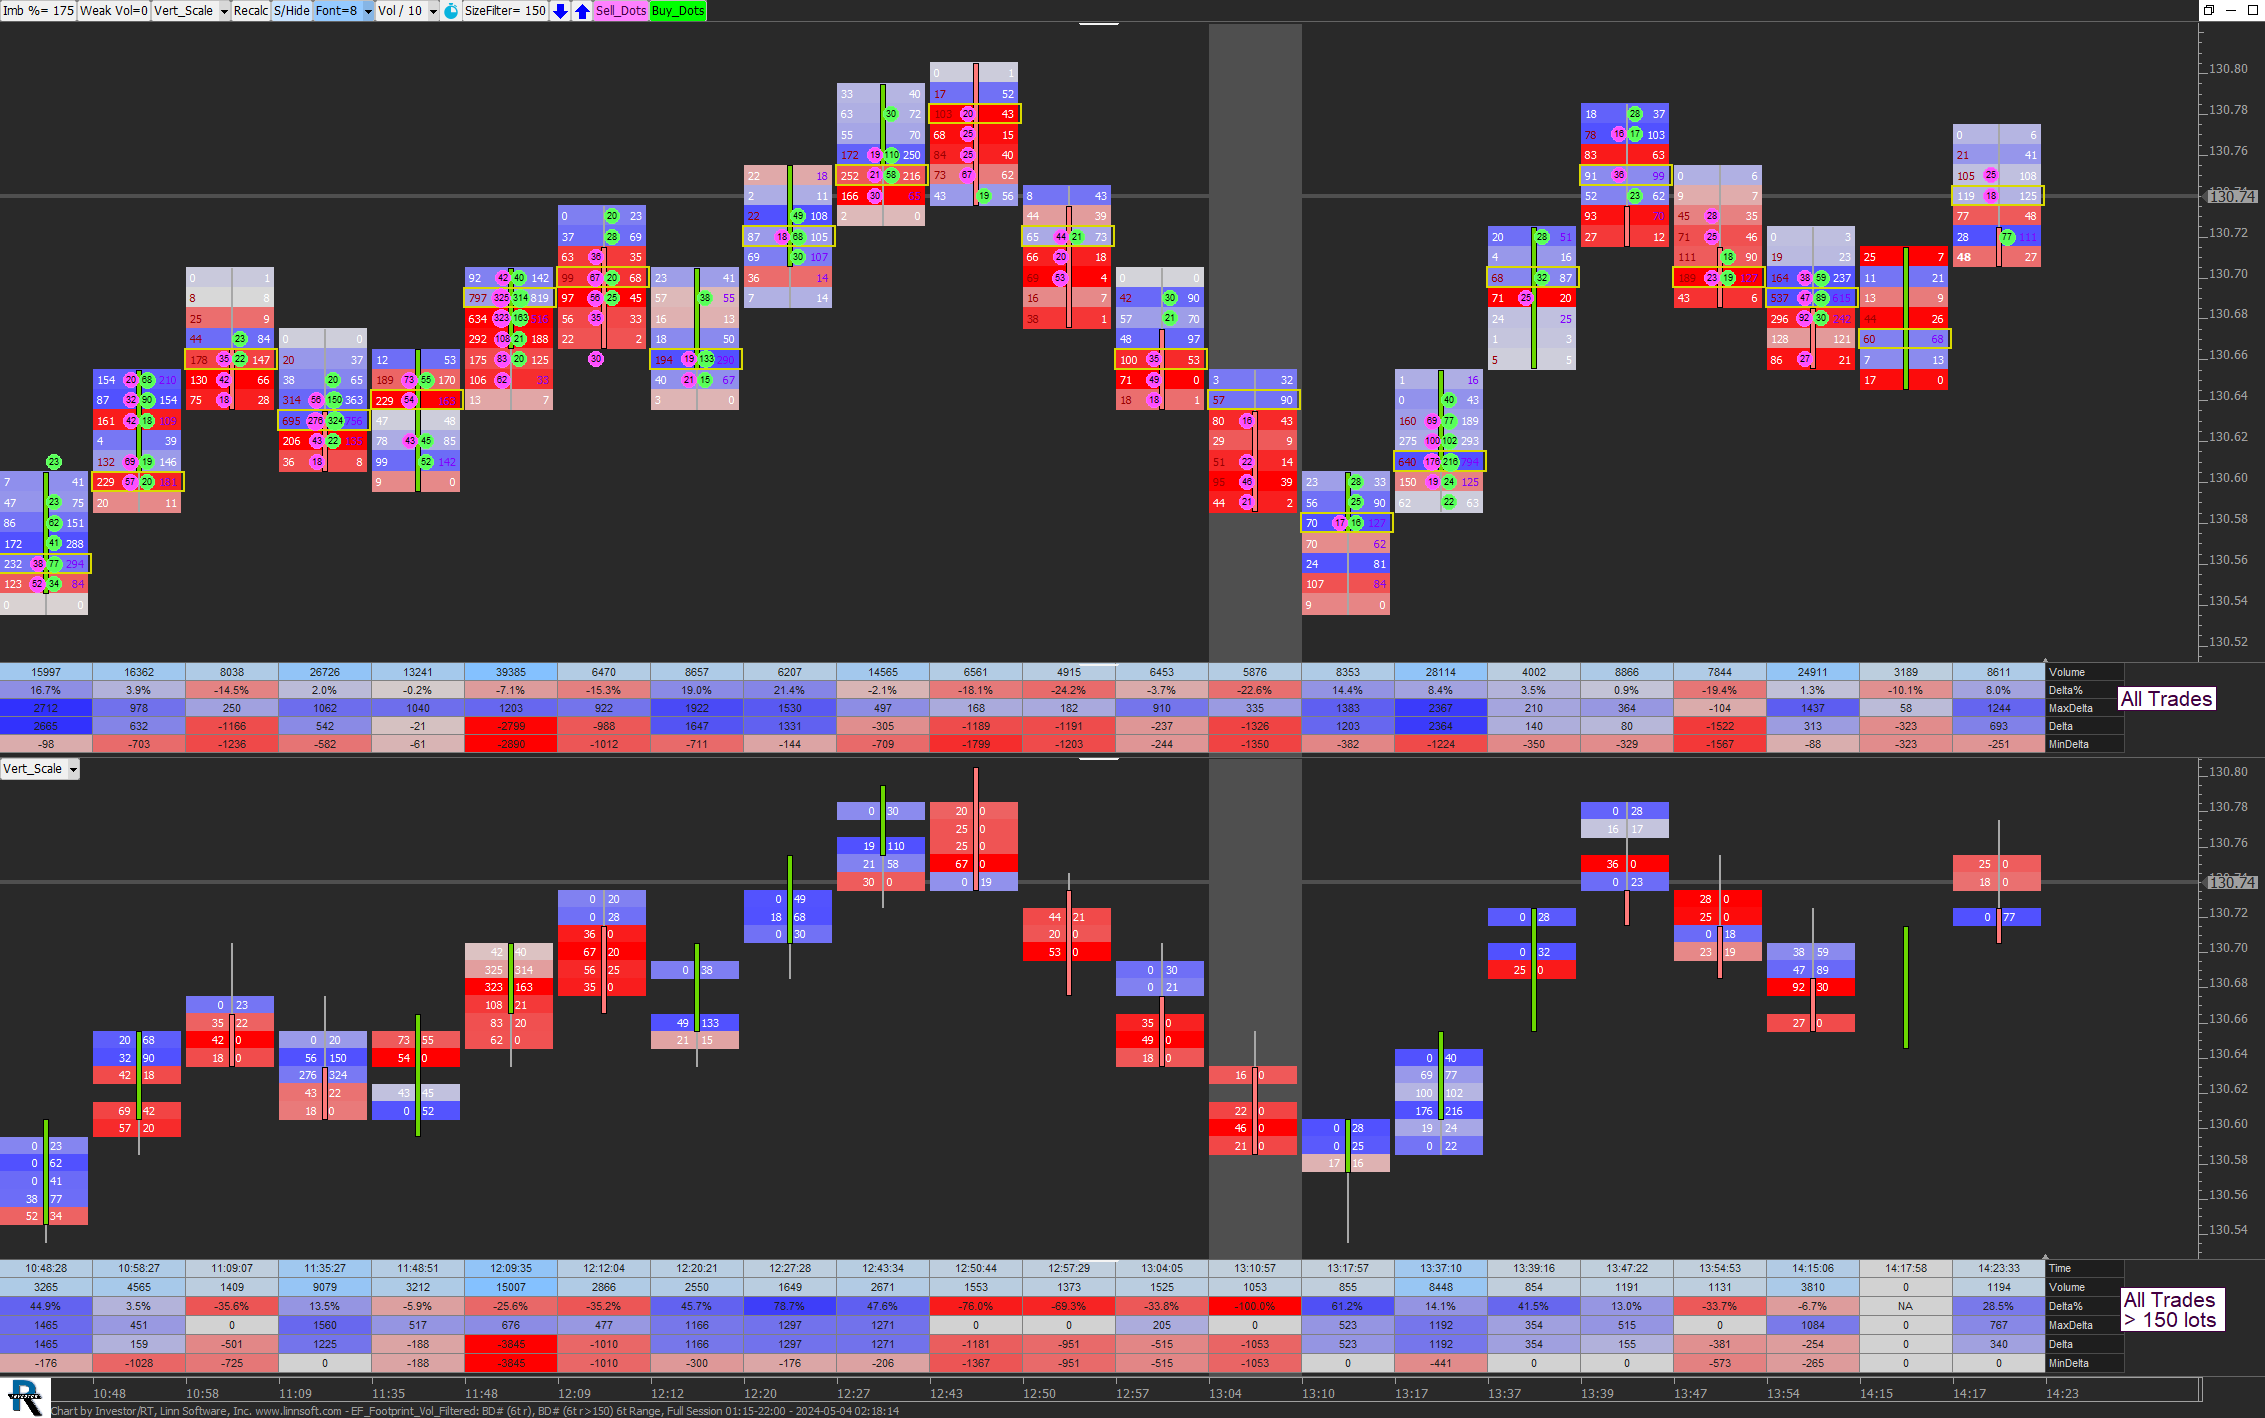 |
EF Footprint Vol Filtered (BD#) Eddy [totalcount]
11 months 2 weeks ago
Showcasing the trade size filter features and the TradeBubbles indicator to monitor large Trade. This chart was uploaded by Investor/RT 15.1.26 showing symbol: BD#. |
View |
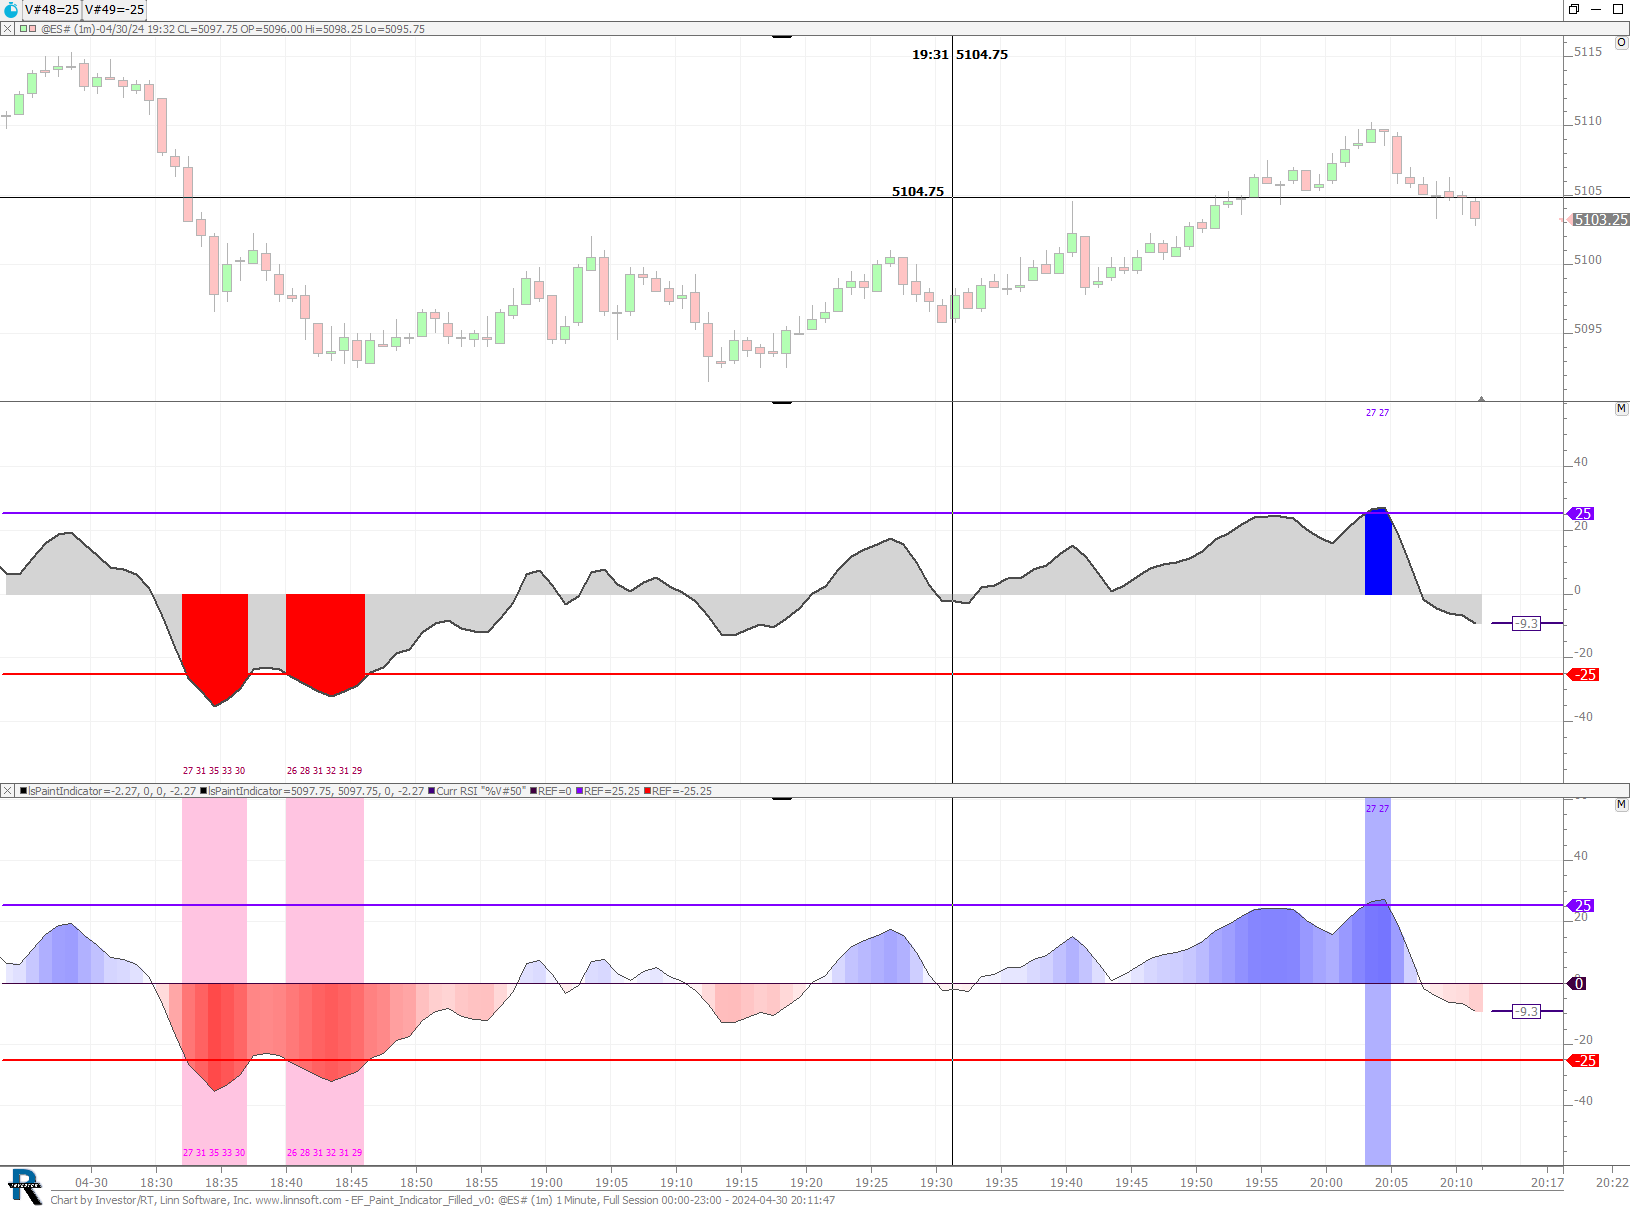 |
EF Paint Indicator Filled v0 (@ES#) Eddy [totalcount]
11 months 2 weeks ago
PaintIndicator Filled Options. This chart was uploaded by Investor/RT 15.1.26 showing symbol: @ES#. |
View |
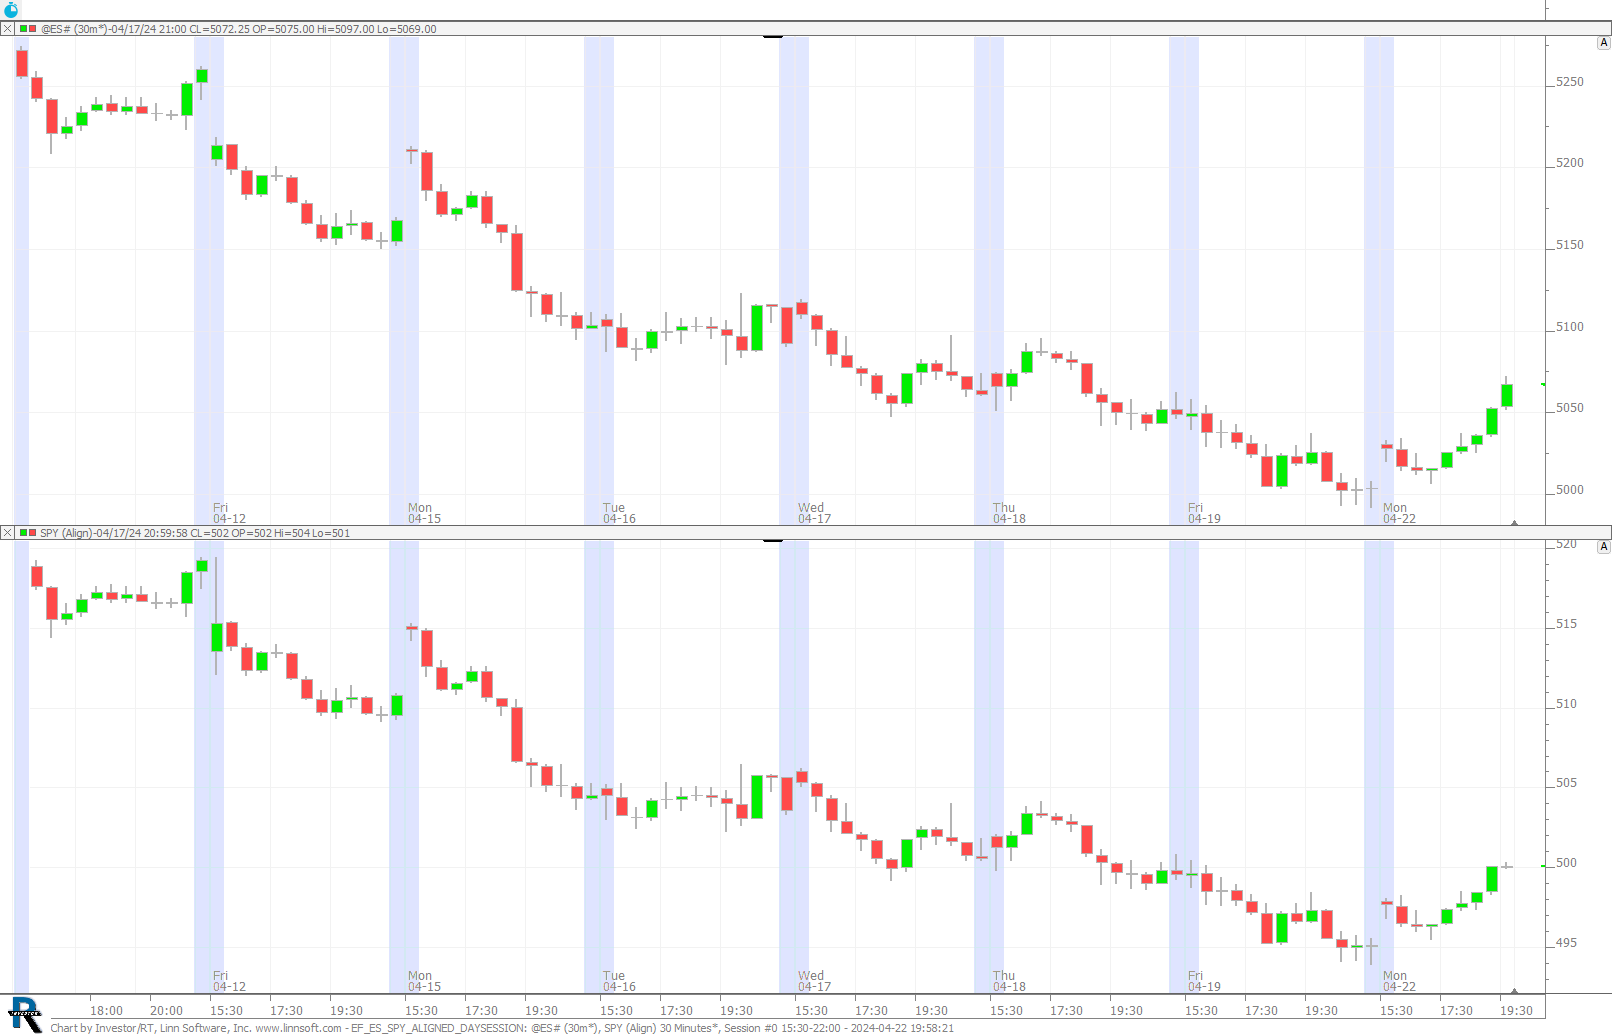 |
EF ES SPY ALIGNED DAYSESSION (@ES#) Eddy [totalcount]
11 months 3 weeks ago
ES vs SPY comparison chart (with color marker highlighting the first and final bar of the daysession). This chart was uploaded by Investor/RT 15.1.20 showing symbol: @ES#. |
View |
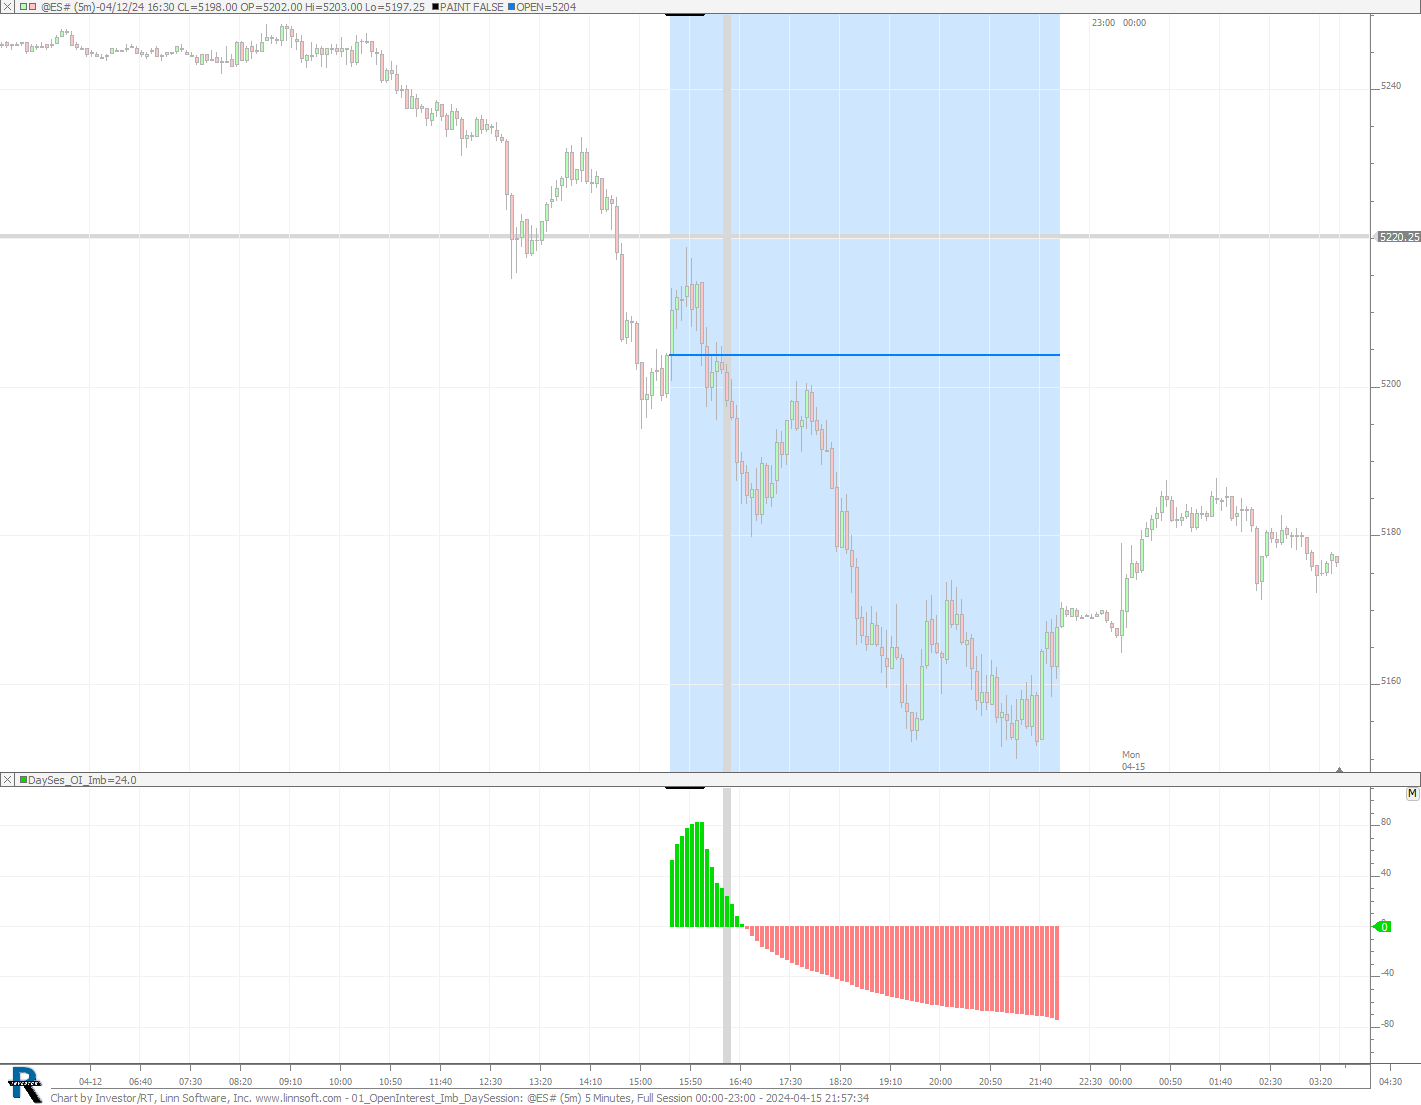 |
01 OpenInterest Imb DaySession (@ES#) Eddy [totalcount]
12 months 4 days ago
Open Interest Imbalance for E minis futures during cash session. This chart was uploaded by Investor/RT 15.1.16 showing symbol: @ES#. |
View |