 |
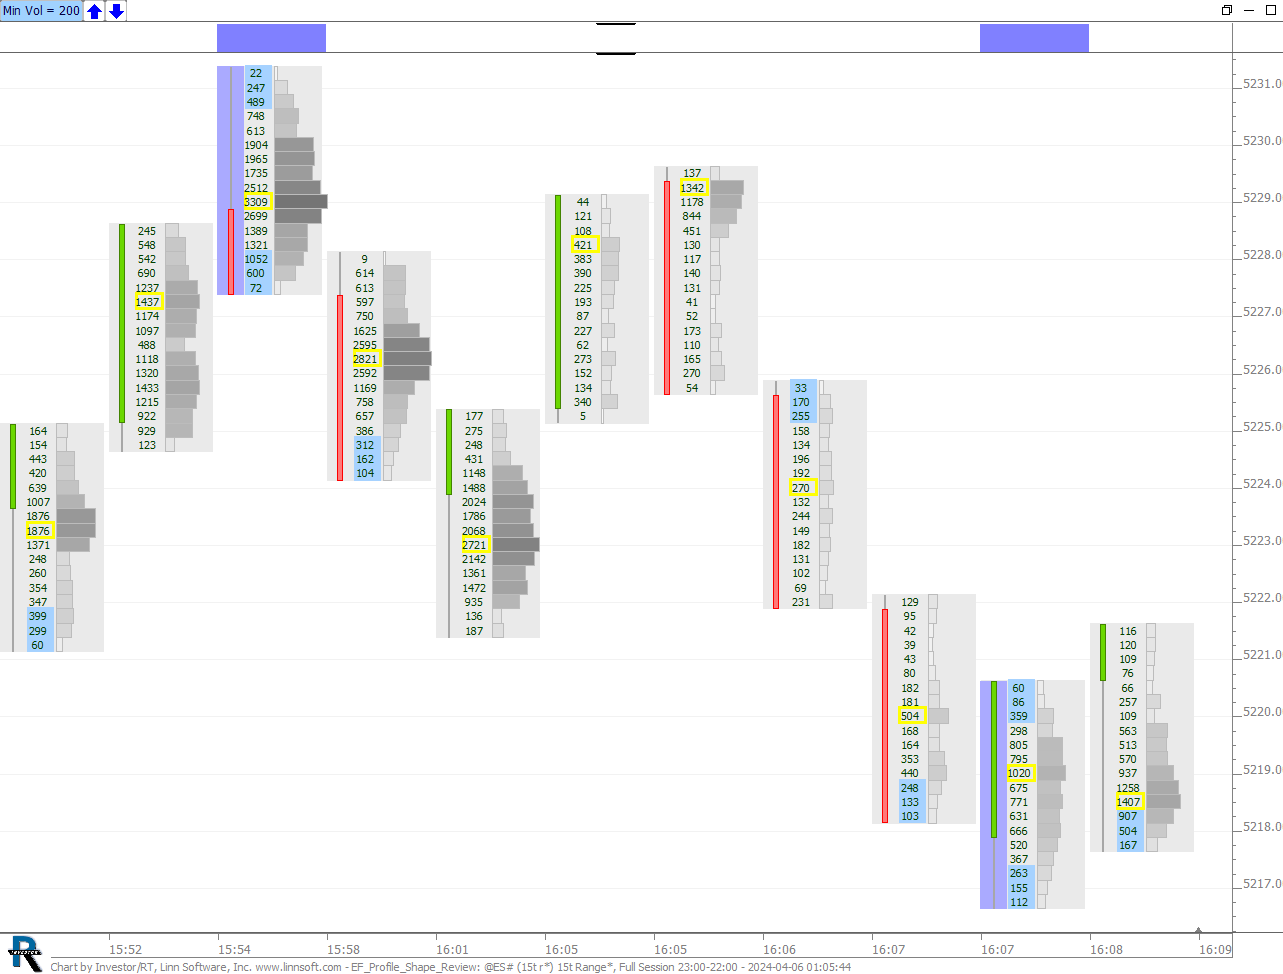
EF Profile Shape Review (@ES#) Eddy_F [totalcount]
1 year 1 week ago
Price Volume Pattern indicator setup examples. This chart was uploaded by Investor/RT 15.1.24 showing symbol: @ES#. |
View |
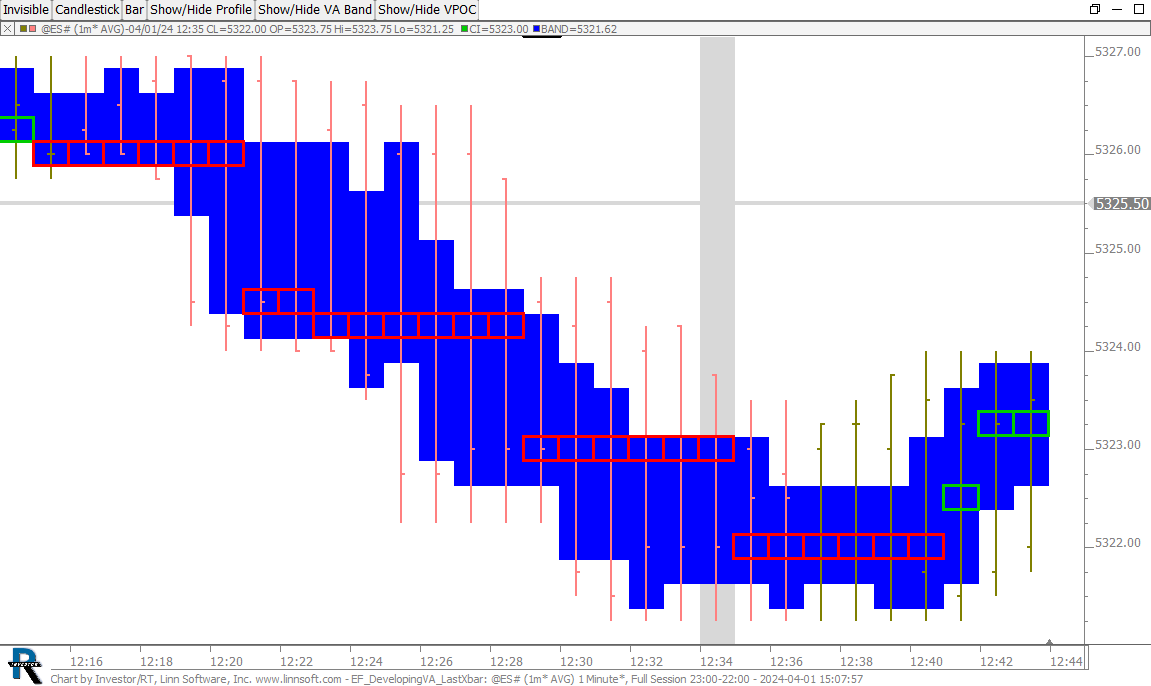 |
EF DevelopingVA LastXbar (@ES#) Eddy [totalcount]
1 year 2 weeks ago
"Average Bars feature" applied to Developping VA analysis. This chart was uploaded by Investor/RT 15.1.16 showing symbol: @ES#. |
View |
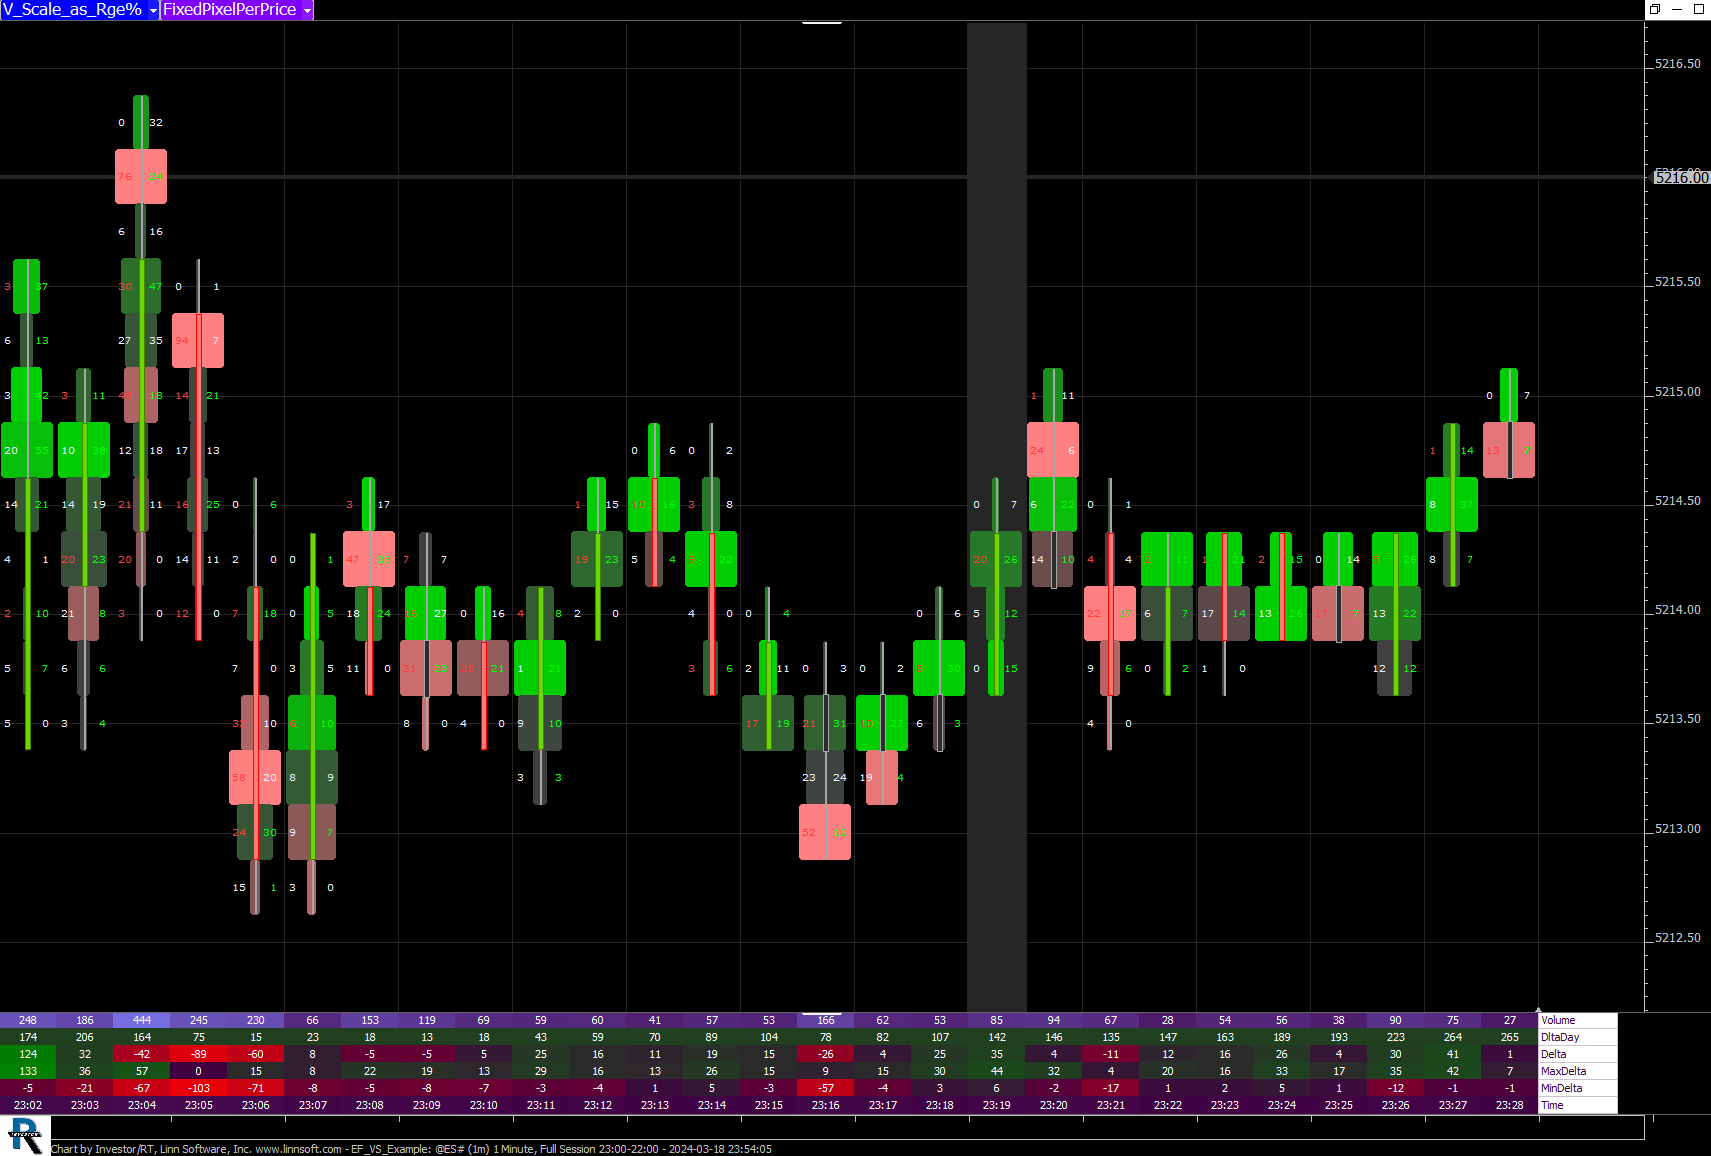 |
EF VS Example (@ES#) Eddy_F [totalcount]
1 year 4 weeks ago
VolumeScope example with vertical scale button controls. This chart was uploaded by Investor/RT 15.1.16 showing symbol: @ES#. |
View |
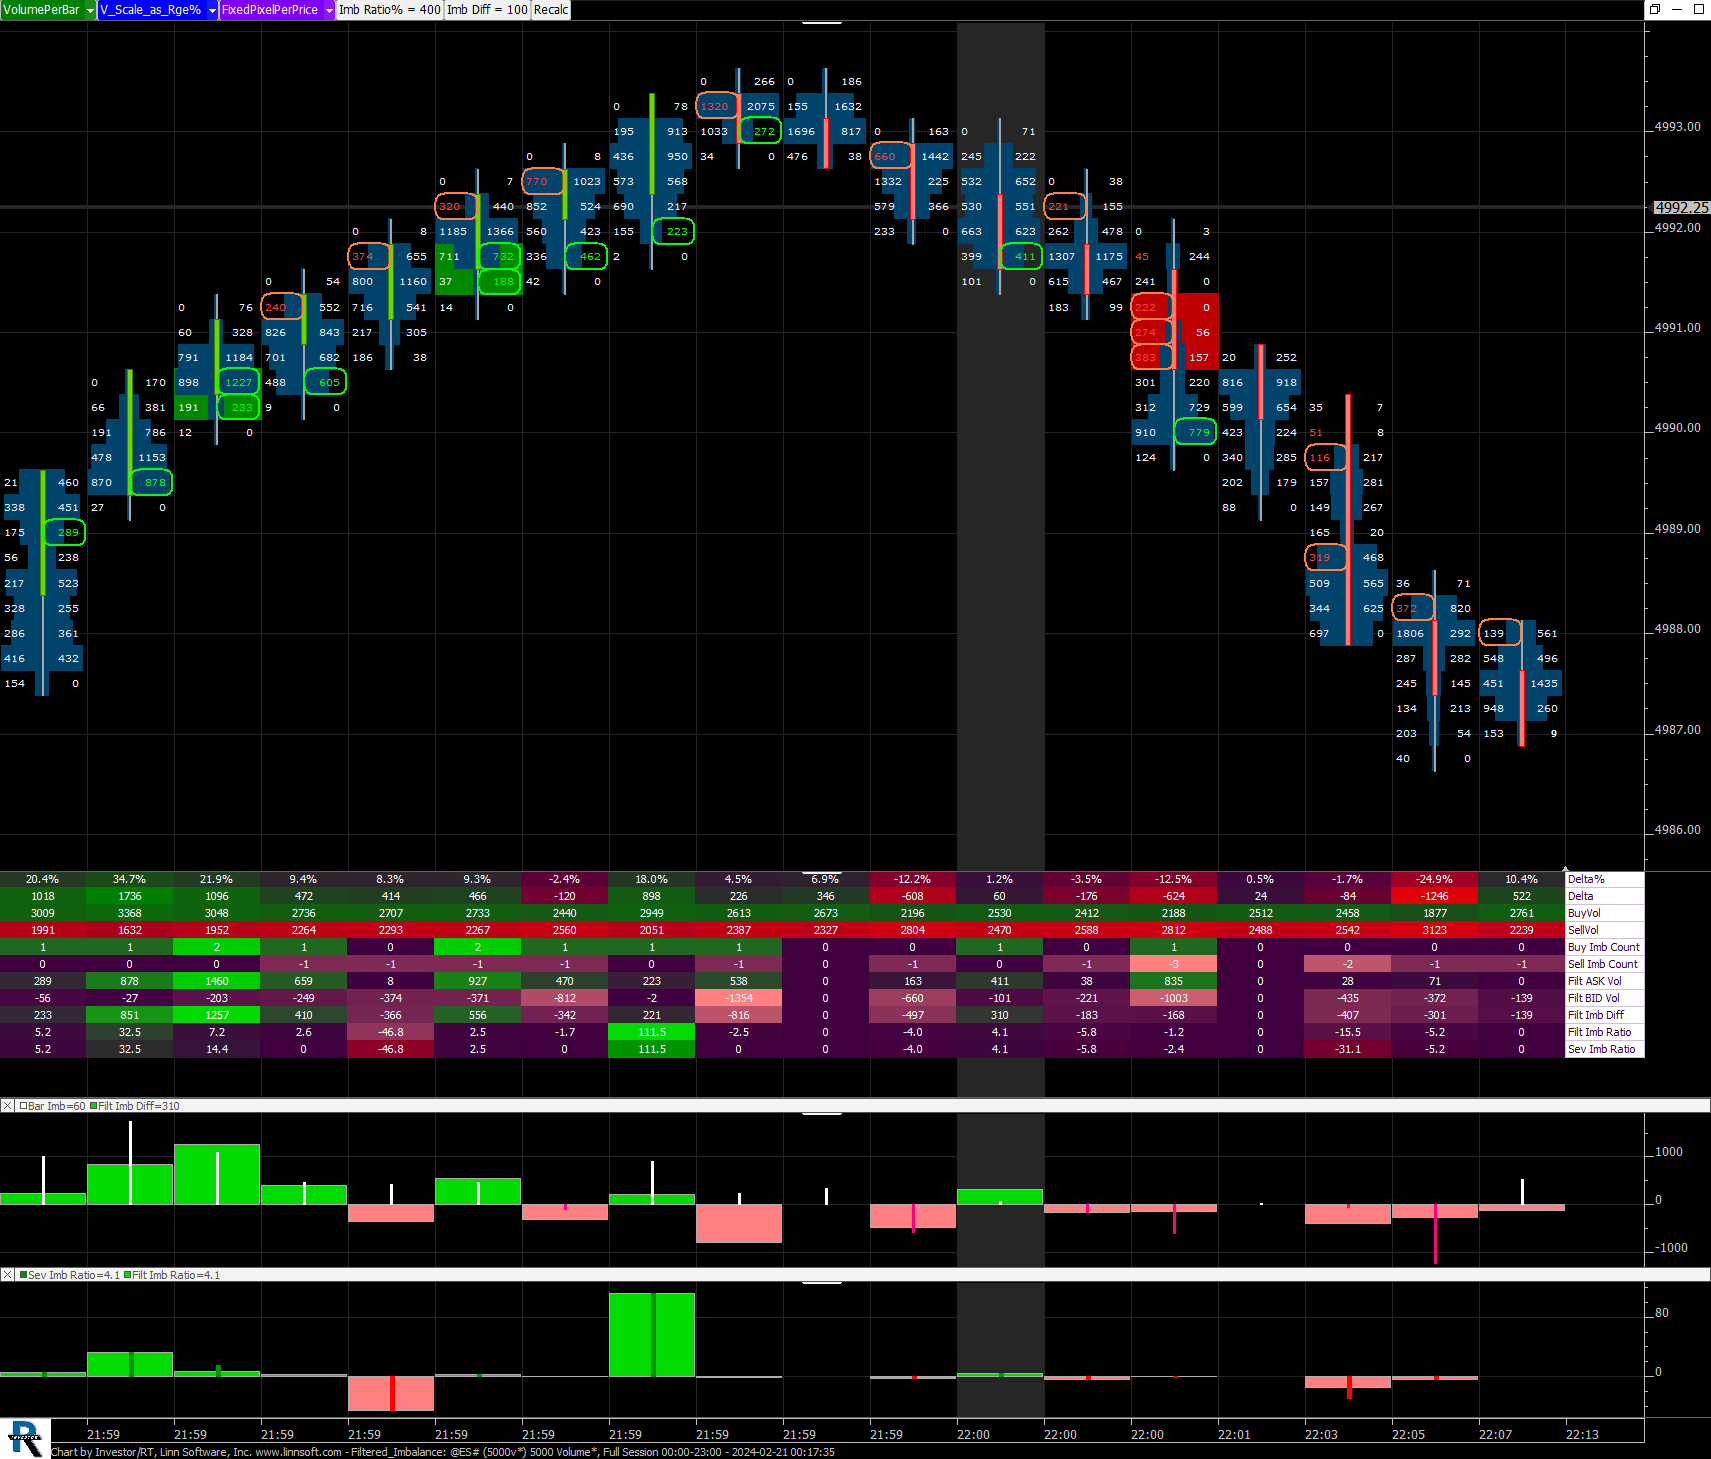 |
Filtered Imbalance (@ES#) Eddy_F [totalcount]
1 year 1 month ago
Chart illustrating some of the Price Volume Pattern (PVP) indicator and token features (more information : see the forum post titled "Filtered Imbalance with Severity". |
View |
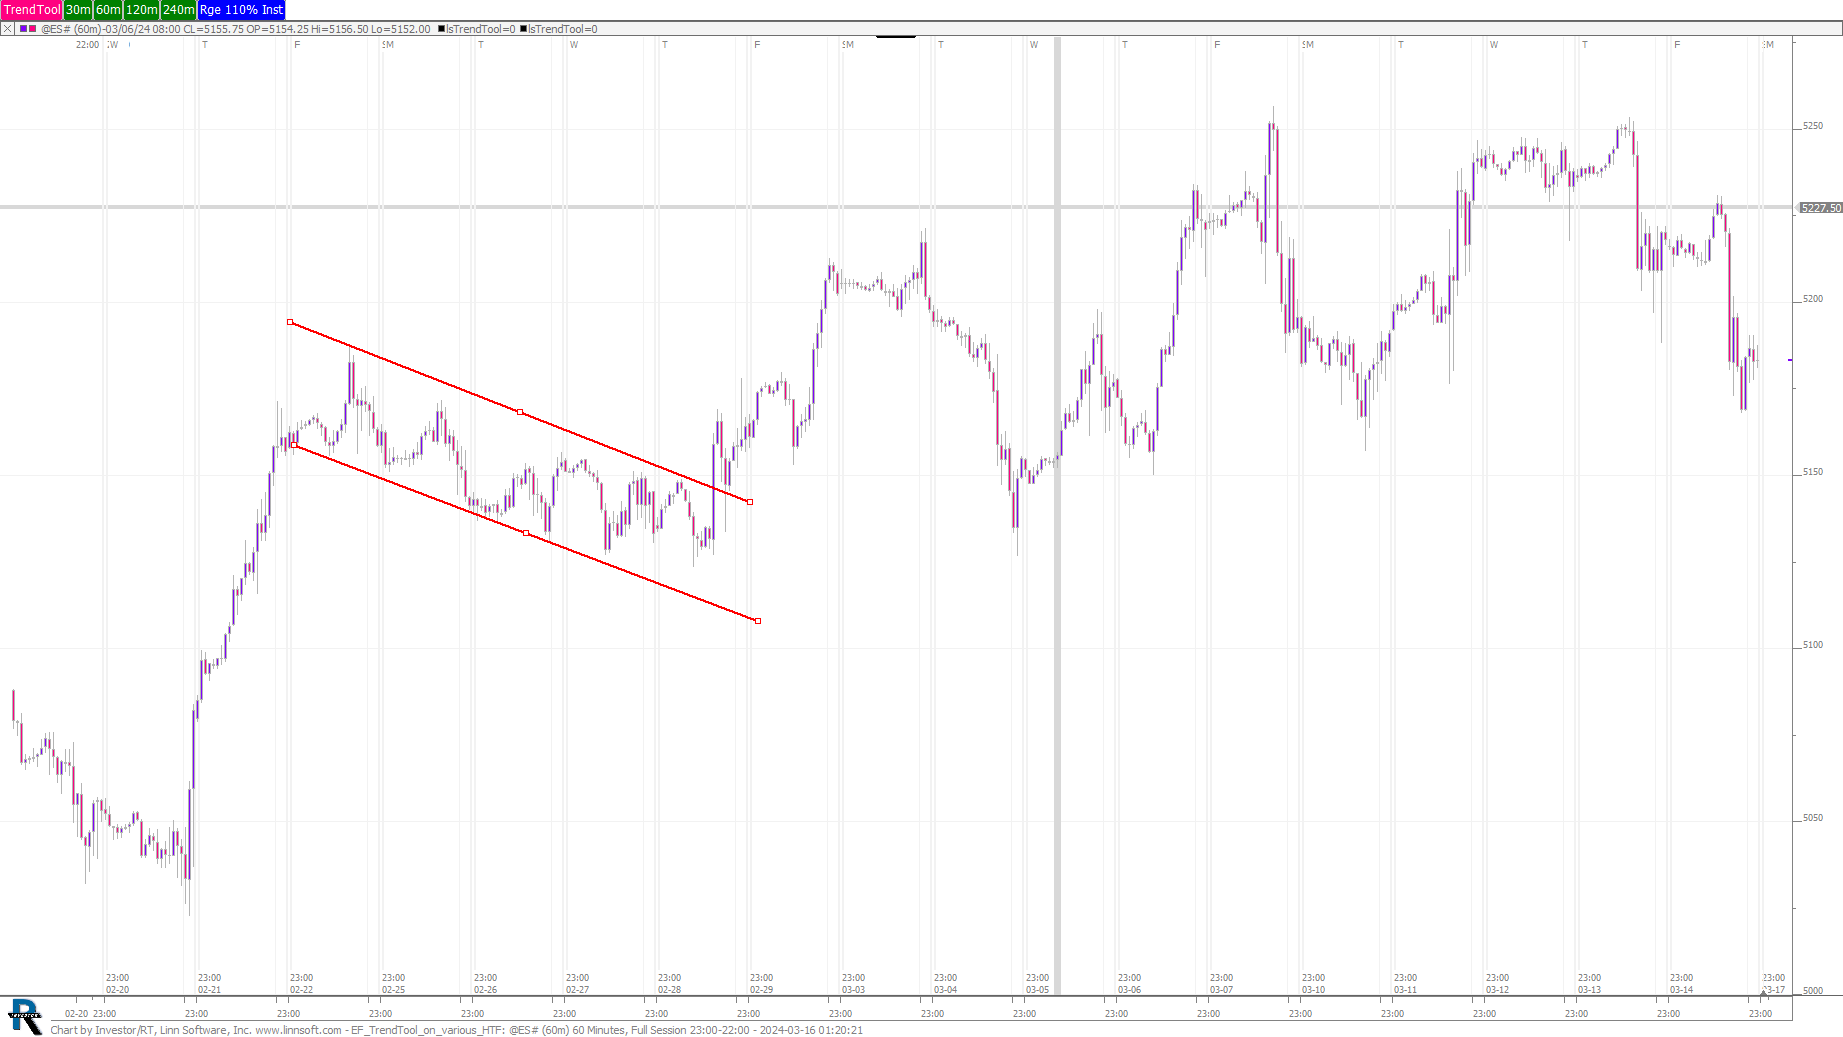 |
EF TrendTool on various HTF (@ES#) Eddy_F [totalcount]
1 year 1 month ago
TrendTool RTX indciator on various HTF periodicities. This chart was uploaded by Investor/RT 15.1.22 showing symbol: @ES#. |
View |
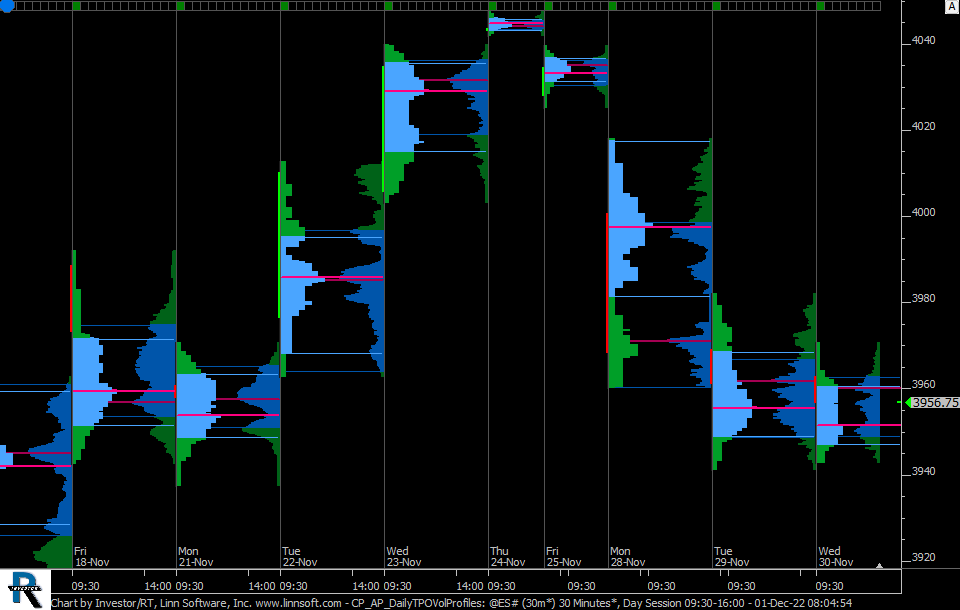 |
CP AP DailyTPOVolProfiles (@ES#) cpayne [totalcount]
2 years 4 months ago
Charts showing both TPO Profile (on the left) & Volume Profile (on the right), together with the merging/hiding profile features offered by the Boundaries indicator. |
View |
 |
MPH SignificantClusters (@ES#) cpayne [totalcount]
5 years 3 weeks ago
Significant Clusters... This chart was uploaded by Investor/RT 14.1.4 showing symbol: @ES#. |
View |
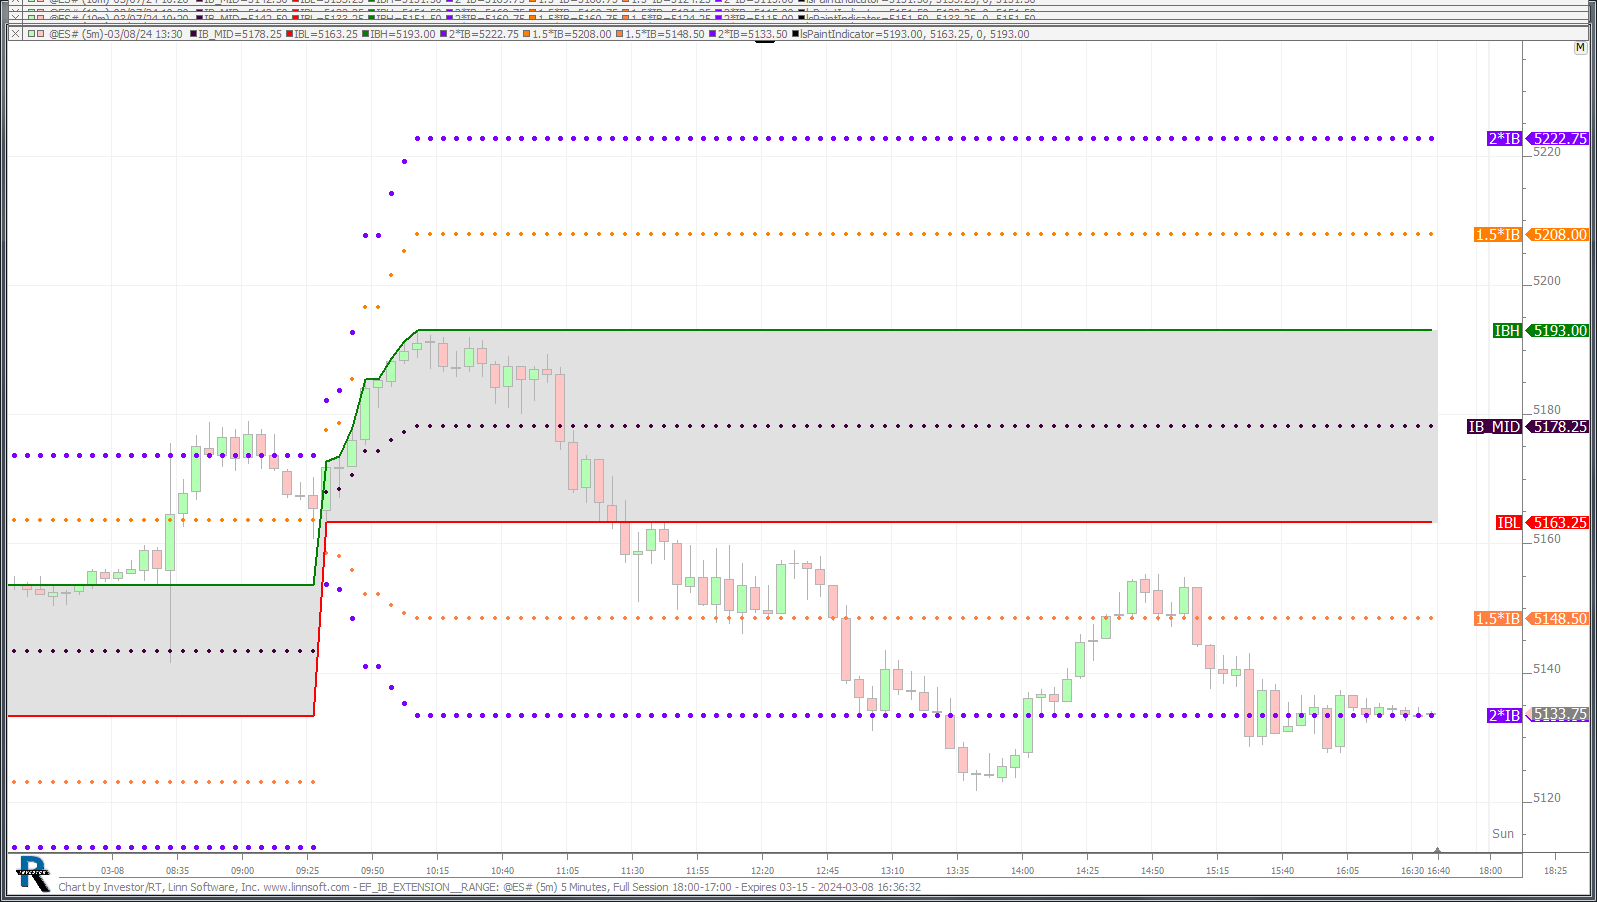 |
EF IB EXTENSION RANGE (@ES#) Eddy_F [totalcount]
1 year 1 month ago
Custom Indicators using the Session statistics token (SESST) to display IB extension ranges (150 and 200%). This chart was uploaded by Investor/RT 15.1.22 showing symbol: @ES#. |
View |
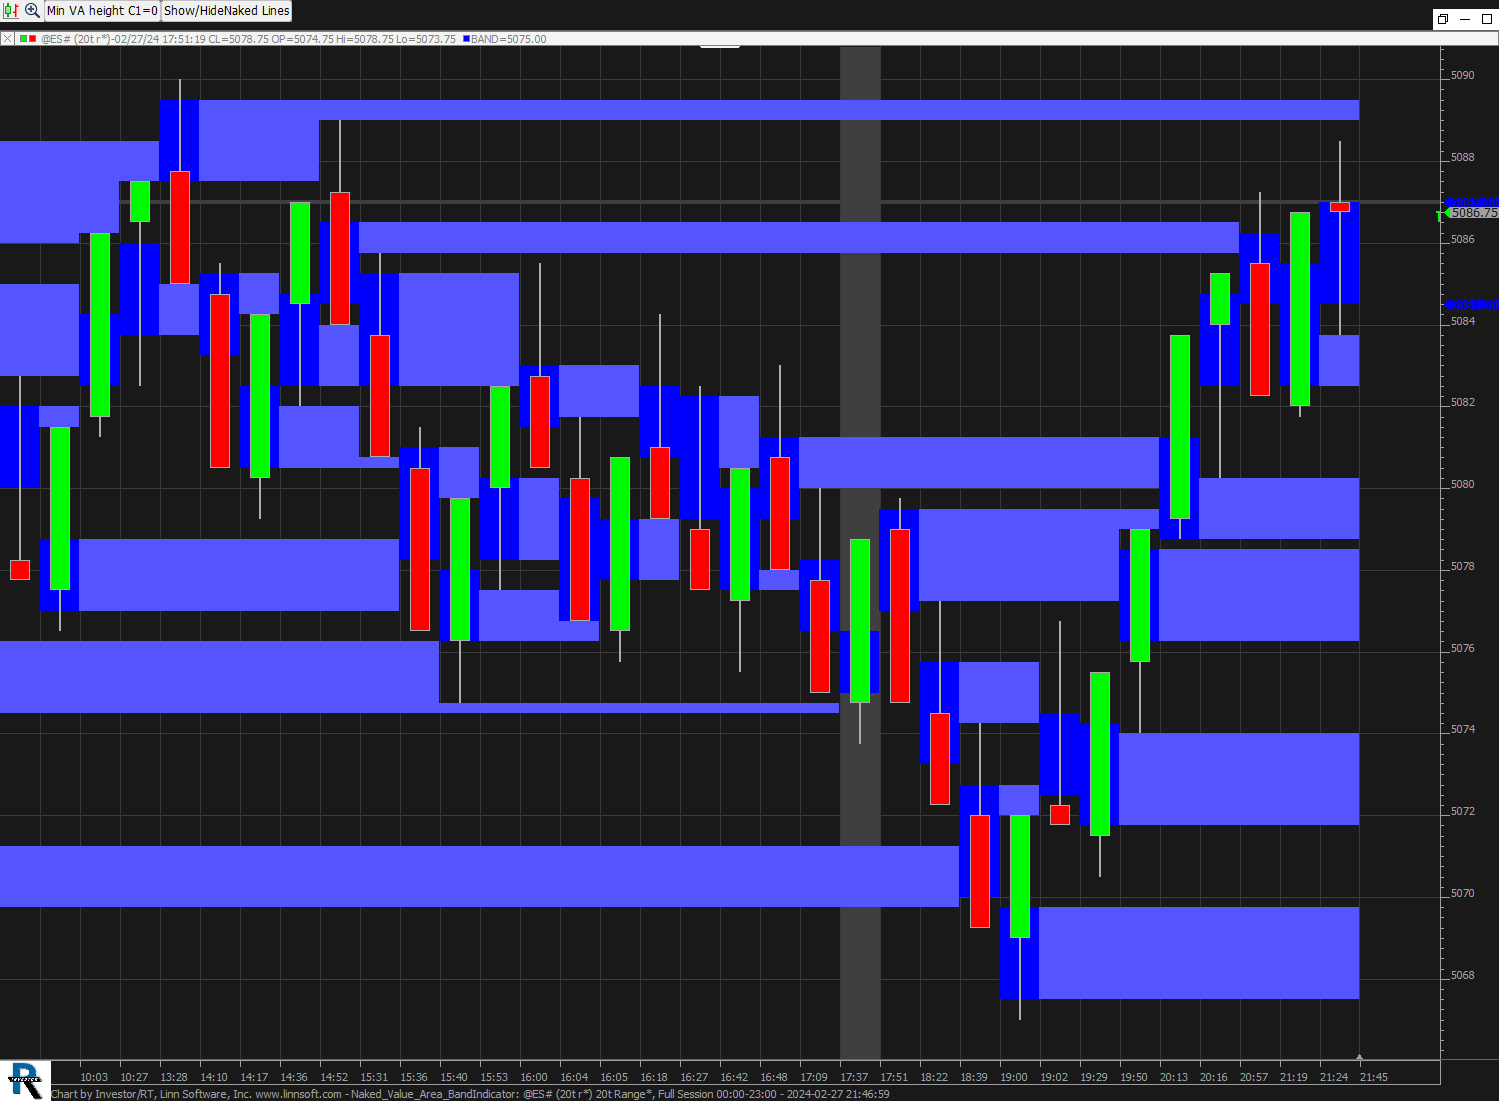 |
Naked Value Area BandIndicator (@ES#) Eddy_F [totalcount]
1 year 1 month ago
Using the Bands indicator "stepped block" style to extend Naked Value Areas. This chart was uploaded by Investor/RT 15.1.16 showing symbol: @ES#. |
View |
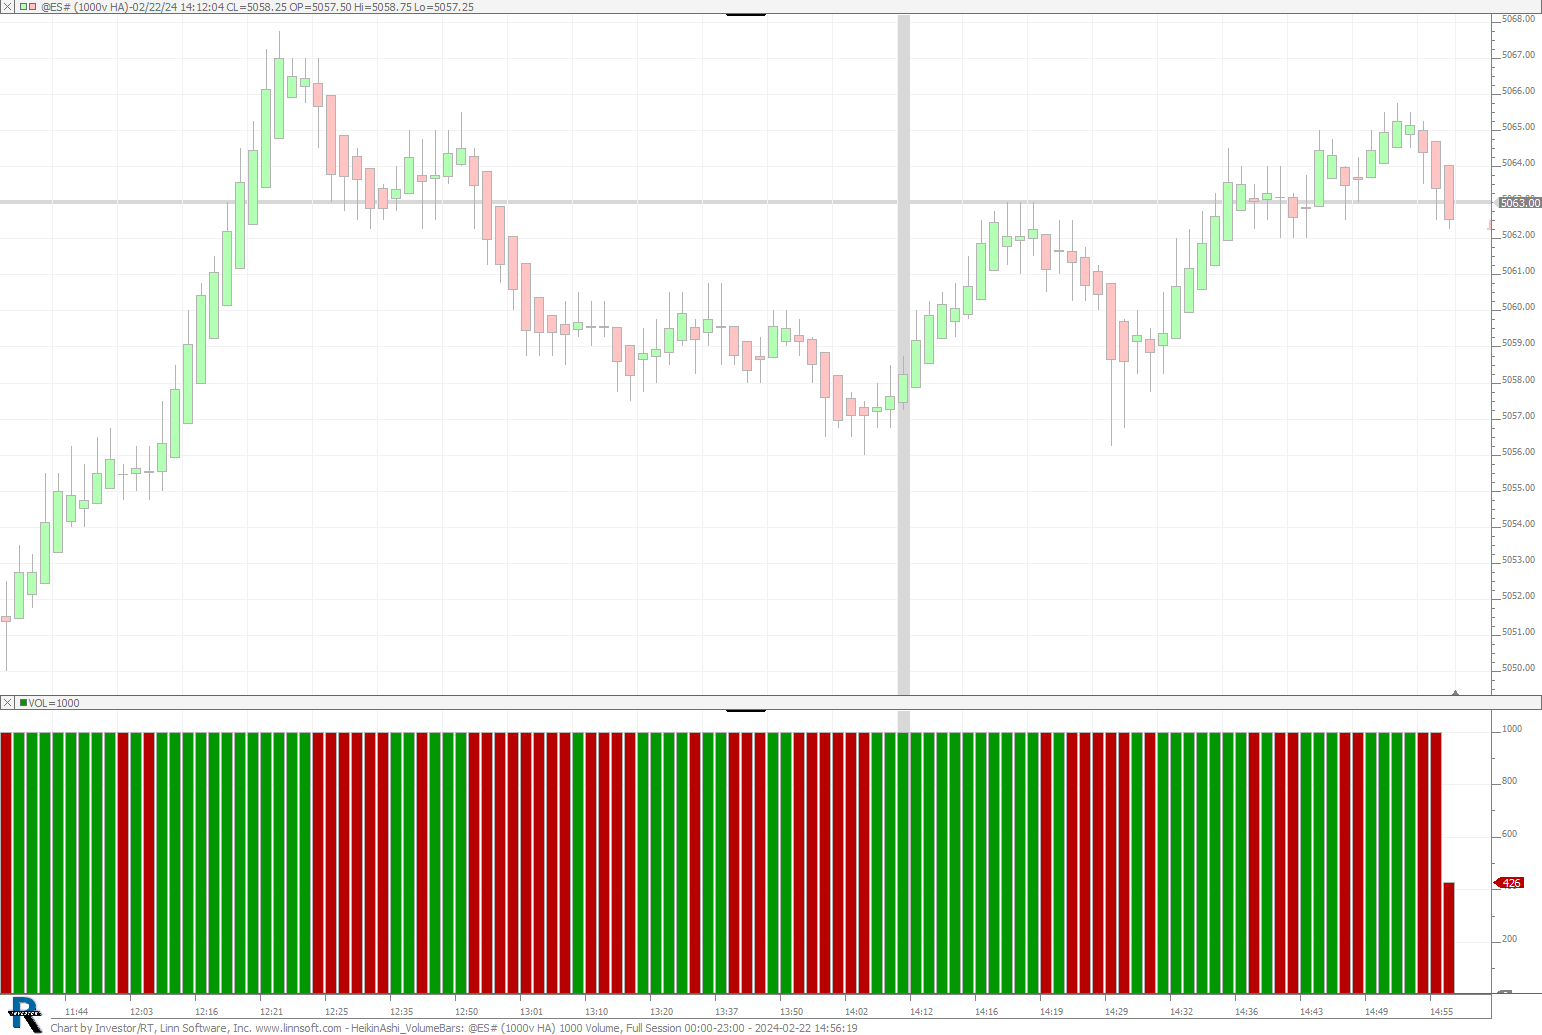 |
HeikinAshi VolumeBars (@ES#) Eddy_F [totalcount]
1 year 1 month ago
HeikinAshi layer applied on VolumeBars. This chart was uploaded by Investor/RT 15.1.16 showing symbol: @ES#. |
View |
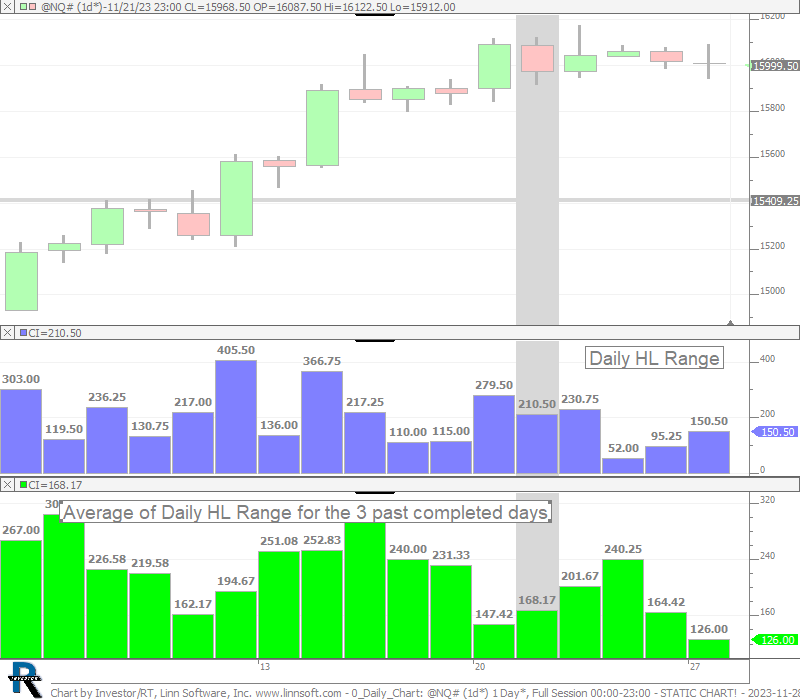 |
0 Daily Chart (@NQ#) Eddy_F [totalcount]
1 year 4 months ago
Forum question (MPD set up) : projected High based on past average daily range. This chart was uploaded by Investor/RT 15.1.16 showing symbol: @NQ#. |
View |
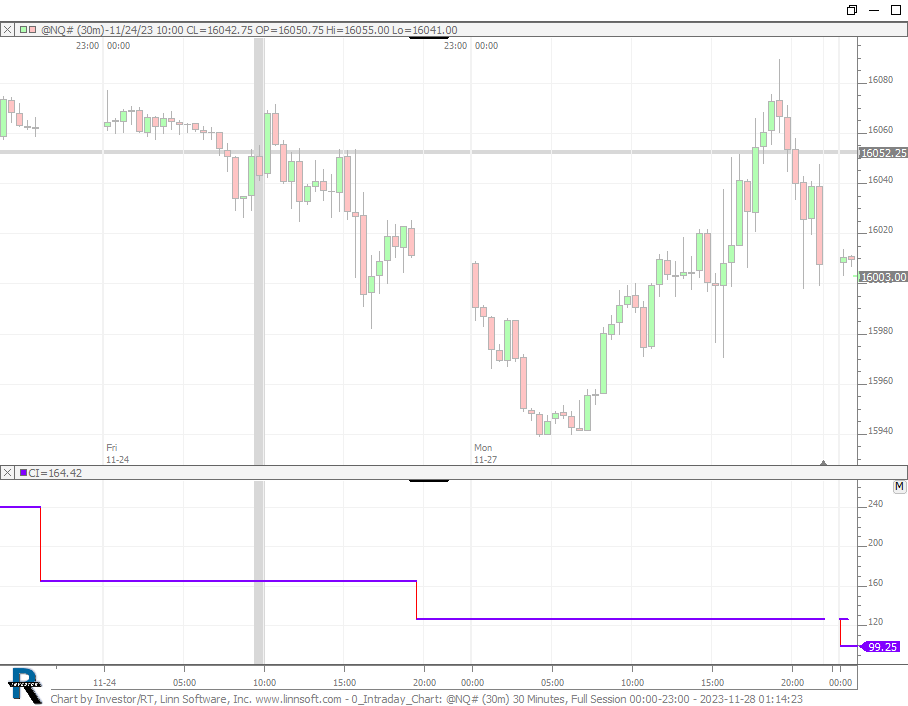 |
0 Intraday Chart (@NQ#) Eddy_F [totalcount]
1 year 4 months ago
Forum question (MPD set up) : projected High based on past average daily range. This chart was uploaded by Investor/RT 15.1.16 showing symbol: @NQ#. |
View |
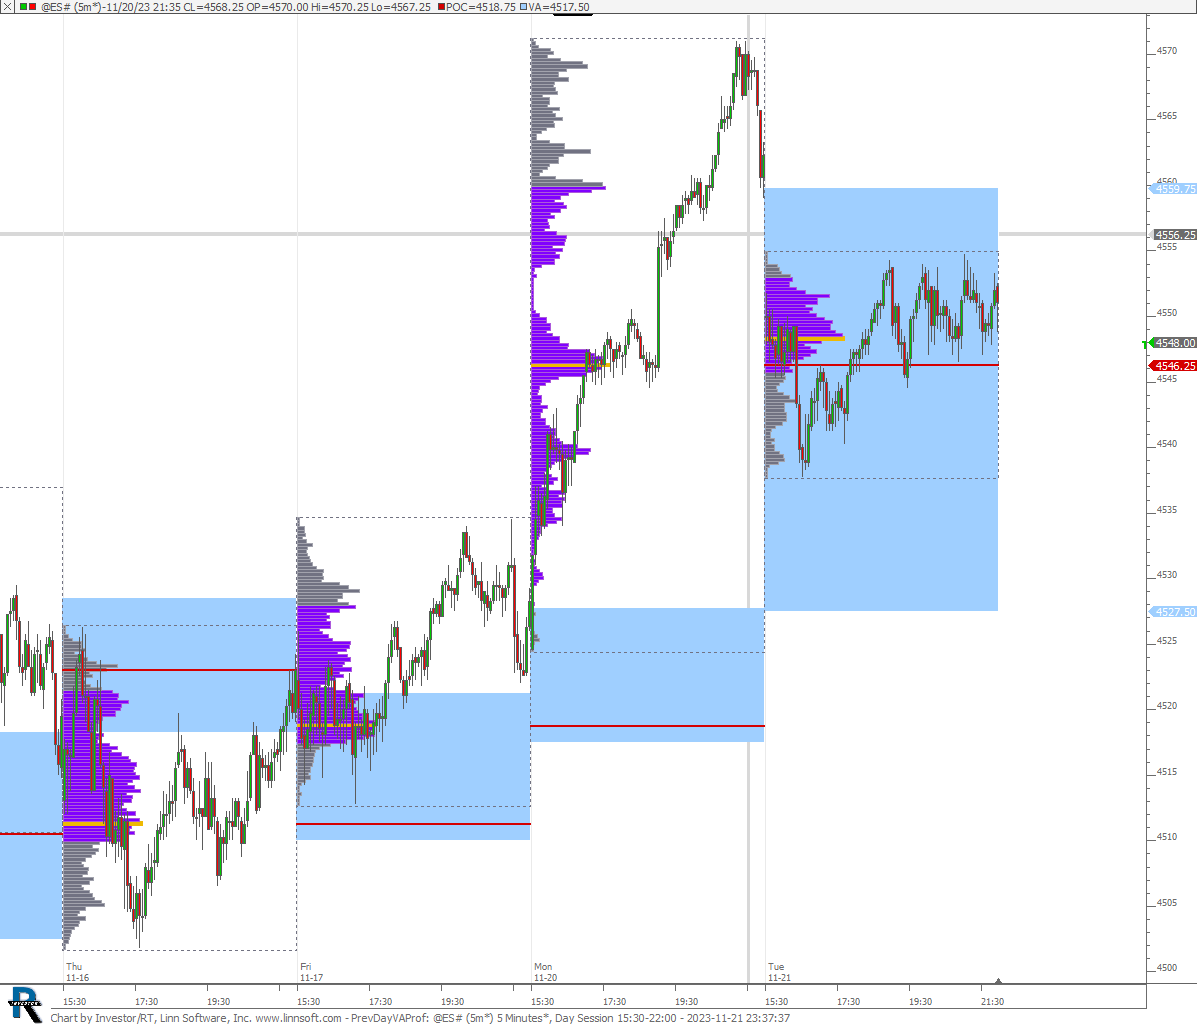 |
PrevDayVAProf (@ES#) 2 Eddy_F [totalcount]
1 year 4 months ago
How to display Yesterday VA zone on top of today profile. This chart was uploaded by Investor/RT 15.1.16 showing symbol: @ES#. |
View |
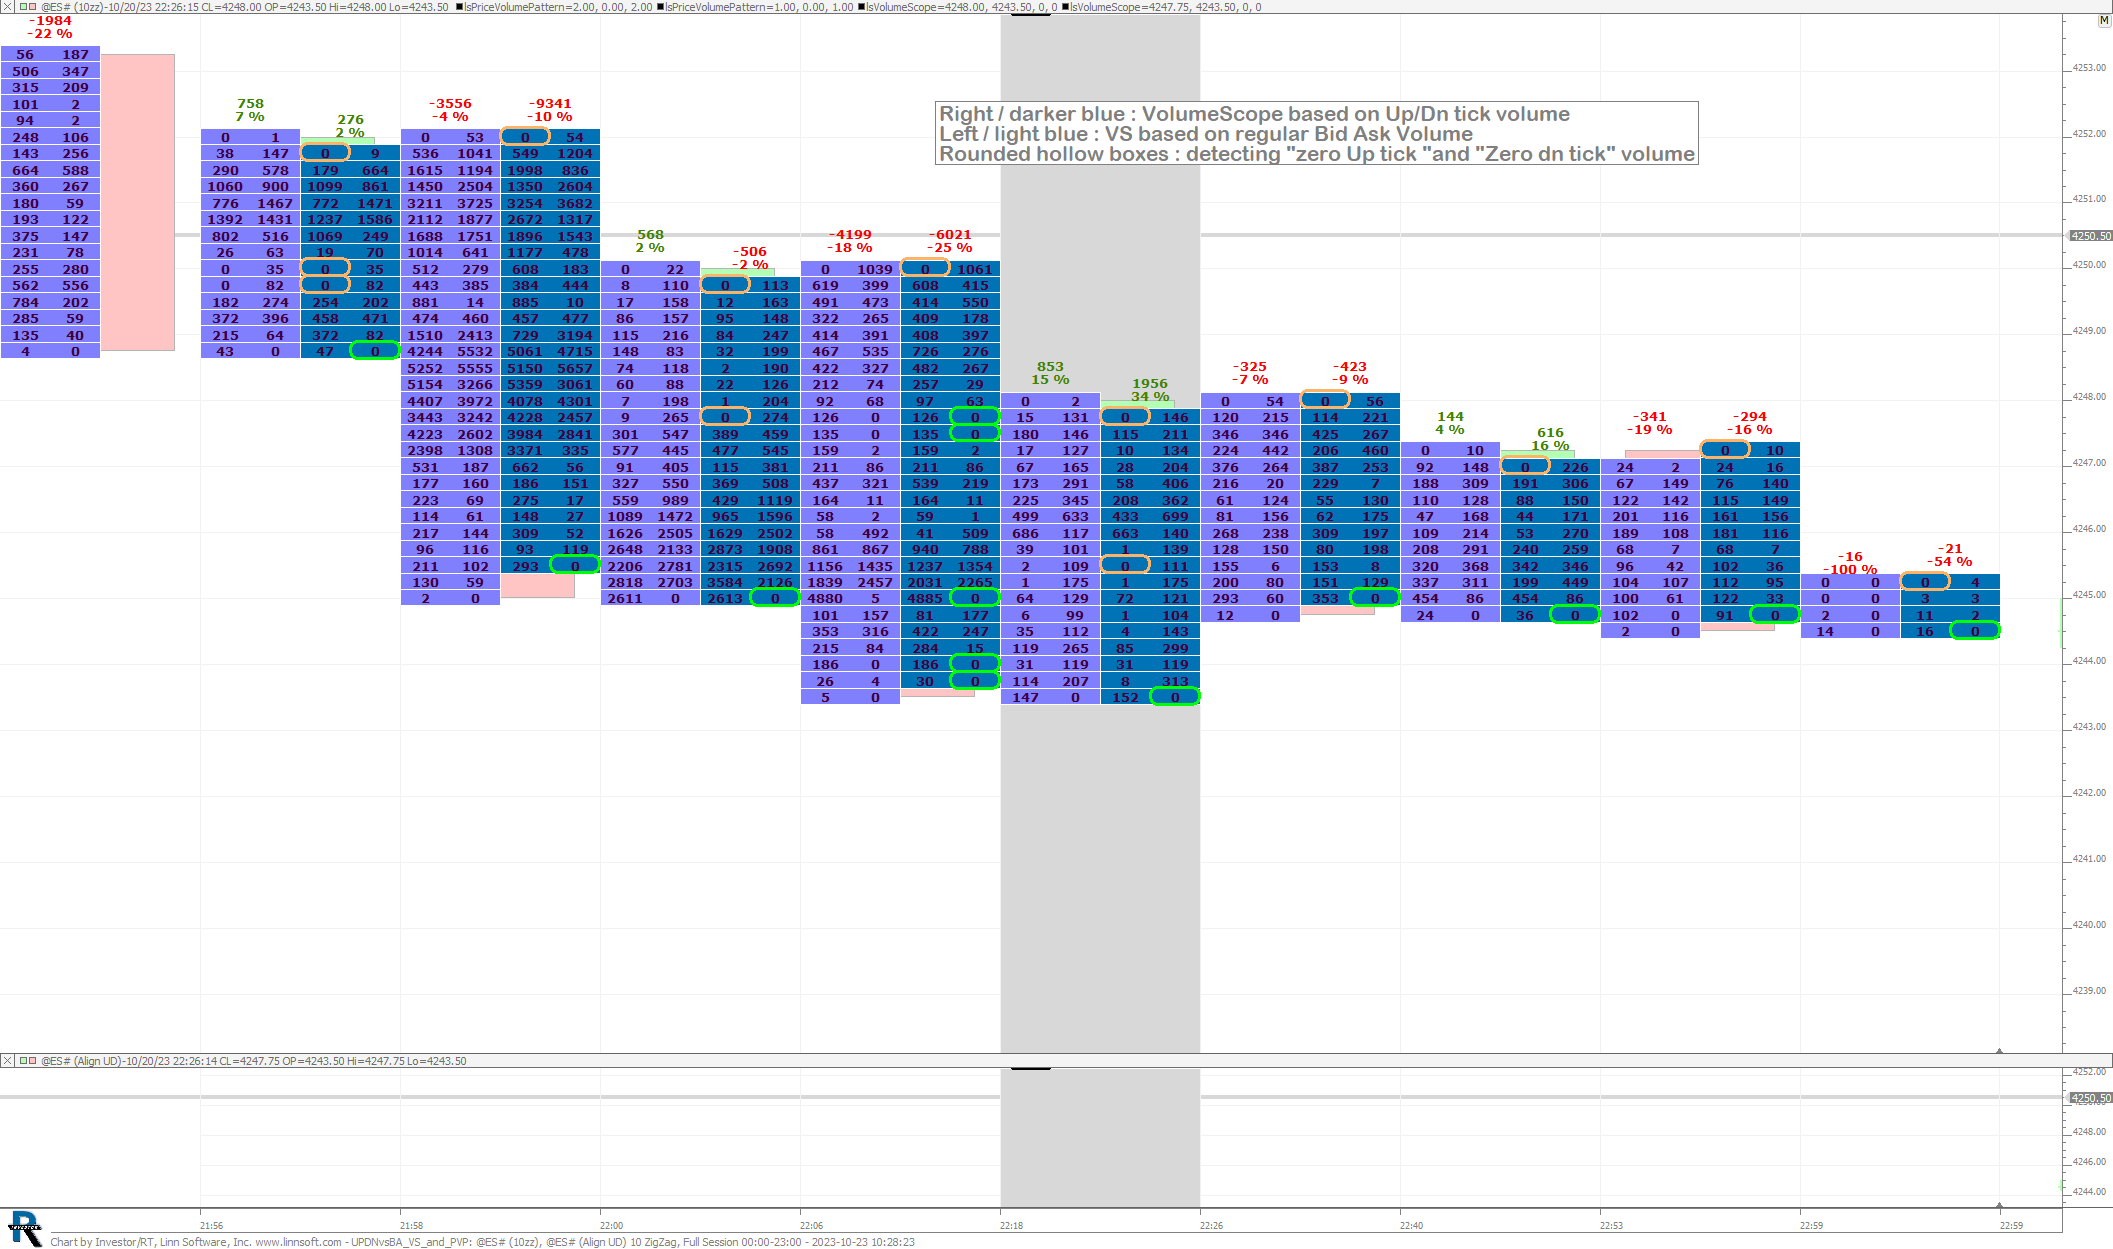 |
UPDNvsBA VS and PVP (@ES#) Eddy_F [totalcount]
1 year 5 months ago
VS on both bid/ask and Up/dn tick basis. This chart was uploaded by Investor/RT 15.1.16 showing symbol: @ES#. |
View |
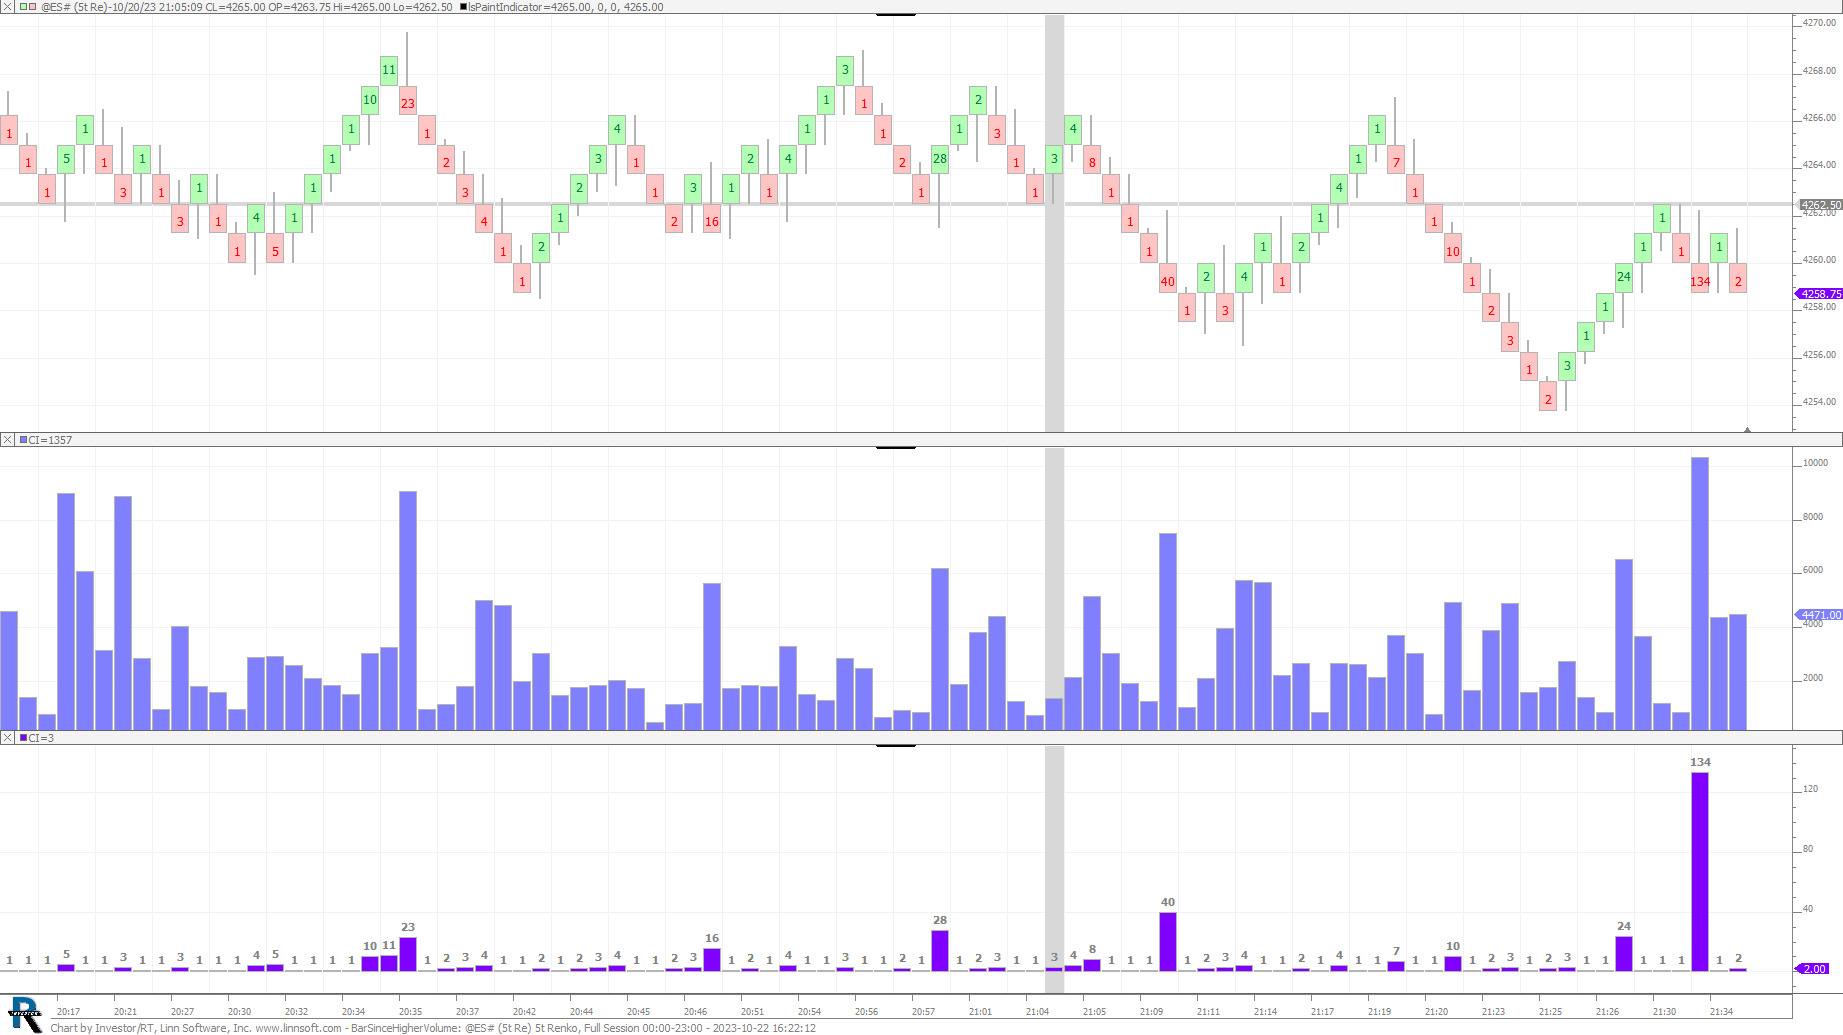 |
BarSinceHigherVolume (@ES#) Eddy_F [totalcount]
1 year 5 months ago
Bar Since Higher Volume - Example of the STAT token. This chart was uploaded by Investor/RT 15.1.16 showing symbol: @ES#. |
View |
 |
00 PNF CHART Part (@ES#) Eddy_F [totalcount]
1 year 6 months ago
Forum request : how to display volume on top / below candle (according to PNF bar direction) - Part 2 : coloring the label box according to a given criteria. |
View |
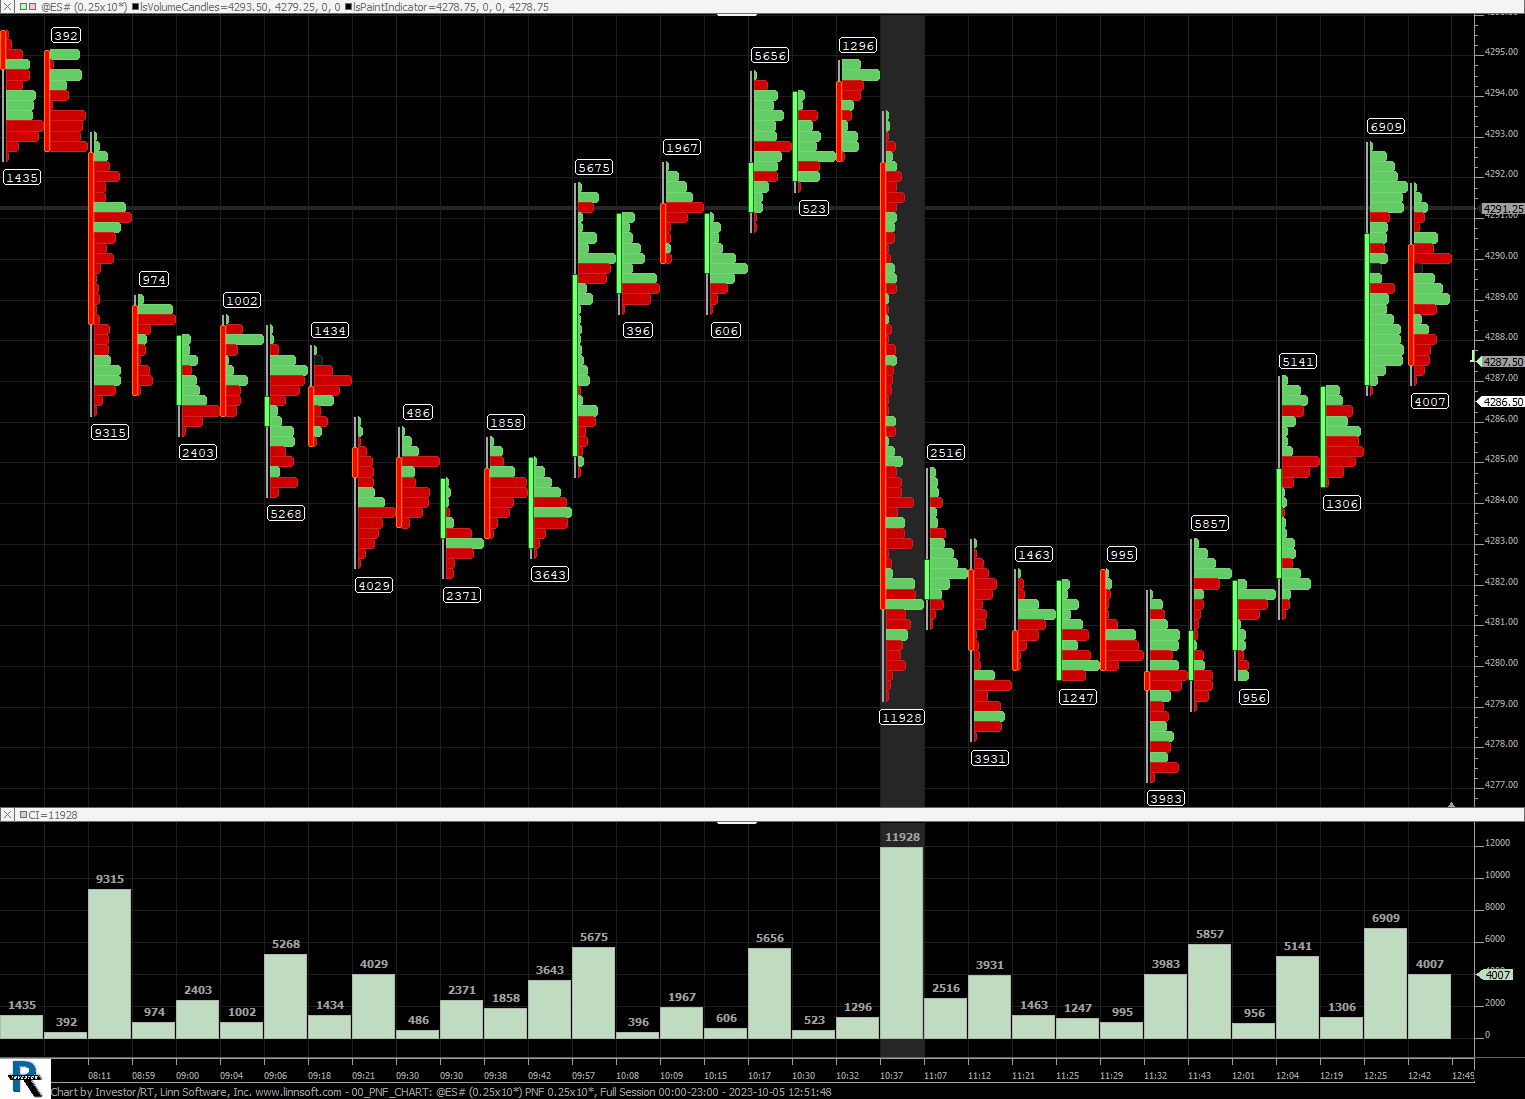 |
00 PNF CHART (@ES#) Eddy_F [totalcount]
1 year 6 months ago
Forum request : how to display volume on top / below candle (according to PNF bar direction) - Answer : use the Paint Indicator. |
View |
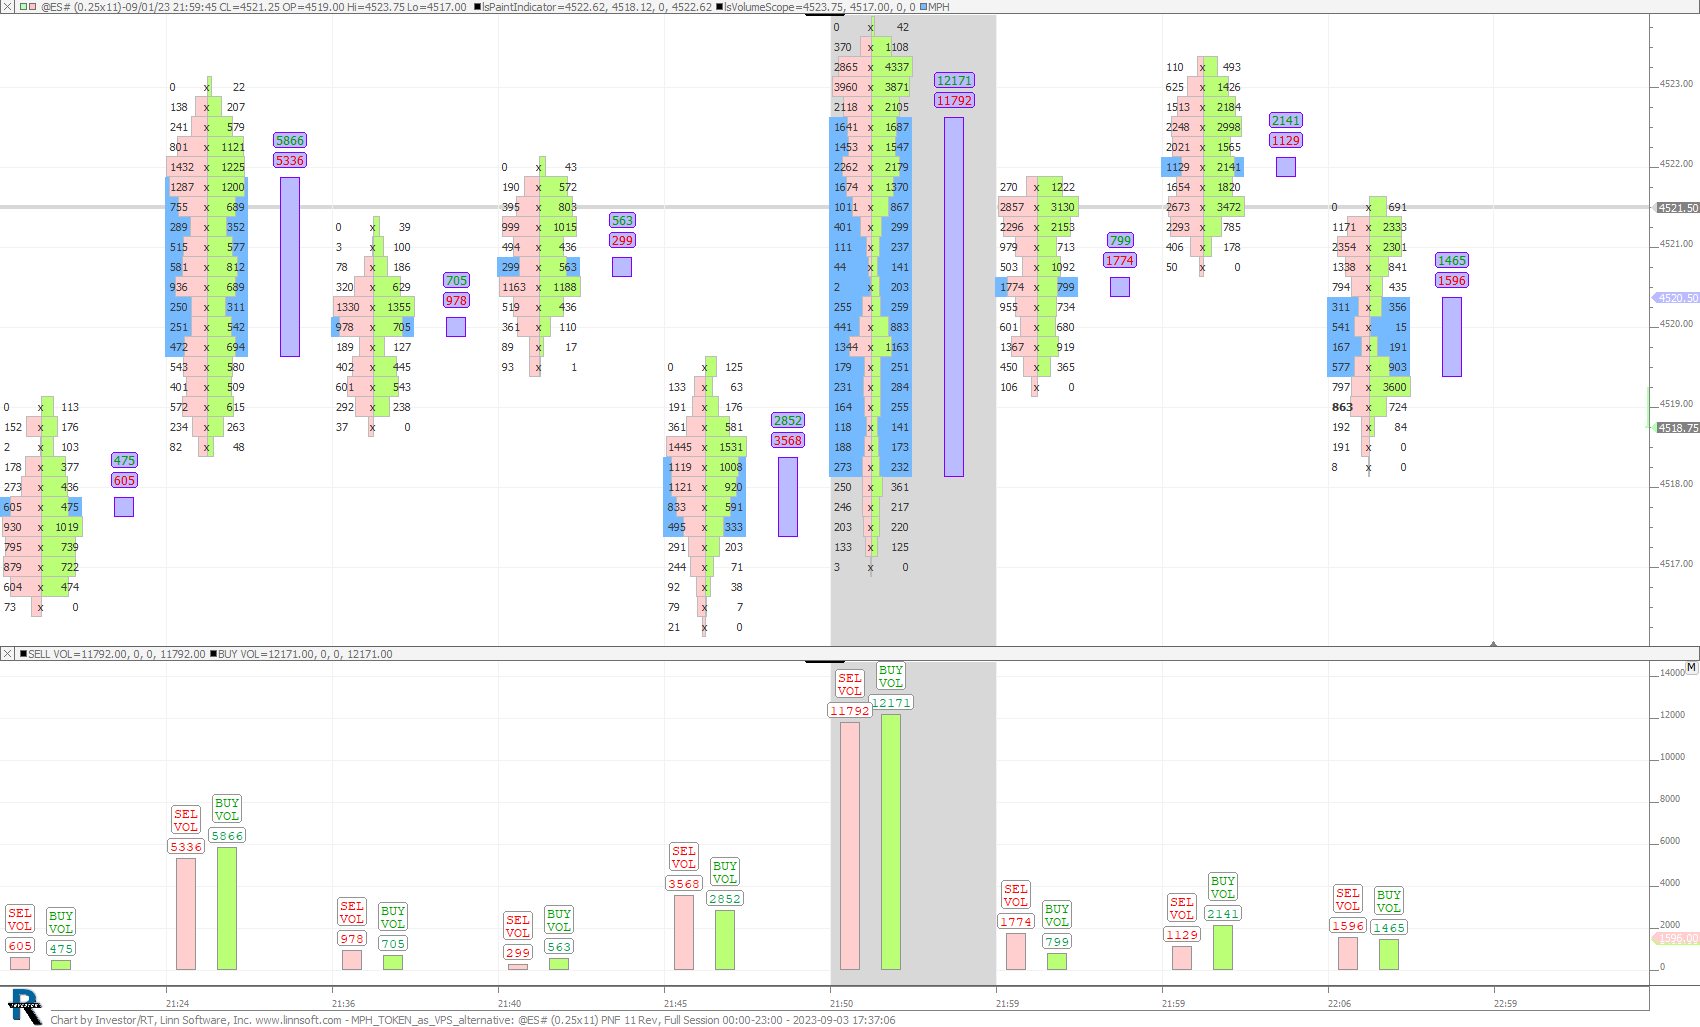 |
MPH TOKEN as VPS alternative (@ES#) Eddy_F [totalcount]
1 year 7 months ago
How to use the MPH token to get any kind of volume at price information. This chart was uploaded by Investor/RT 15.1.16 showing symbol: @ES#. |
View |
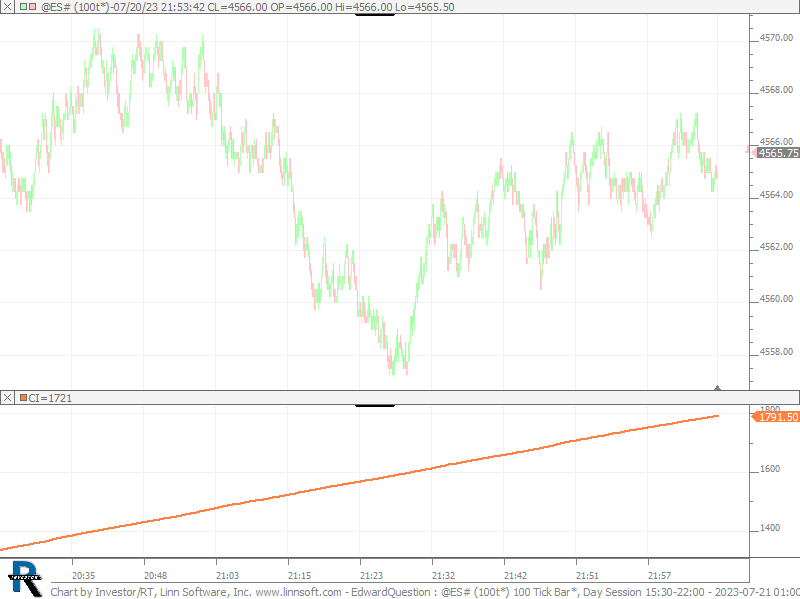 |
EdwardQuestion (@ES#) Eddy_F [totalcount]
1 year 9 months ago
SUM OF BAR RGE over a session. This chart was uploaded by Investor/RT 15.1.16 showing symbol: @ES#. |
View |
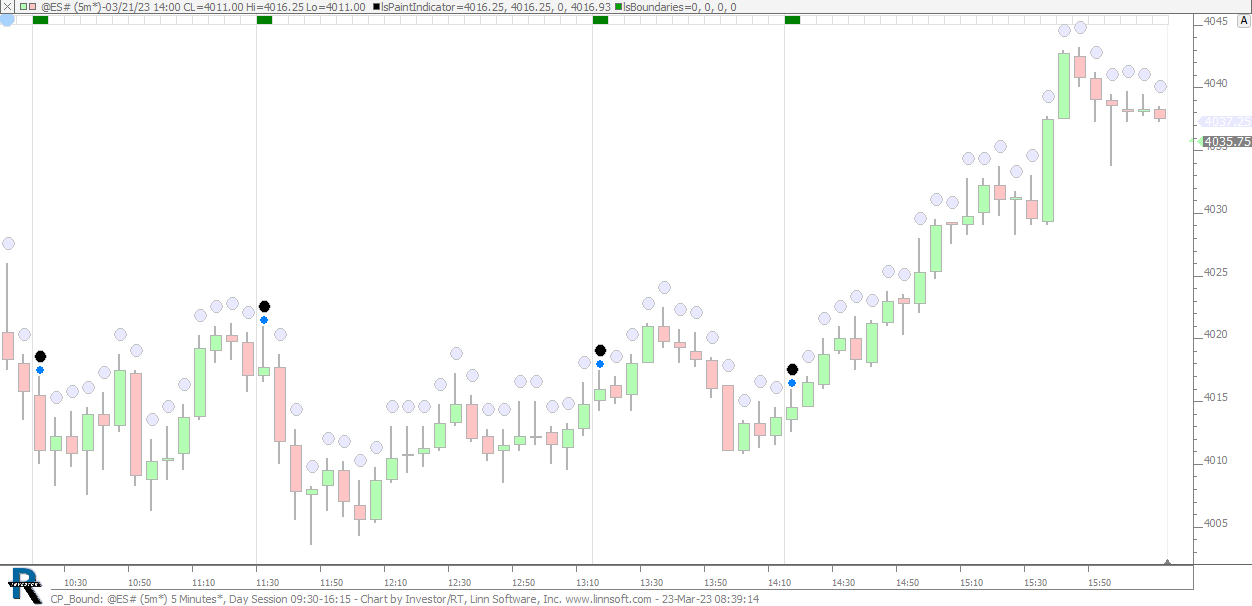 |
CP Bound (@ES#) cpayne [totalcount]
2 years 3 weeks ago
This chart was uploaded by Investor/RT 15.1.15 showing symbol: @ES#. |
View |
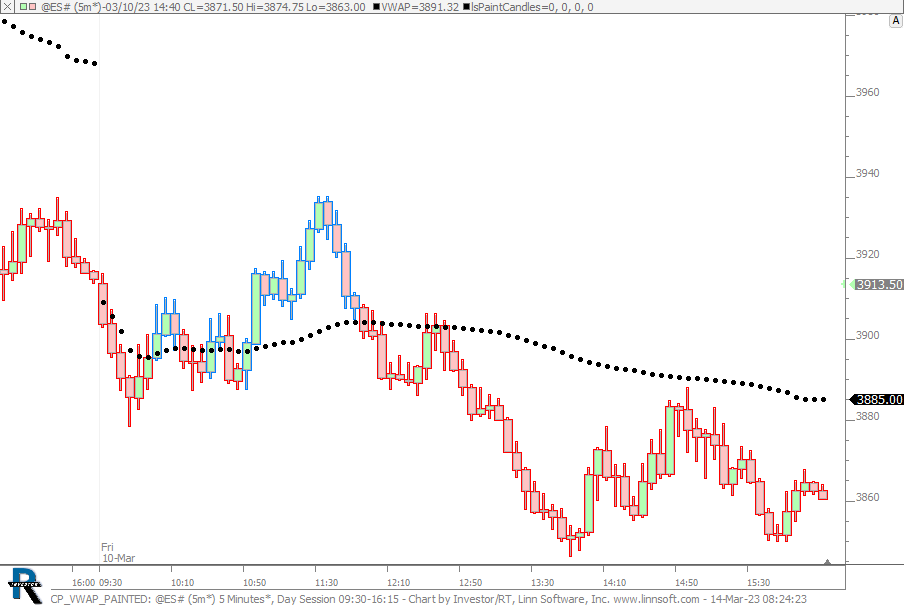 |
CP VWAP PAINTED (@ES#) cpayne [totalcount]
2 years 1 month ago
Paints border of candles based on whether bar closes above or below daily VWAP. This chart was uploaded by Investor/RT 15.1.15 showing symbol: @ES#. |
View |
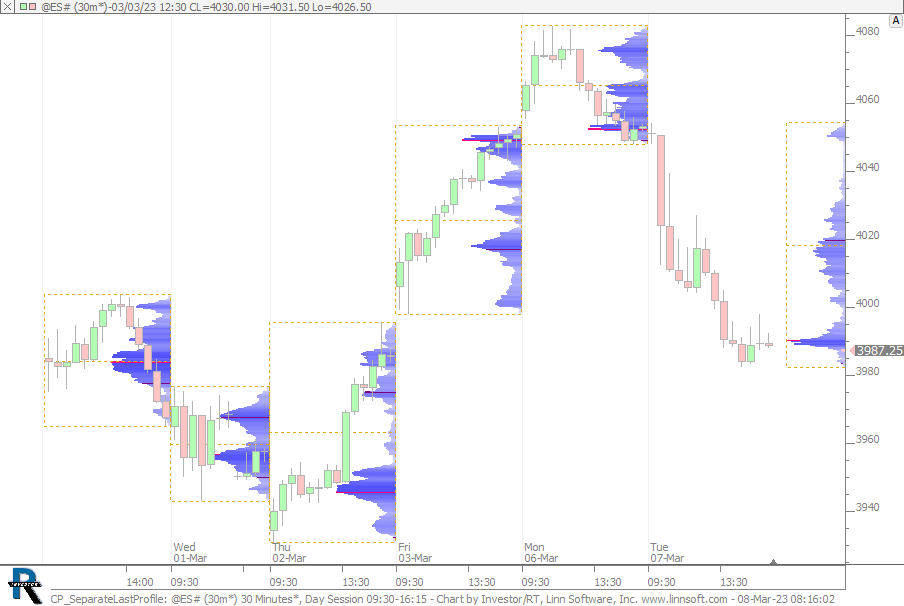 |
CP SeparateLastProfile (@ES#) cpayne [totalcount]
2 years 1 month ago
Chart demonstrates how to separate last profile (with another instance of Profile indicator) to move it off the current bars. |
View |
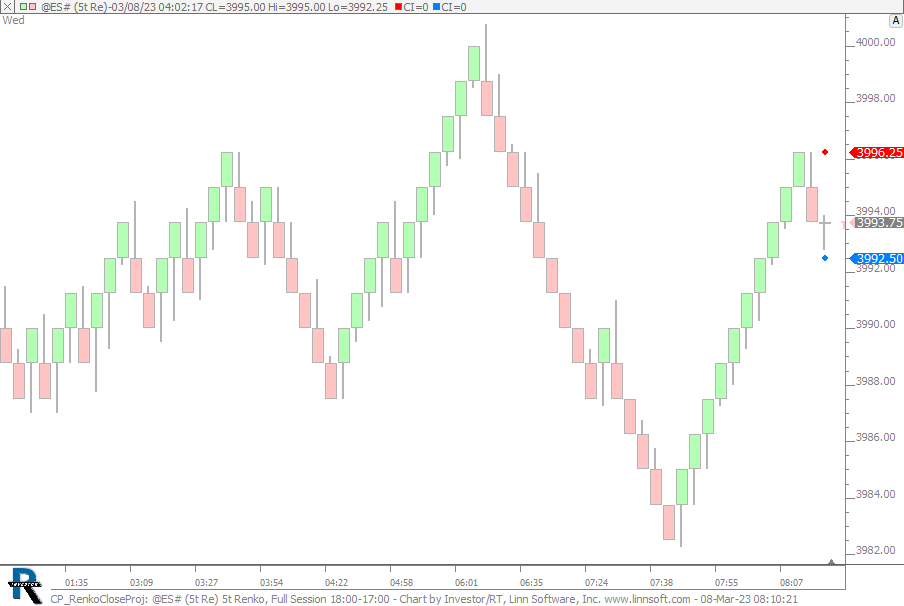 |
CP RenkoCloseProj (@ES#) cpayne [totalcount]
2 years 1 month ago
Projects the closing prices of Renko bars. This chart was uploaded by Investor/RT 15.1.15 showing symbol: @ES#. |
View |
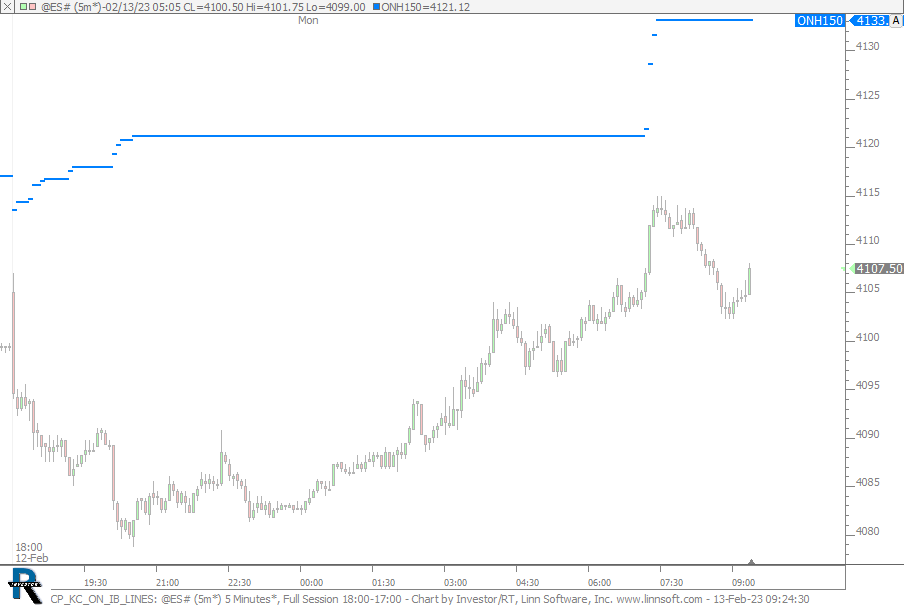 |
CP KC ON IB LINES (@ES#) cpayne [totalcount]
2 years 2 months ago
Overnight and IB Multiple Lines. This chart was uploaded by Investor/RT 15.1.15 showing symbol: @ES#. |
View |
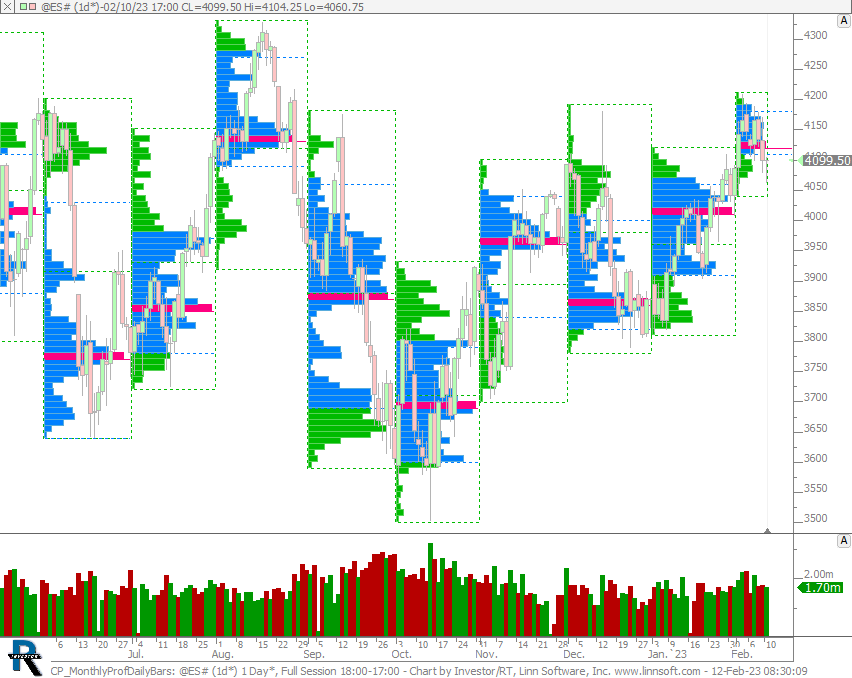 |
CP MonthlyProfDailyBars (@ES#) cpayne [totalcount]
2 years 2 months ago
Monthly Profiles Daily Bars. This chart was uploaded by Investor/RT 15.1.15 showing symbol: @ES#. |
View |