 |
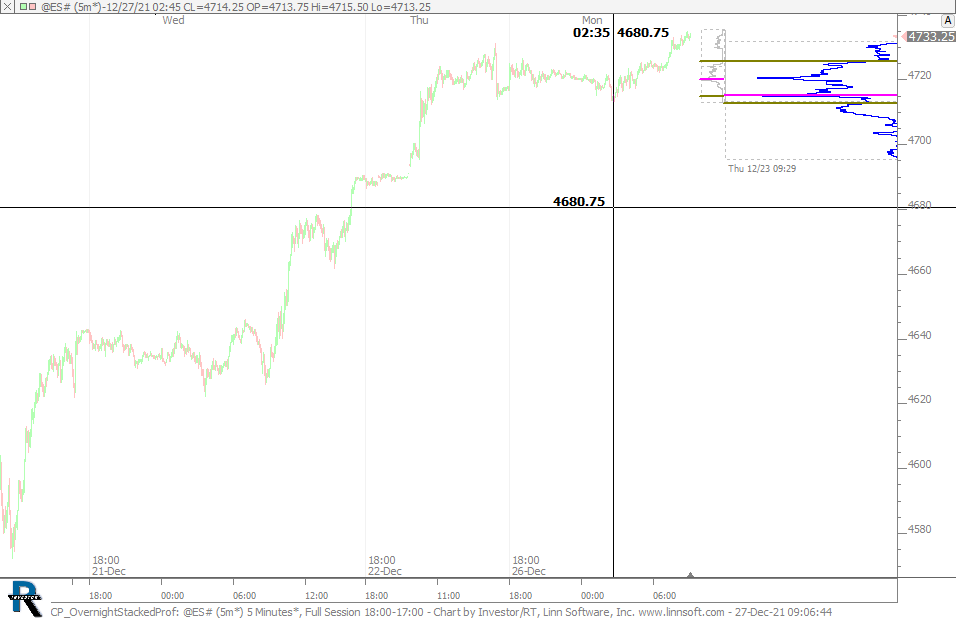
CP OvernightStackedProf (@ES#) cpayne [totalcount]
3 years 3 months ago
This chart was uploaded by Investor/RT 15.1.1 showing symbol: @ES#. |
View |
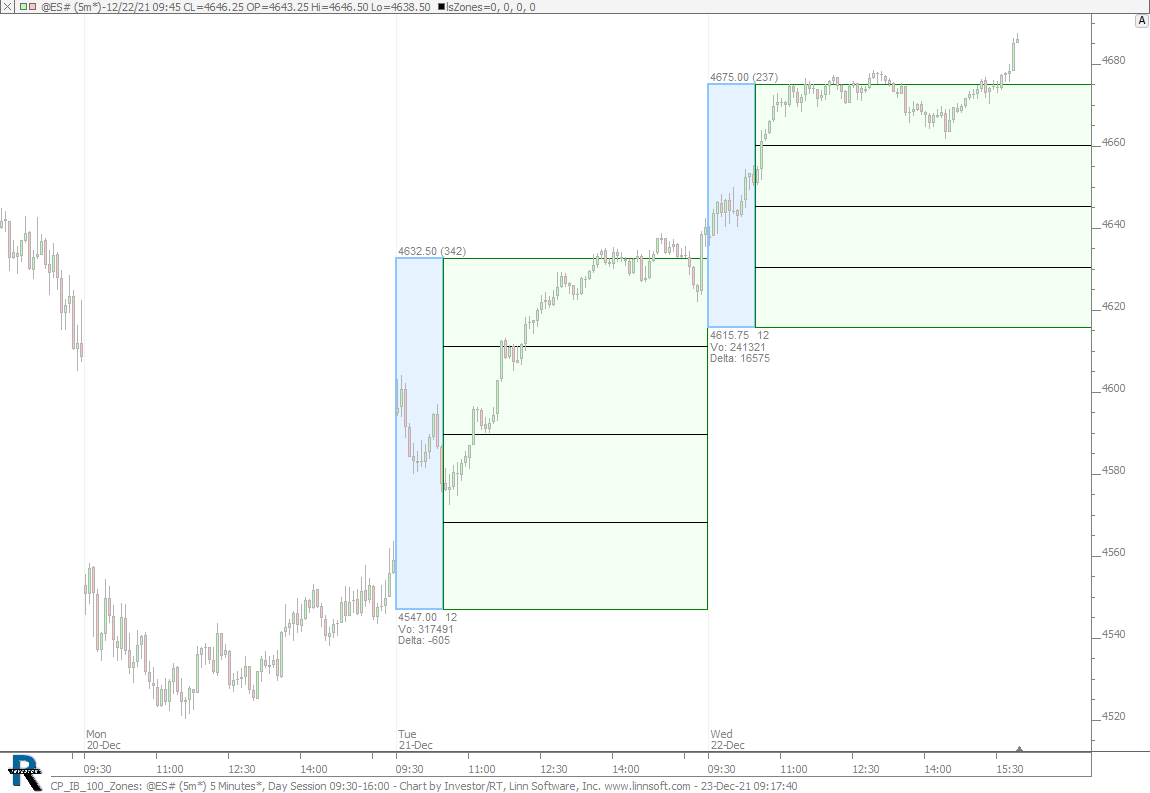 |
CP IB 100 Zones (@ES#) cpayne [totalcount]
3 years 3 months ago
This chart was uploaded by Investor/RT 15.1.1 showing symbol: @ES#. |
View |
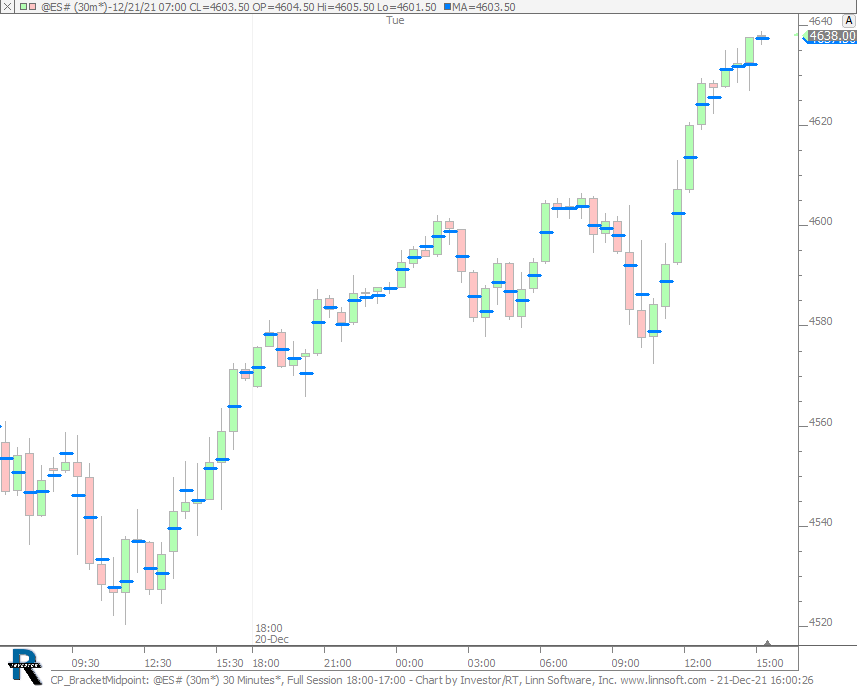 |
CP BracketMidpoint (@ES#) cpayne [totalcount]
3 years 4 months ago
This chart was uploaded by Investor/RT 15.1.1 showing symbol: @ES#. |
View |
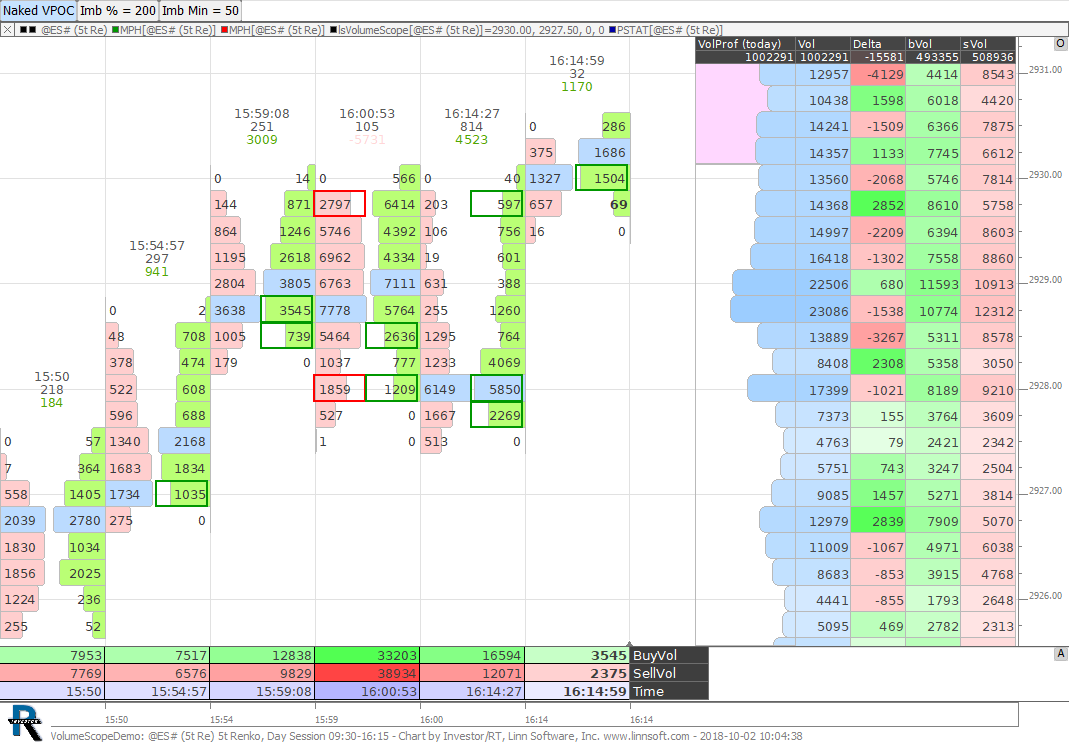 |
VolumeScope® Demo (@ES#) cpayne [totalcount]
6 years 6 months ago
VolumeScope® Demo Chart. This chart was uploaded by Investor/RT 13.1.1 showing symbol: @ES#. |
View |
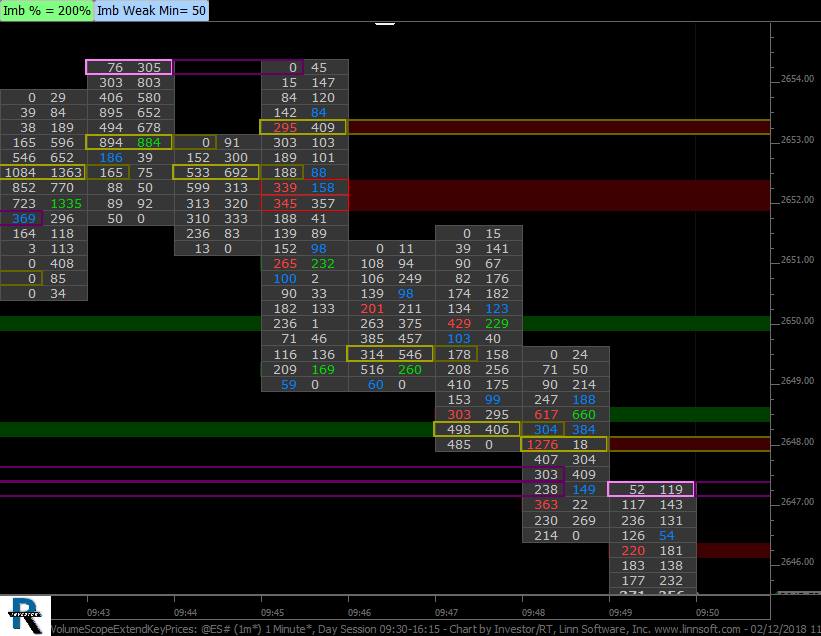 |
VolumeScopeExtendKeyPrices (@ES#) cpayne [totalcount]
7 years 2 months ago
Chart uses Multiple Price Highlighter to extend key prices while naked. Prices extended include VPOC (gold), Buy Imbalance (green), Sell Imbalance (red) and Unfinished Business (pink). |
View |
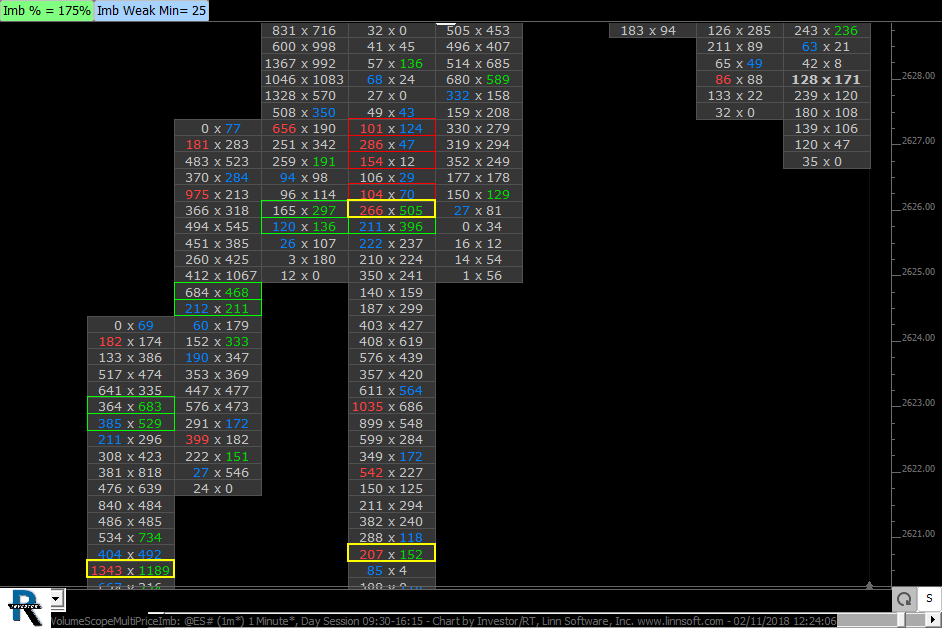 |
VolumeScopeMultiPriceImb (@ES#) cpayne [totalcount]
7 years 2 months ago
PVP Identifies multi-price imblance with red and green boxex around prices. This chart was uploaded by Investor/RT 13.2.2 showing symbol: @ES#. |
View |
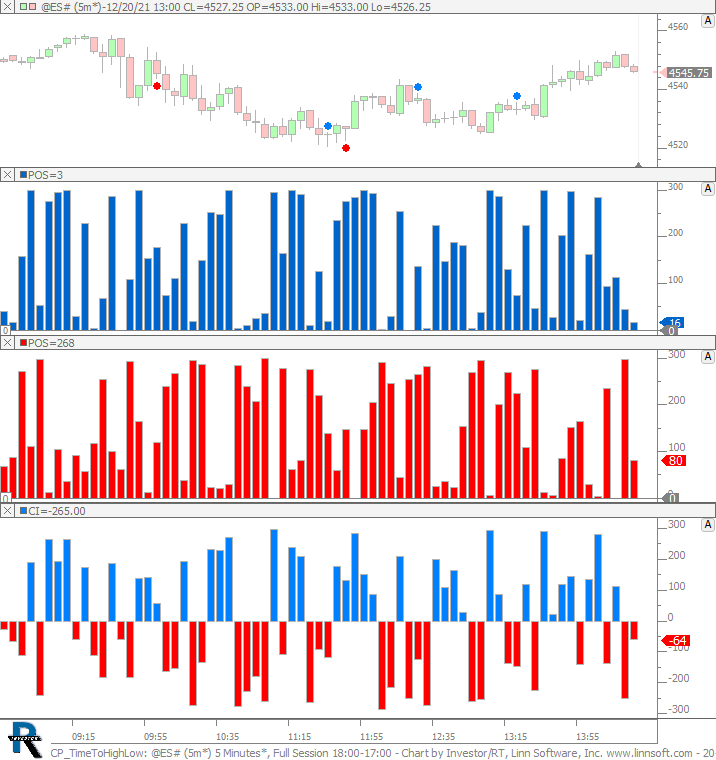 |
CP TimeToHighLow (@ES#) cpayne [totalcount]
3 years 4 months ago
This chart was uploaded by Investor/RT 15.1.1 showing symbol: @ES#. |
View |
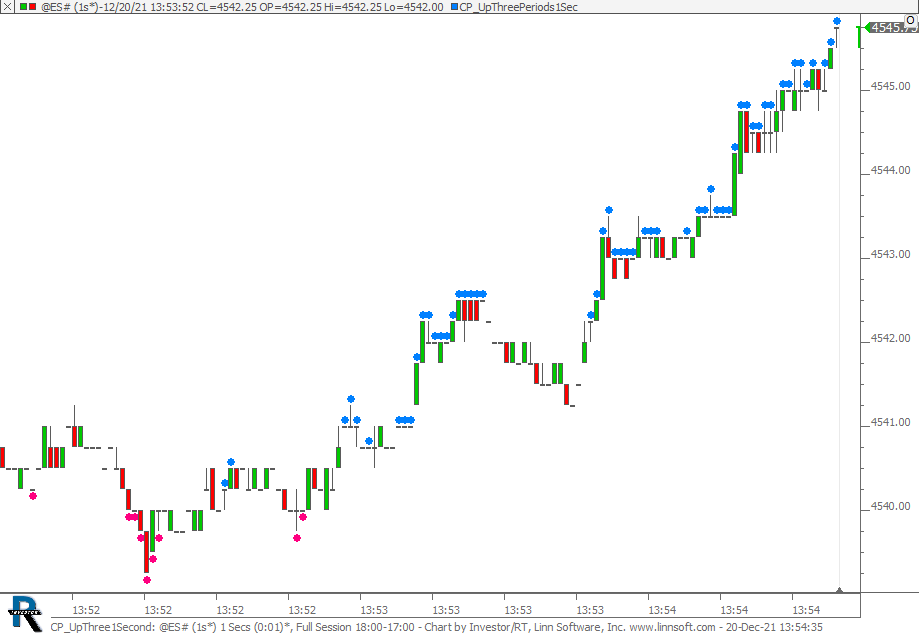 |
CP UpThree1Second (@ES#) cpayne [totalcount]
3 years 4 months ago
This chart was uploaded by Investor/RT 15.1.1 showing symbol: @ES#. |
View |
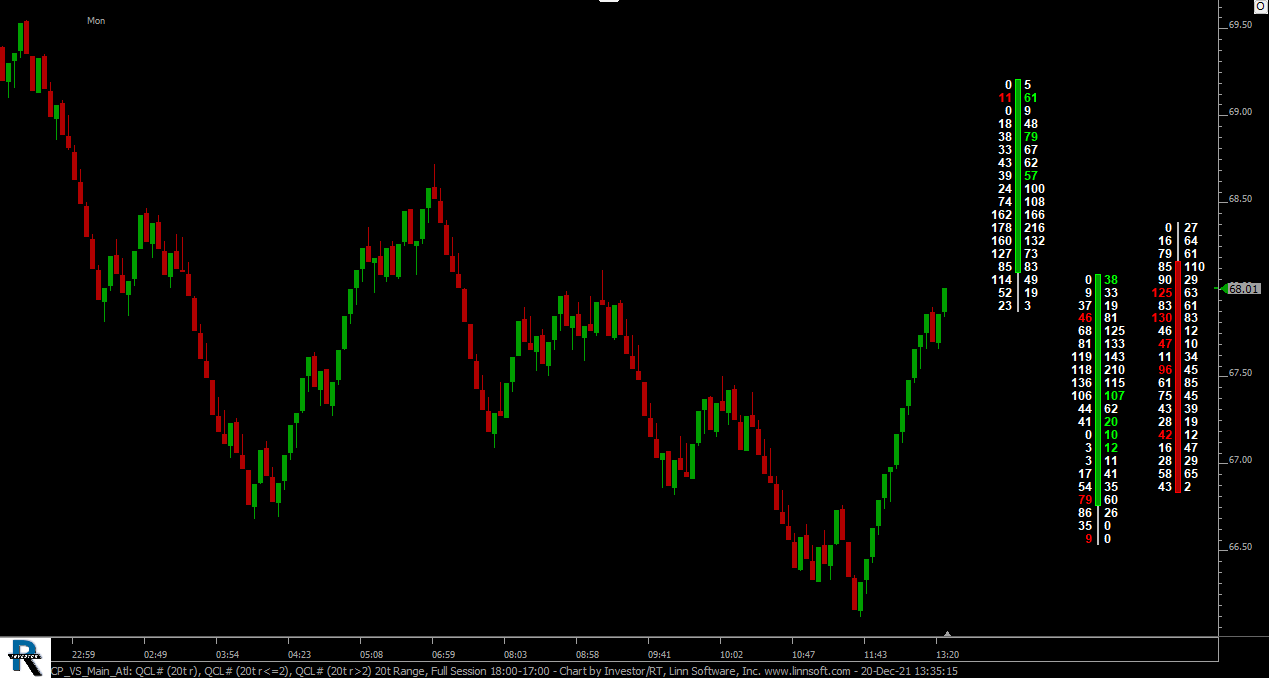 |
CP VS Main Atl (QCL#) cpayne [totalcount]
3 years 4 months ago
This chart was uploaded by Investor/RT 15.1.1 showing symbol: QCL#. |
View |
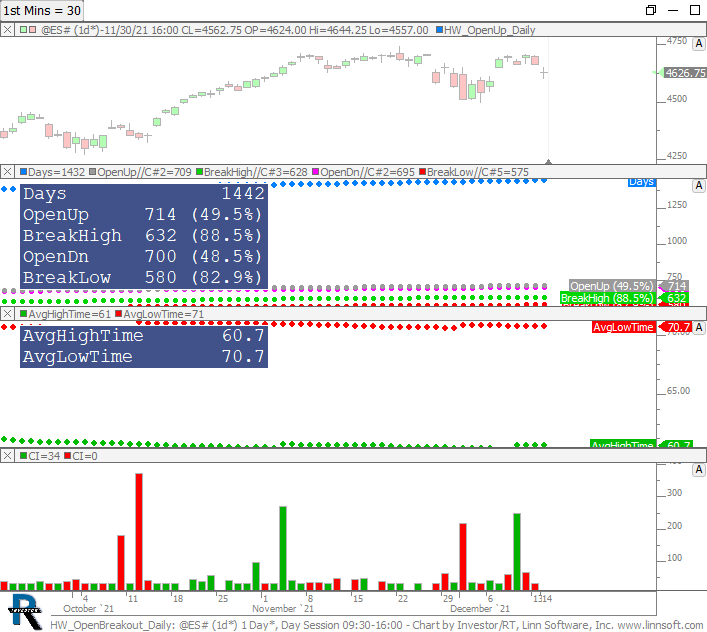 |
HW OpenBreakout Daily (@ES#) cpayne [totalcount]
3 years 4 months ago
Homework - Open Period Breakout Statistics. This chart was uploaded by Investor/RT 12.7.1 showing symbol: @ES#. |
View |
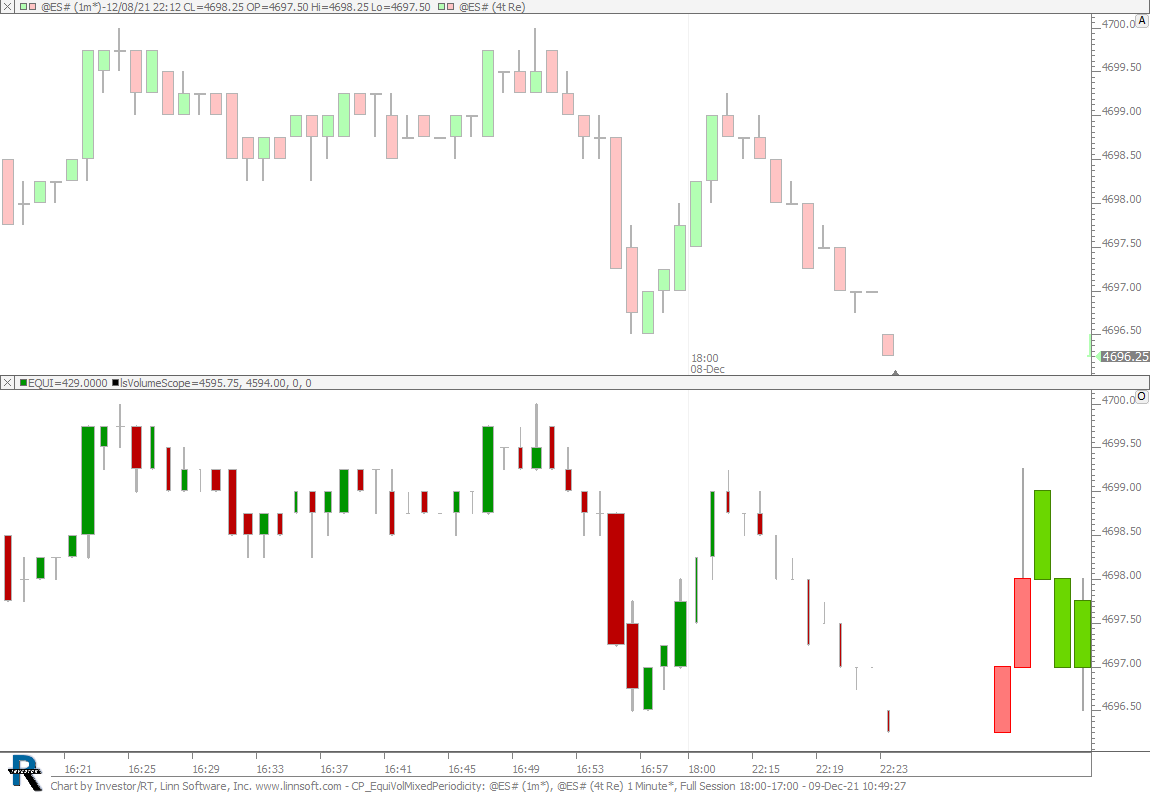 |
CP EquiVolMixedPeriodicity (@ES#) cpayne [totalcount]
3 years 4 months ago
This chart was uploaded by Investor/RT 14.2.8 showing symbol: @ES#. |
View |
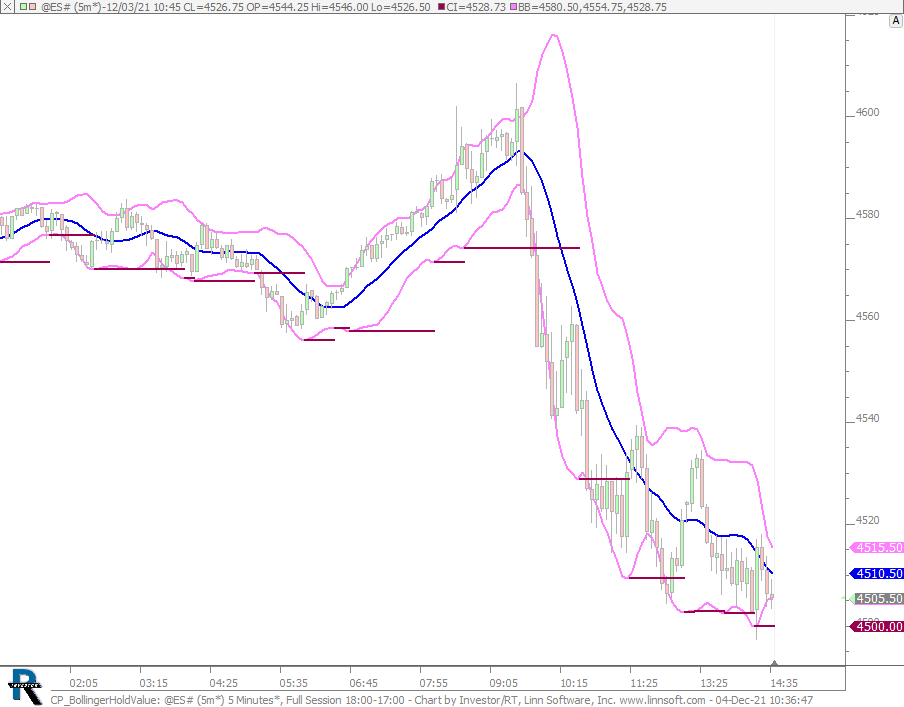 |
CP BollingerHoldValue (@ES#) cpayne [totalcount]
3 years 4 months ago
This chart was uploaded by Investor/RT 15.1.1 showing symbol: @ES#. |
View |
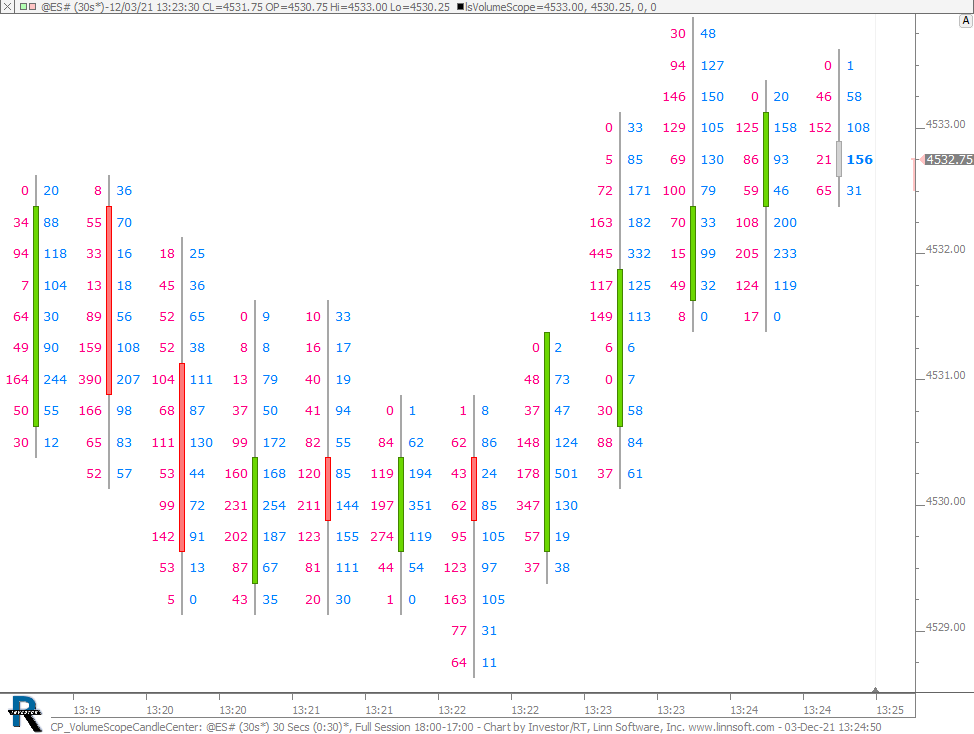 |
CP VolumeScopeCandleCenter (@ES#) cpayne [totalcount]
3 years 4 months ago
VolumeScope with candle between bid and ask. This chart was uploaded by Investor/RT 15.1.1 showing symbol: @ES#. |
View |
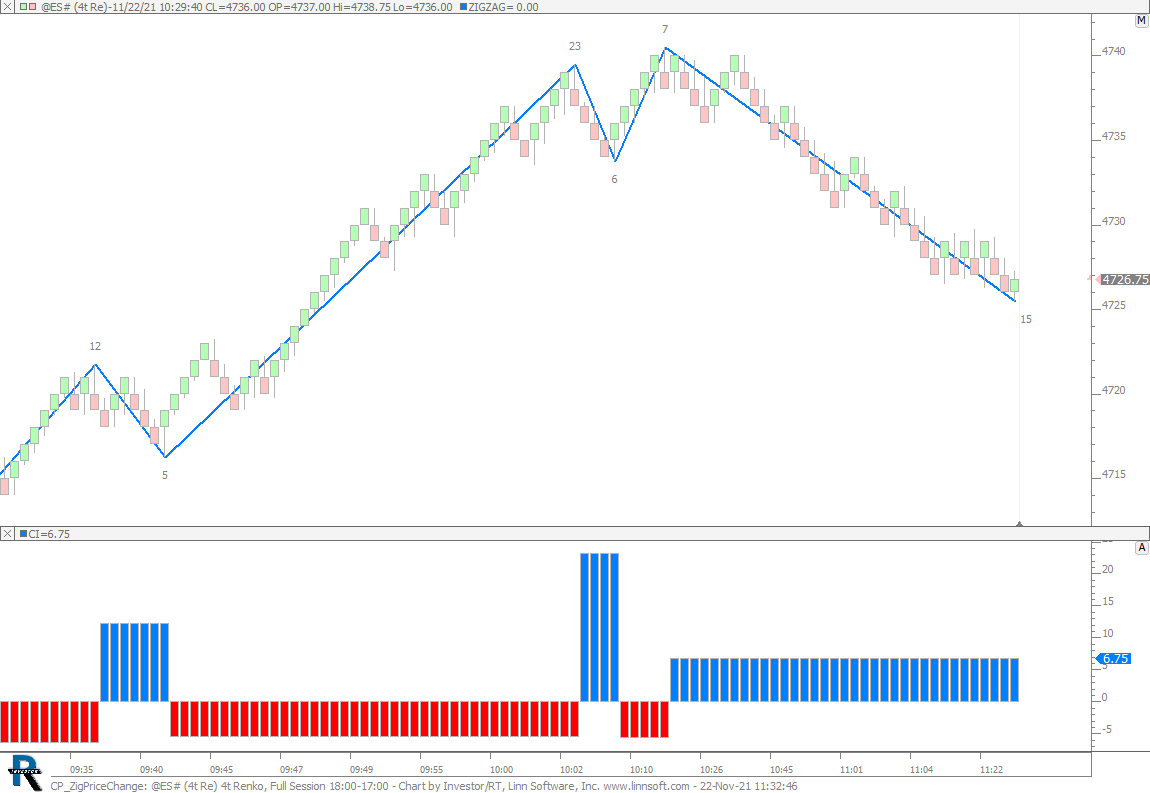 |
CP ZigPriceChange (@ES#) cpayne [totalcount]
3 years 4 months ago
This chart was uploaded by Investor/RT 15.1.1 showing symbol: @ES#. |
View |
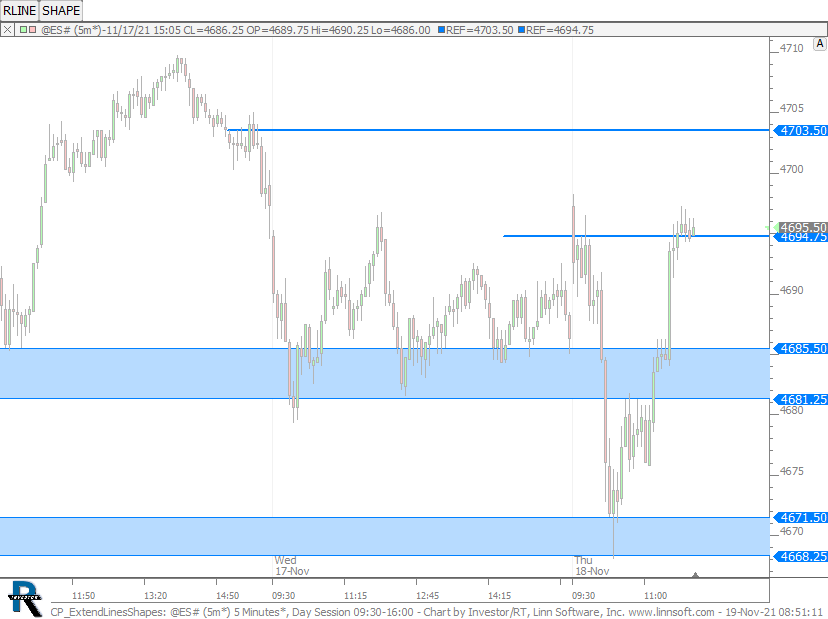 |
CP ExtendLinesShapes (@ES#) cpayne [totalcount]
3 years 5 months ago
This chart was uploaded by Investor/RT 15.1.1 showing symbol: @ES#. |
View |
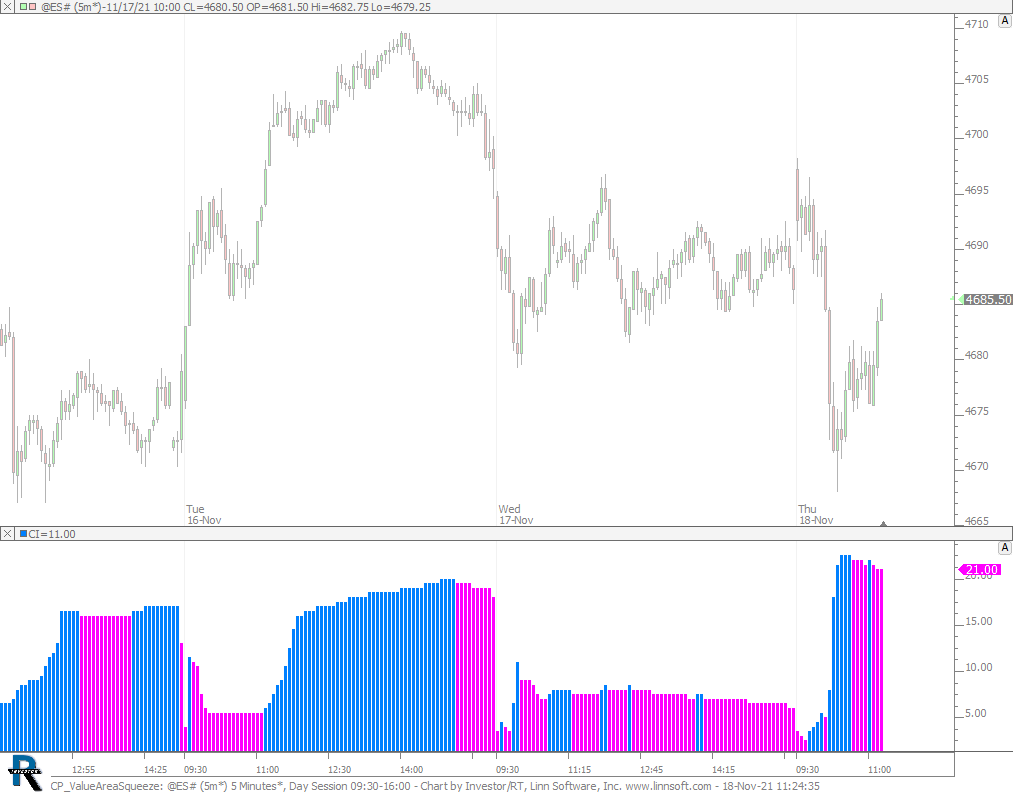 |
CP ValueAreaSqueeze (@ES#) cpayne [totalcount]
3 years 5 months ago
Value Area Squeeze. This chart was uploaded by Investor/RT 15.1.1 showing symbol: @ES#. |
View |
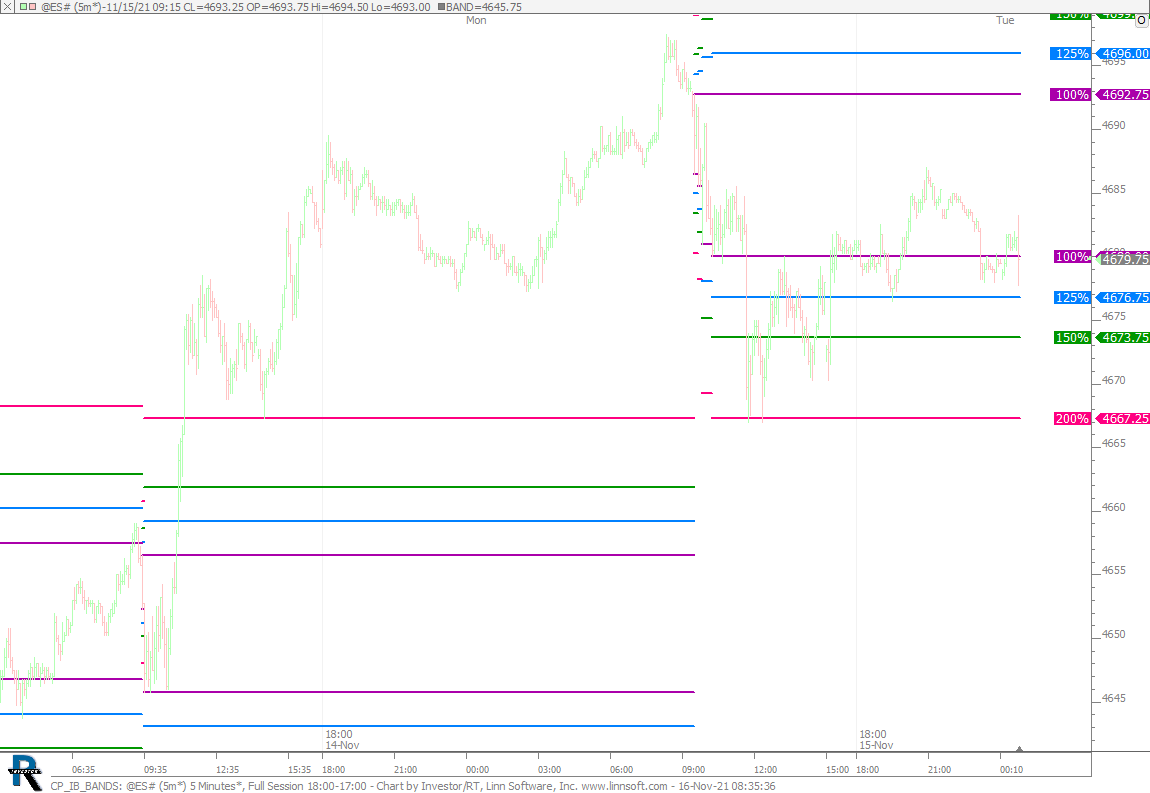 |
CP IB BANDS (@ES#) cpayne [totalcount]
3 years 5 months ago
Initial Balance Bands. This chart was uploaded by Investor/RT 15.1.1 showing symbol: @ES#. |
View |
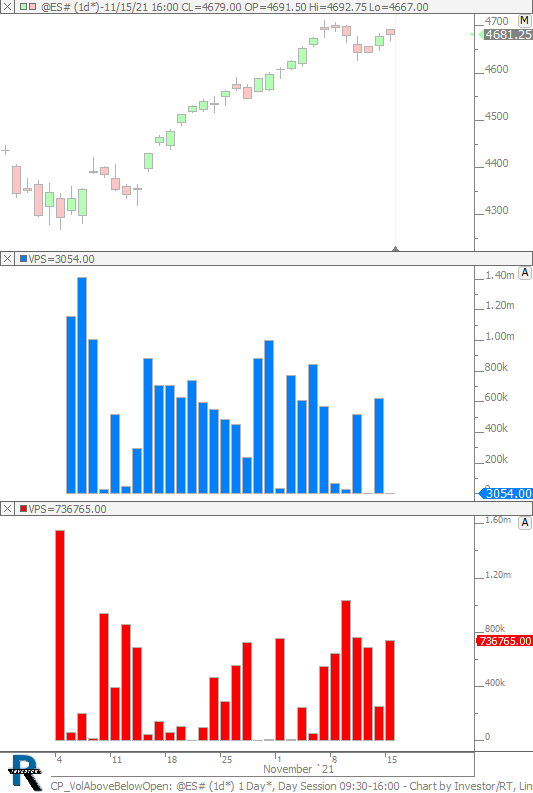 |
CP VolAboveBelowOpen (@ES#) cpayne [totalcount]
3 years 5 months ago
This chart was uploaded by Investor/RT 15.1.1 showing symbol: @ES#. |
View |
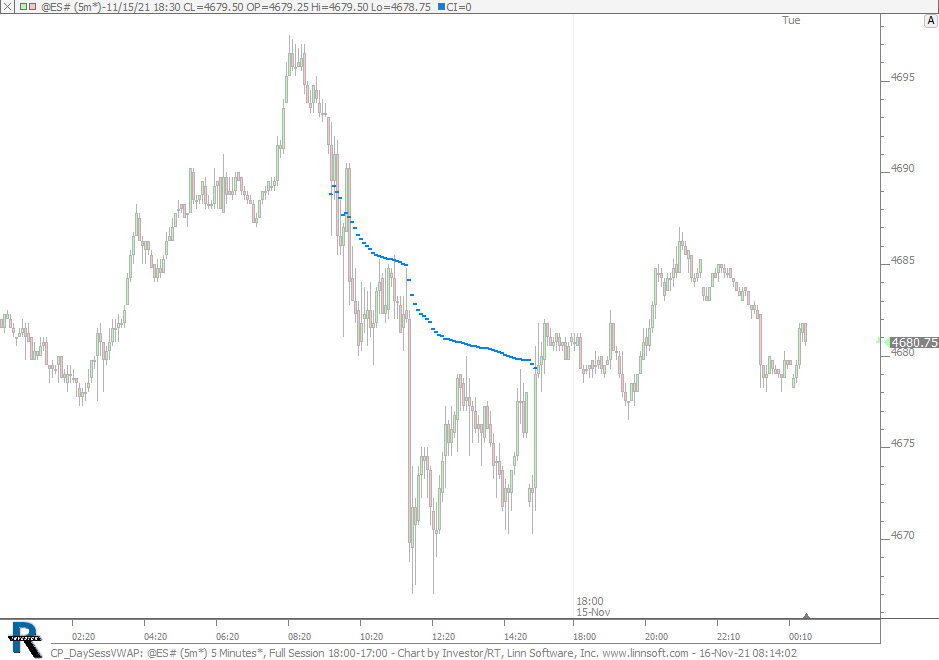 |
CP DaySessVWAP (@ES#) cpayne [totalcount]
3 years 5 months ago
This chart was uploaded by Investor/RT 15.1.1 showing symbol: @ES#. |
View |
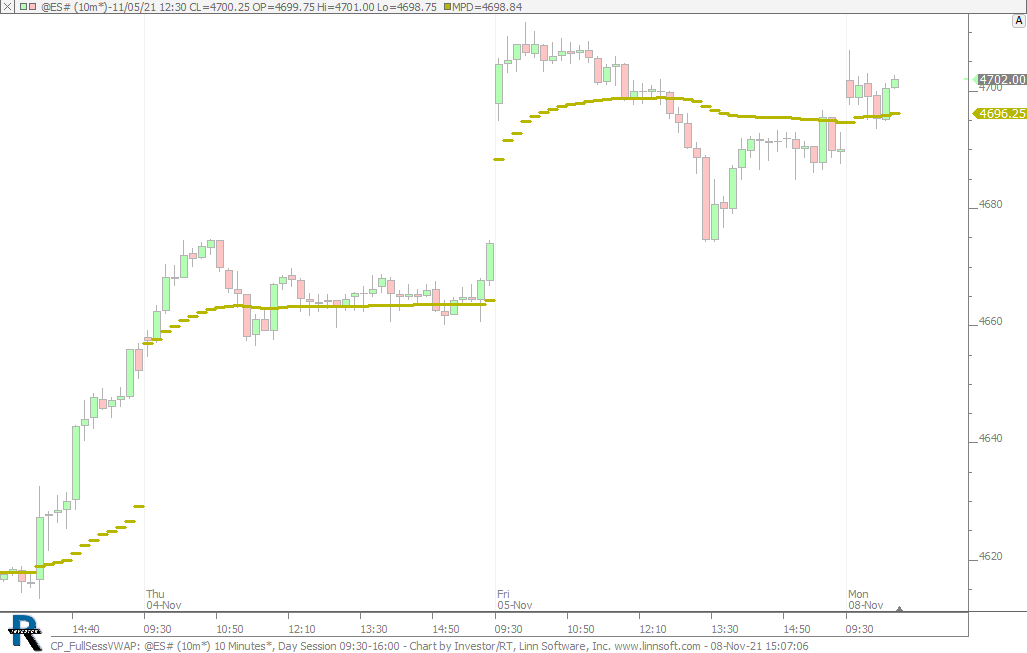 |
CP FullSessVWAP (@ES#) cpayne [totalcount]
3 years 5 months ago
Full Session VWAP on Day Session Chart. This chart was uploaded by Investor/RT 15.1.1 showing symbol: @ES#. |
View |
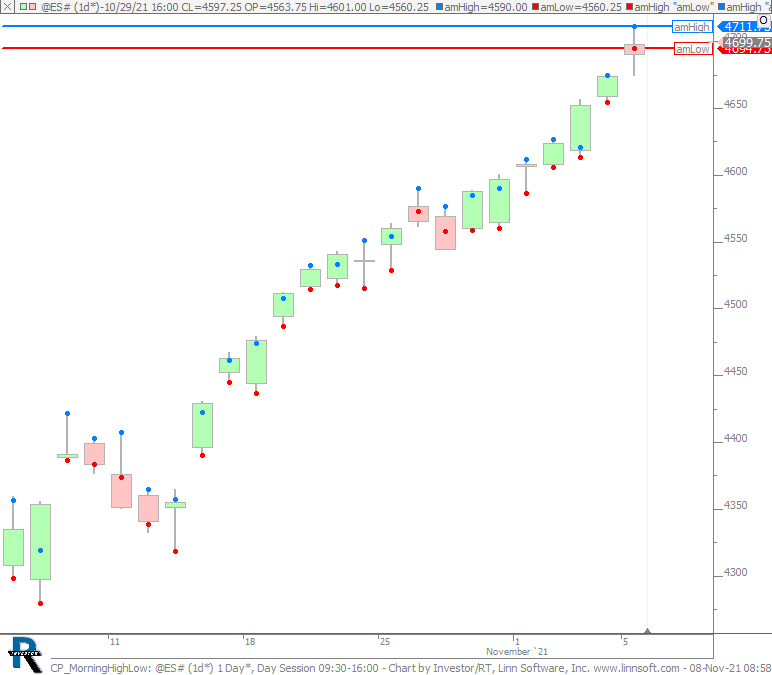 |
CP MorningHighLow (@ES#) cpayne [totalcount]
3 years 5 months ago
This chart was uploaded by Investor/RT 15.1.1 showing symbol: @ES#. |
View |
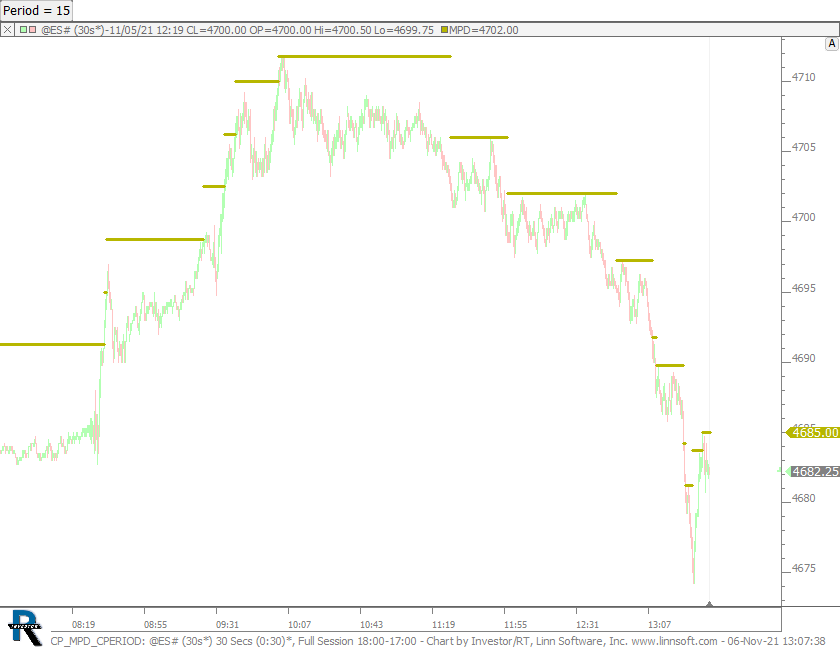 |
CP MPD CPERIOD (@ES#) cpayne [totalcount]
3 years 5 months ago
This chart was uploaded by Investor/RT 15.1.1 showing symbol: @ES#. |
View |
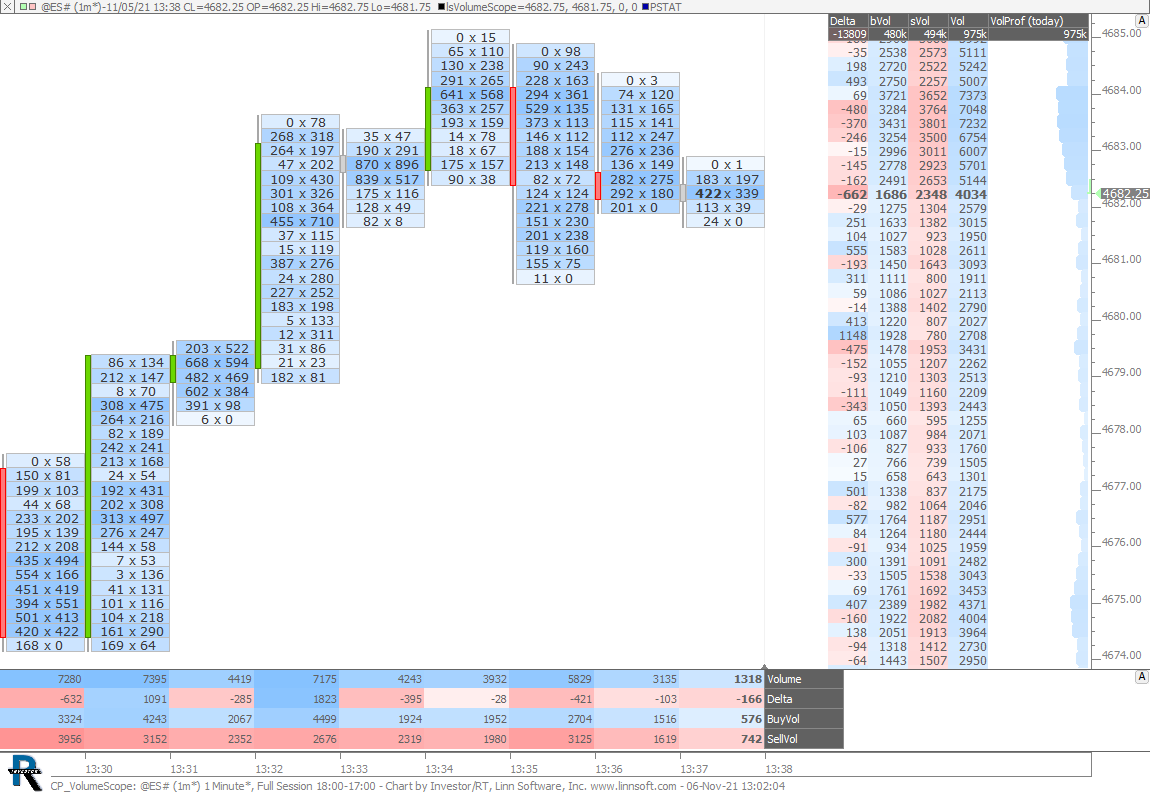 |
CP VolumeScope (@ES#) cpayne [totalcount]
3 years 5 months ago
This chart was uploaded by Investor/RT 15.1.1 showing symbol: @ES#. |
View |
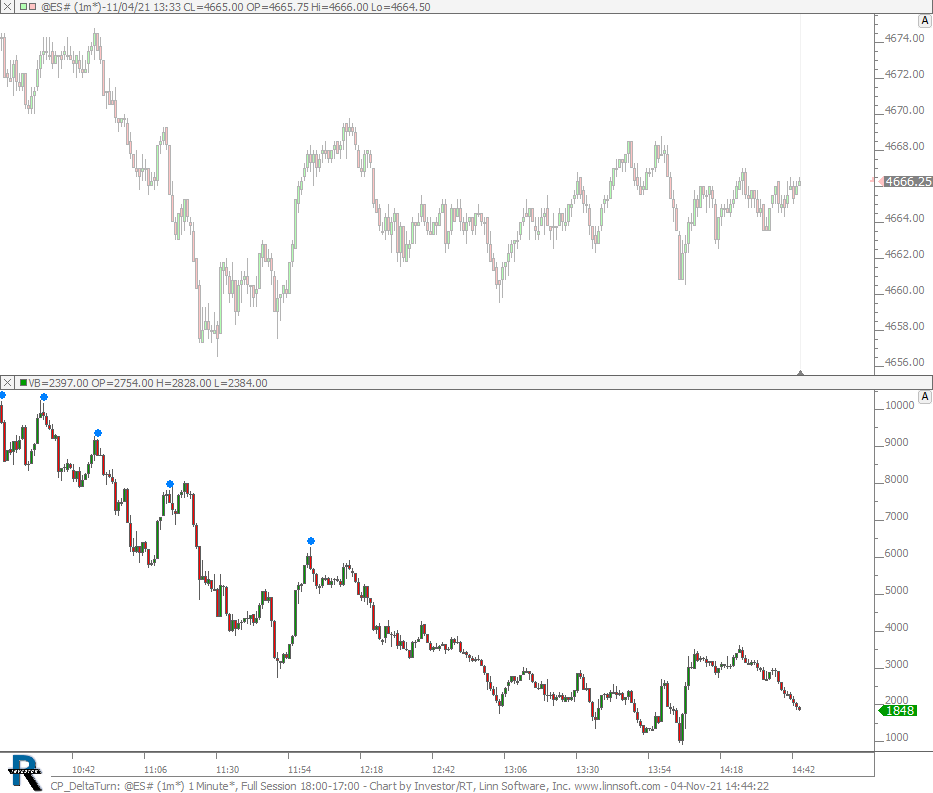 |
CP DeltaTurn (@ES#) cpayne [totalcount]
3 years 5 months ago
5 Up Delta Bars followed by 1 Down Delta Bar. This chart was uploaded by Investor/RT 15.1.1 showing symbol: @ES#. |
View |
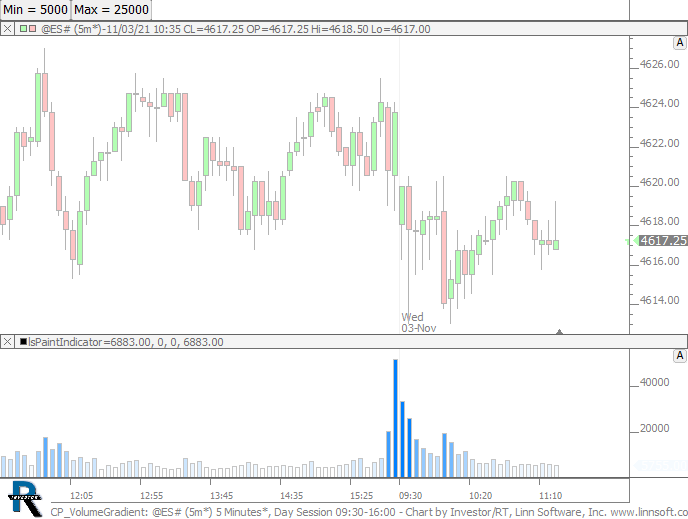 |
CP VolumeGradient (@ES#) cpayne [totalcount]
3 years 5 months ago
This chart was uploaded by Investor/RT 15.1.1 showing symbol: @ES#. |
View |