 |
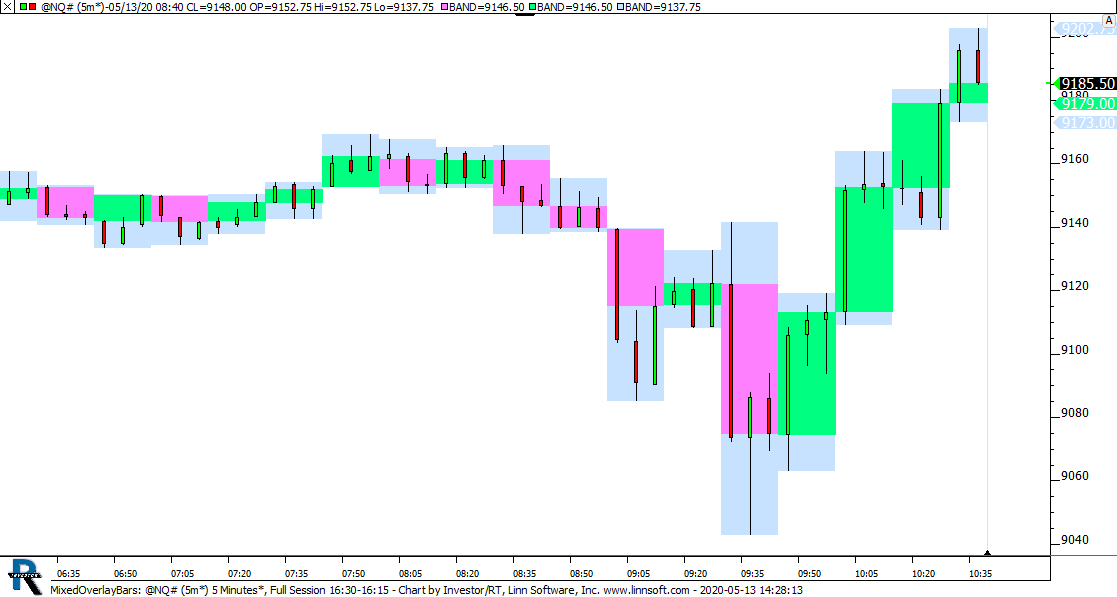
MixedOverlayBars (@NQ#) cpayne [totalcount]
4 years 11 months ago
15 Min Candles on 5 Min Candles. This chart was uploaded by Investor/RT 14.1.7 showing symbol: @NQ#. |
View |
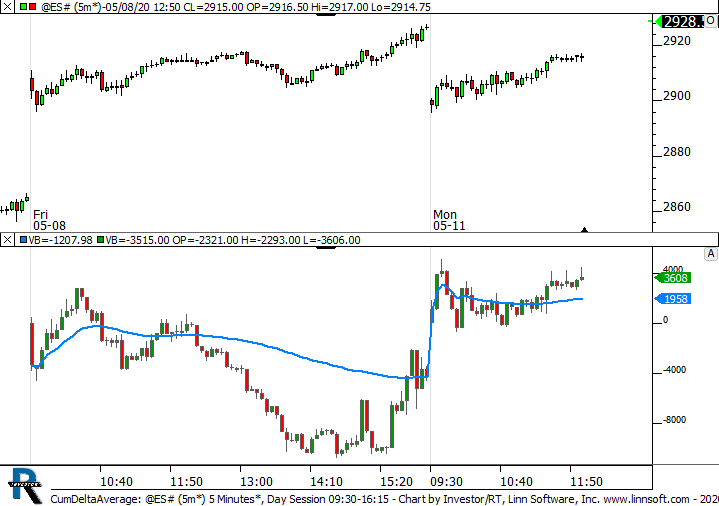 |
CumDeltaAverage (@ES#) cpayne [totalcount]
4 years 11 months ago
Cumulative Detla with Moving Average. This chart was uploaded by Investor/RT 14.1.7 showing symbol: @ES#. |
View |
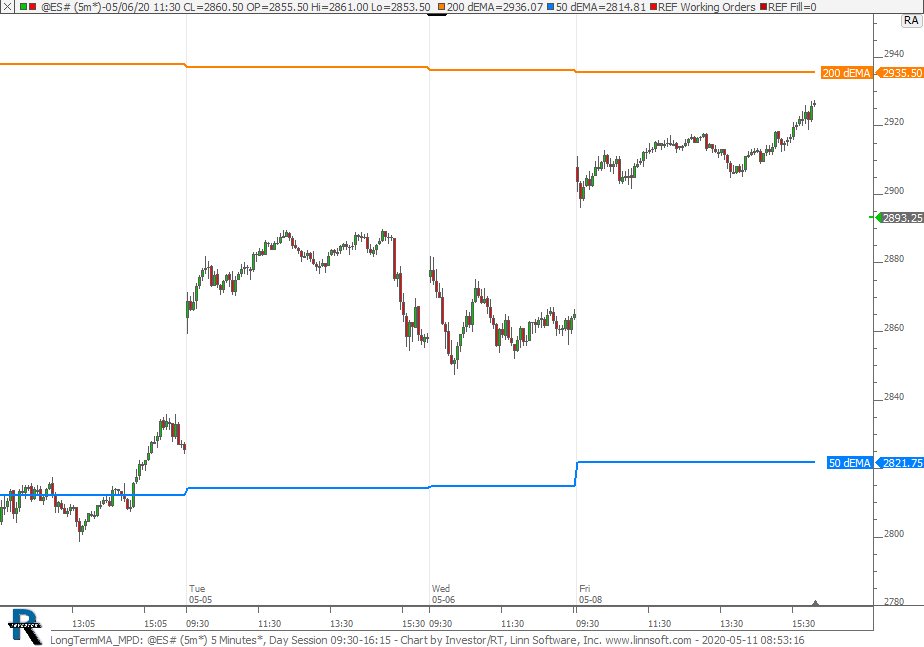 |
LongTermMA MPD (@ES#) cpayne [totalcount]
4 years 11 months ago
Longer Term - Daily 50 and 200 EMA on Intraday Chart. This chart was uploaded by Investor/RT 14.1.7 showing symbol: @ES#. |
View |
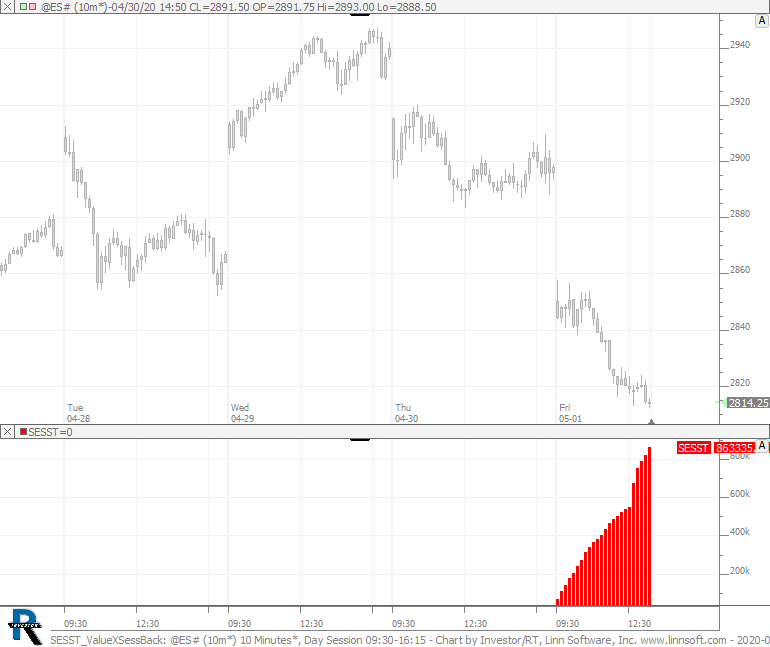 |
SESST ValueXSessBack (@ES#) cpayne [totalcount]
4 years 11 months ago
This chart was uploaded by Investor/RT 14.1.6 showing symbol: @ES#. |
View |
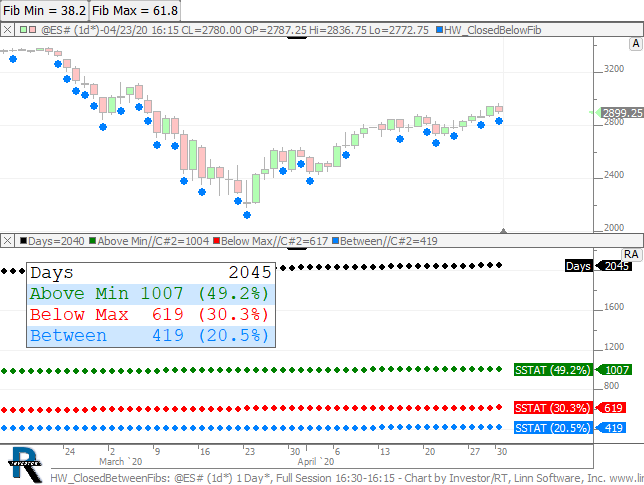 |
HW ClosedBetweenFibs (@ES#) cpayne [totalcount]
4 years 11 months ago
Close Between Fib Levels. This chart was uploaded by Investor/RT 14.1.6 showing symbol: @ES#. |
View |
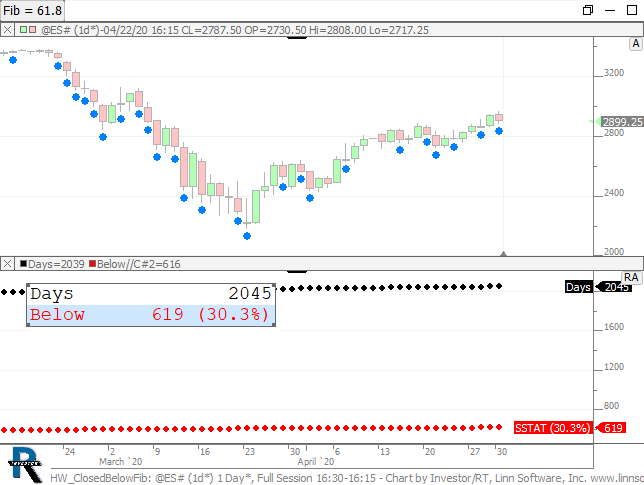 |
HW ClosedBelowFib (@ES#) cpayne [totalcount]
4 years 11 months ago
Close Below Fibonacci Level Statistics. This chart was uploaded by Investor/RT 14.1.6 showing symbol: @ES#. |
View |
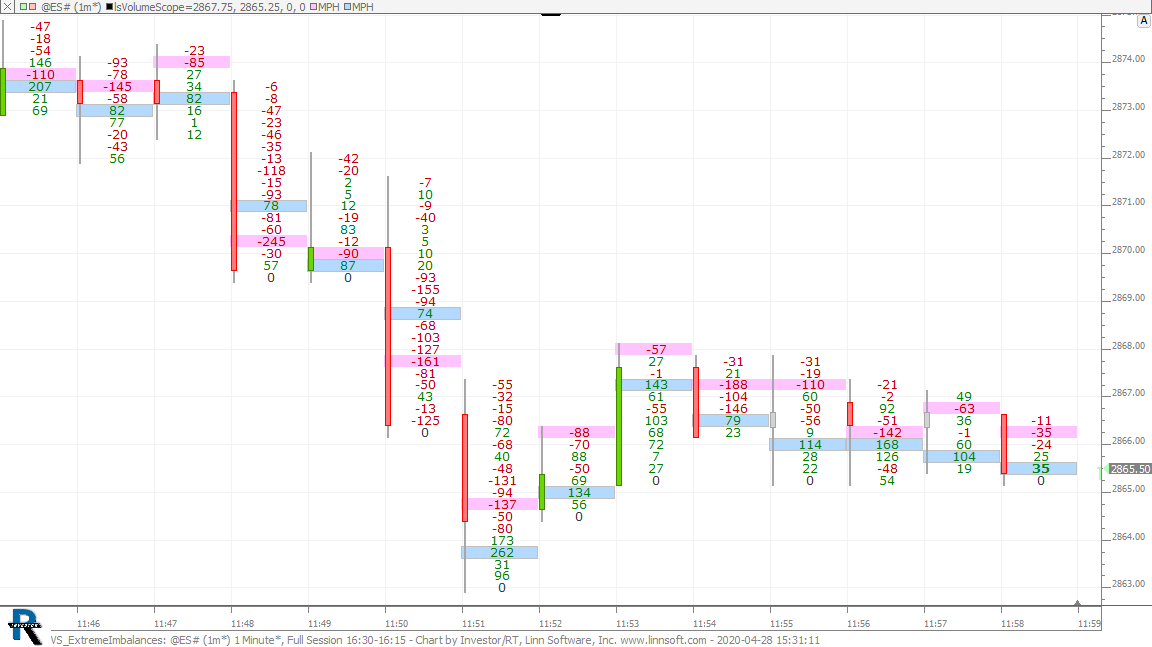 |
VS ExtremeImbalances (@ES#) cpayne [totalcount]
4 years 11 months ago
Highest and Lowest Imbalance in each bar. This chart was uploaded by Investor/RT 14.1.6 showing symbol: @ES#. |
View |
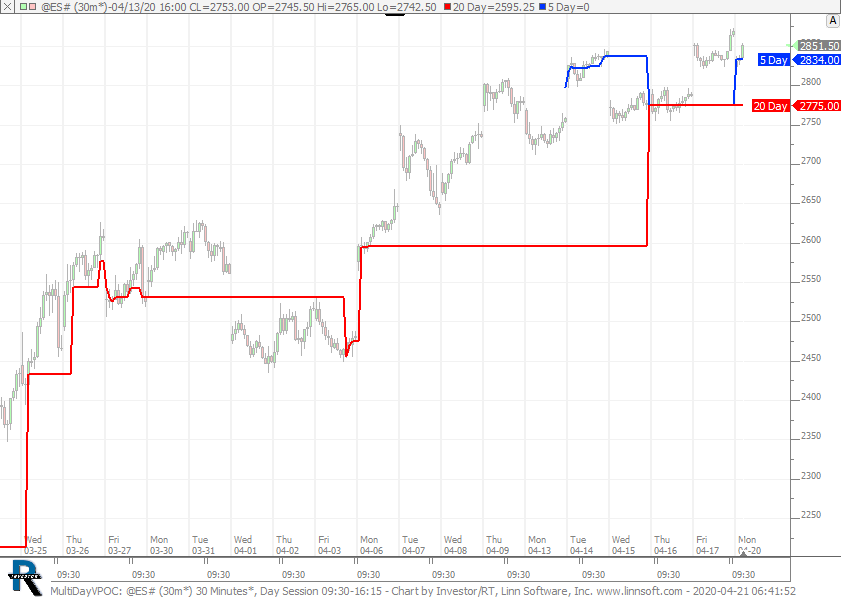 |
MultiDayVPOC (@ES#) cpayne [totalcount]
5 years 9 hours ago
Developing 5 and 20 Day VPOC. This chart was uploaded by Investor/RT 14.1.5 showing symbol: @ES#. |
View |
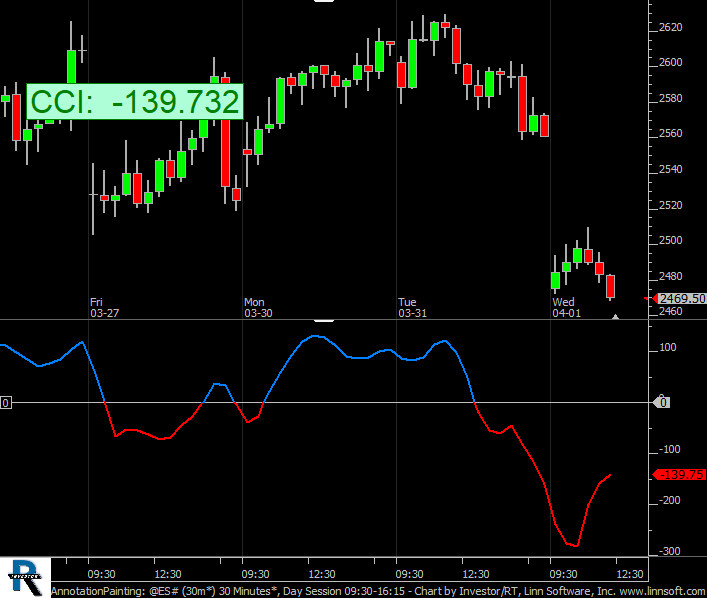 |
AnnotationPainting (@ES#) cpayne [totalcount]
5 years 2 weeks ago
Annotation Painting Options. This chart was uploaded by Investor/RT 14.1.4 showing symbol: @ES#. |
View |
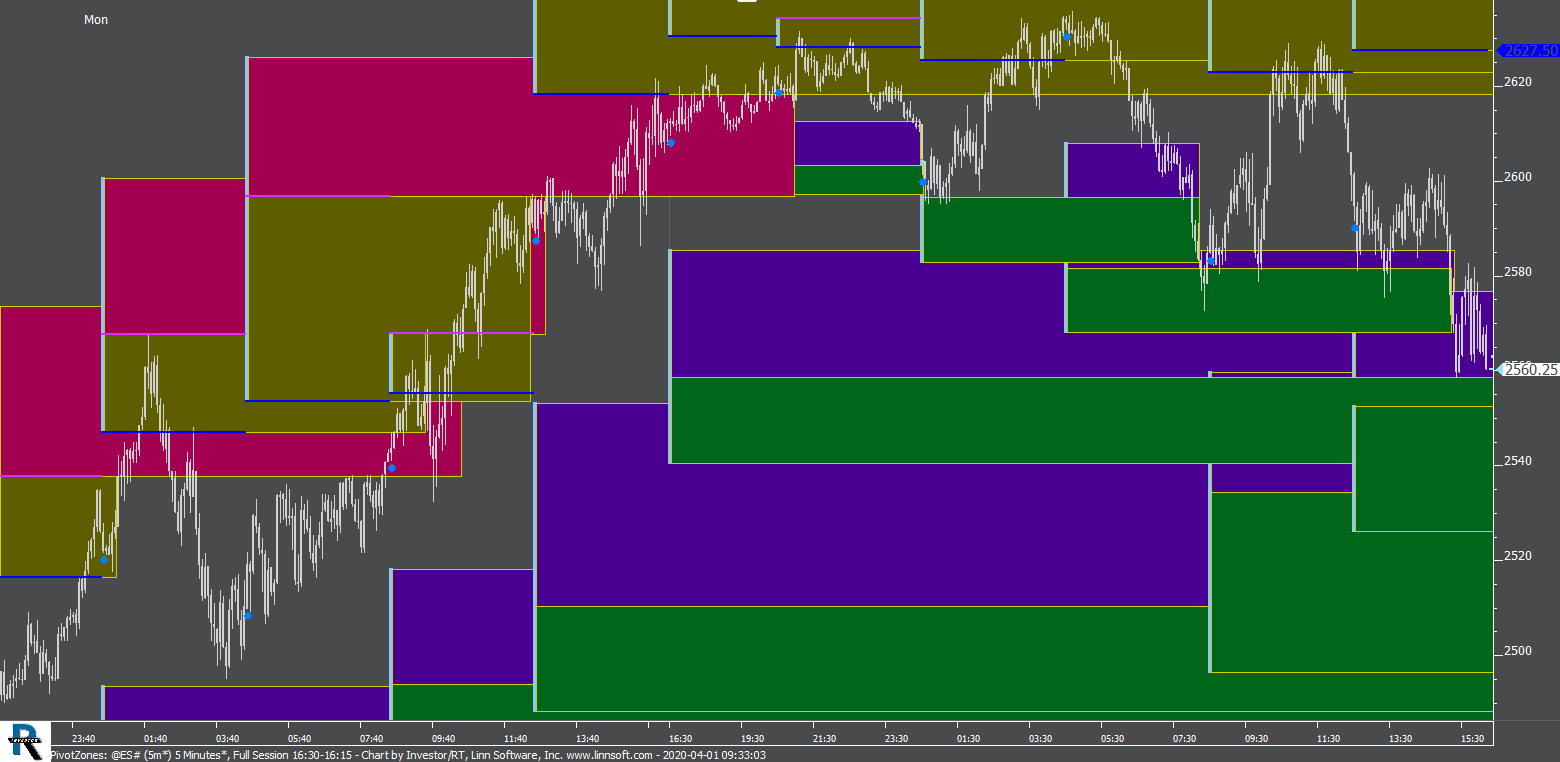 |
PivotZones (@ES#) cpayne [totalcount]
5 years 2 weeks ago
Pivot Zones. This chart was uploaded by Investor/RT 14.1.4 showing symbol: @ES#. |
View |
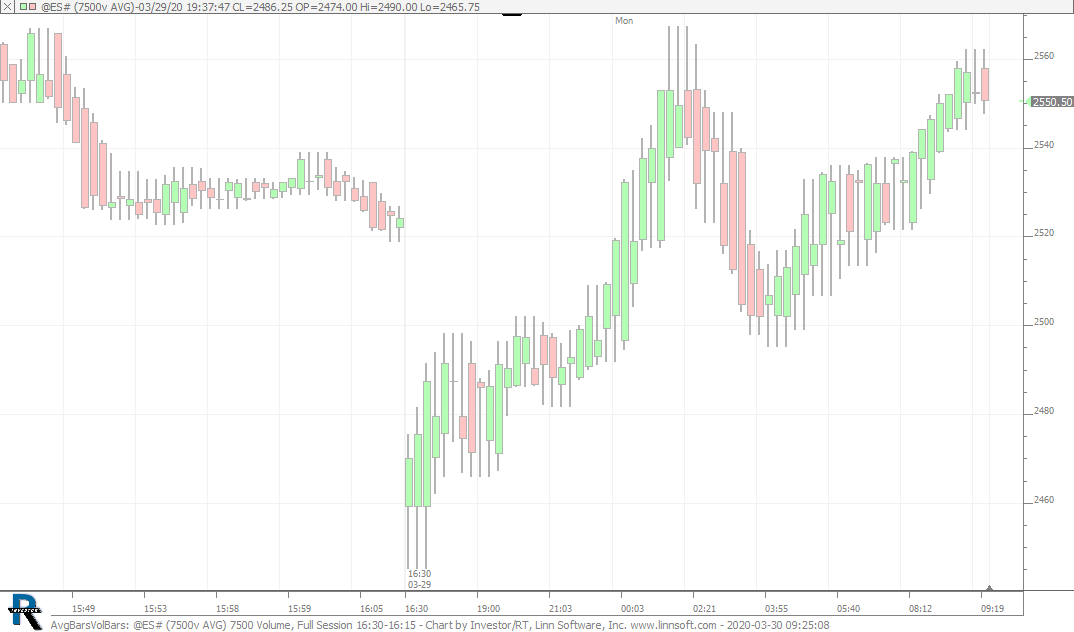 |
AvgBarsVolBars (@ES#) cpayne [totalcount]
5 years 3 weeks ago
Average Bars of 7500 Vol Bar. This chart was uploaded by Investor/RT 14.1.4 showing symbol: @ES#. |
View |
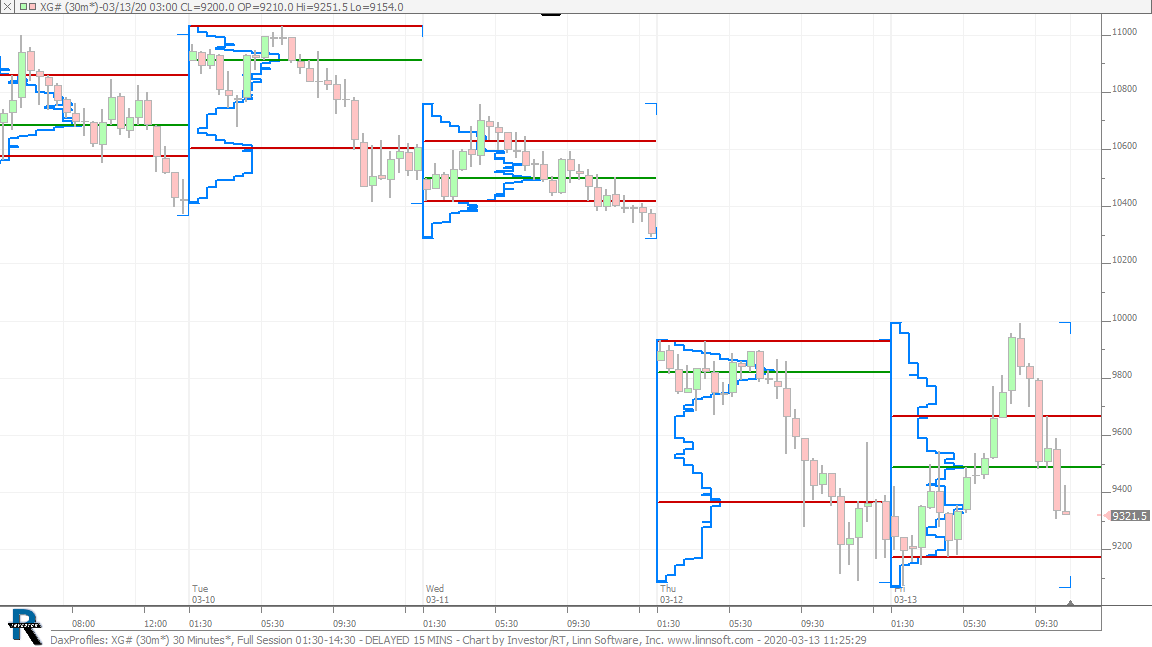 |
DaxProfiles (XG#) cpayne [totalcount]
5 years 1 month ago
DAX Profiles. This chart was uploaded by Investor/RT 14.1.2 showing symbol: XG#. |
View |
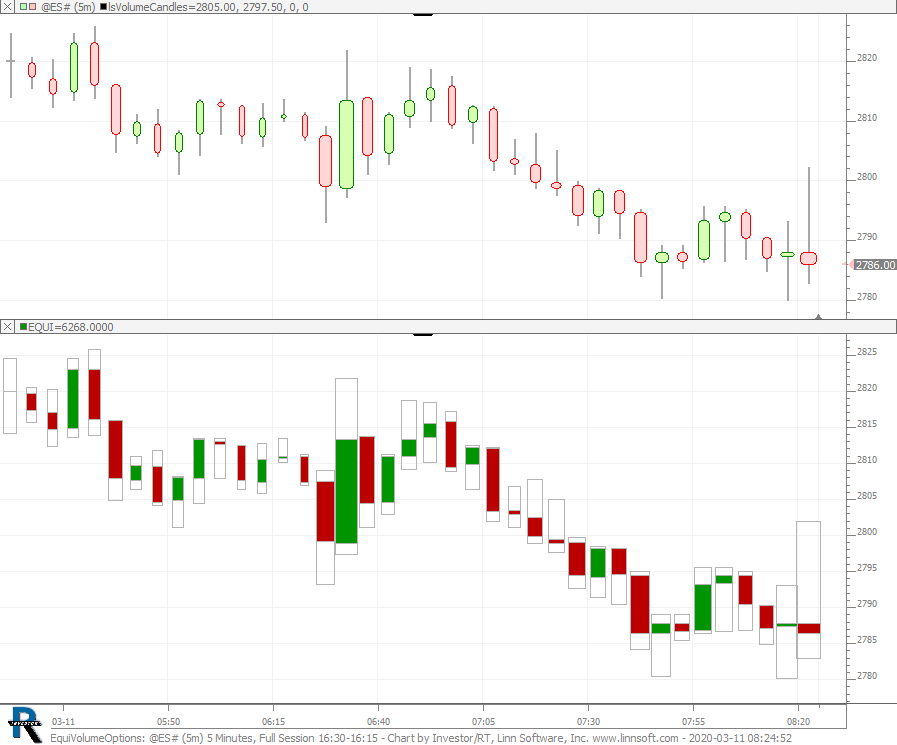 |
EquiVolumeOptions (@ES#) cpayne [totalcount]
5 years 1 month ago
Equi-Volume through VolumeCandles / VolumeScope and EquiIndicator. This chart was uploaded by Investor/RT 14.1.2 showing symbol: @ES#. |
View |
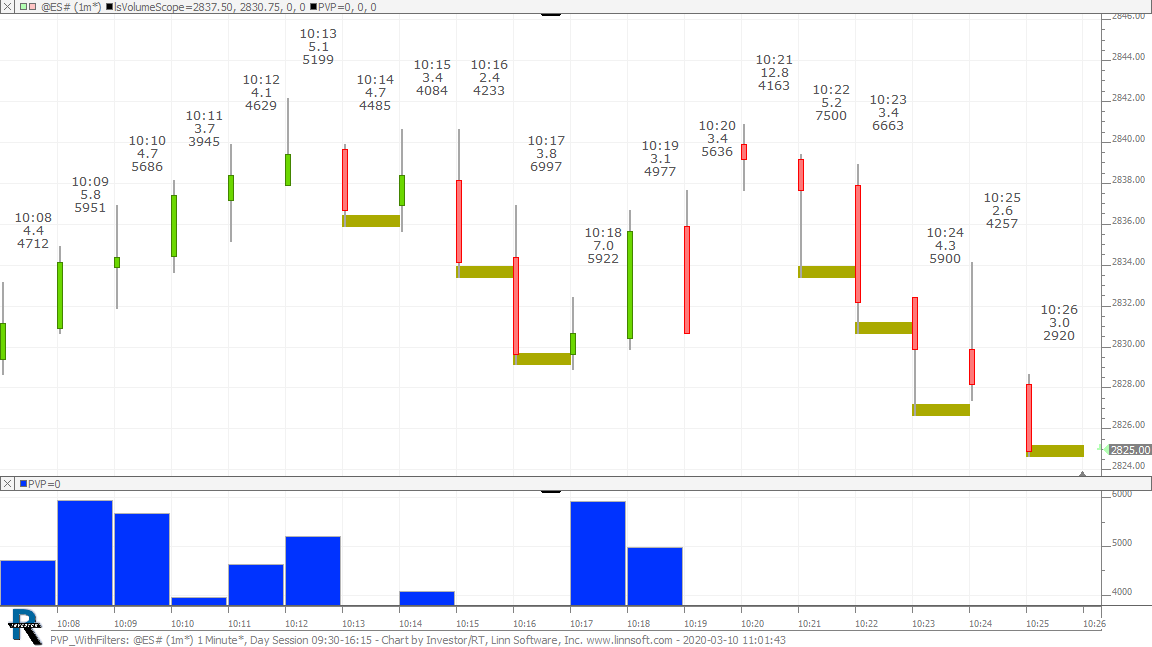 |
PVP WithFilters (@ES#) cpayne [totalcount]
5 years 1 month ago
This chart was uploaded by Investor/RT 14.1.2 showing symbol: @ES#. |
View |
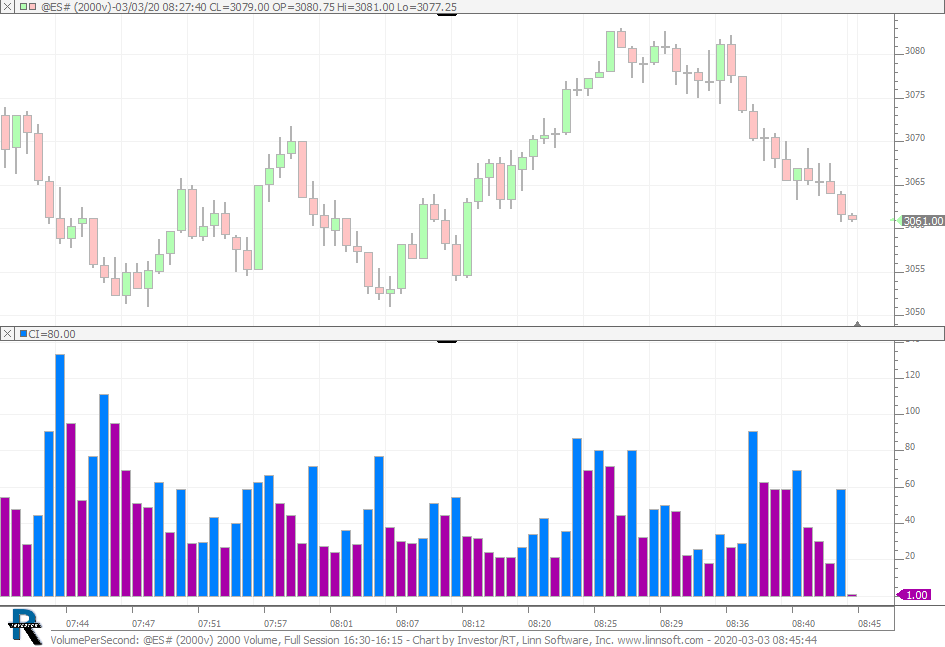 |
VolumePerSecond (@ES#) cpayne [totalcount]
5 years 1 month ago
Volume Per Second. This chart was uploaded by Investor/RT 14.1.1 showing symbol: @ES#. |
View |
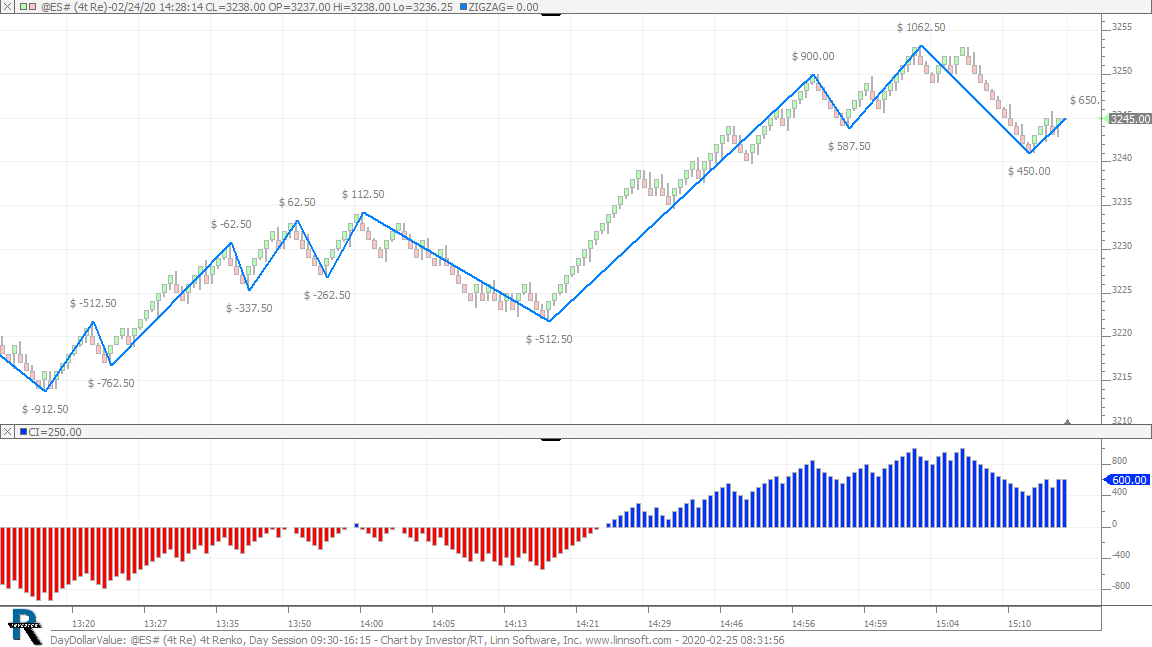 |
DayDollarValue (@ES#) cpayne [totalcount]
5 years 1 month ago
Day Dollar Value. This chart was uploaded by Investor/RT 14.1.12 showing symbol: @ES#. |
View |
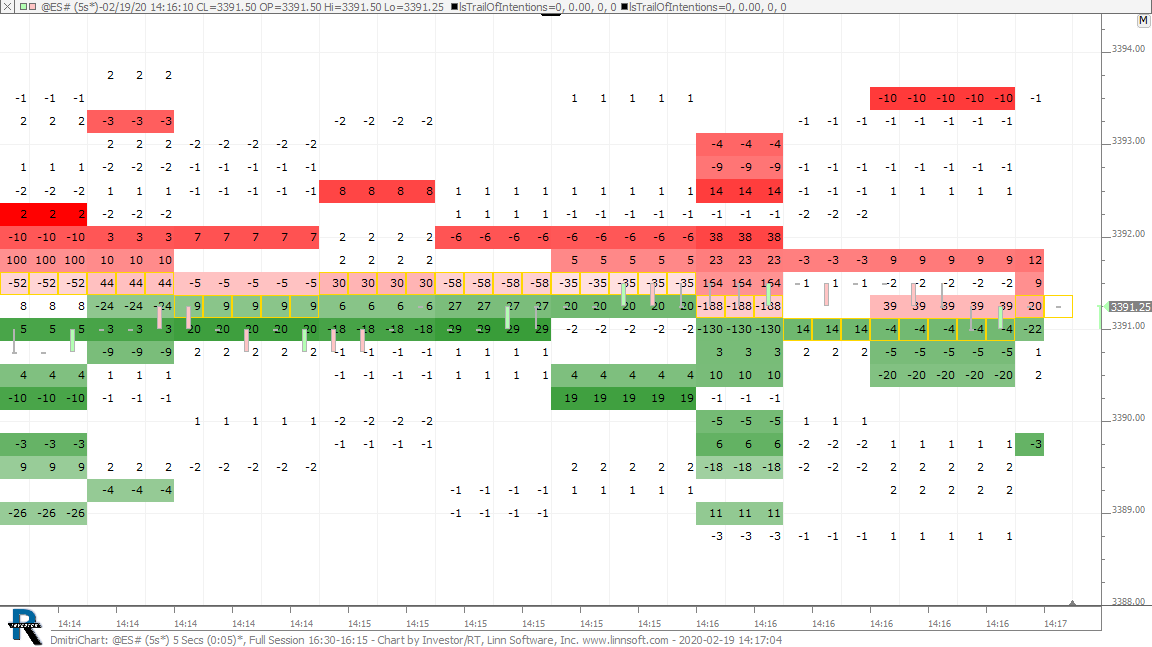 |
DmitriChart (@ES#) cpayne [totalcount]
5 years 2 months ago
This chart was uploaded by Investor/RT 14.1.12 showing symbol: @ES#. |
View |
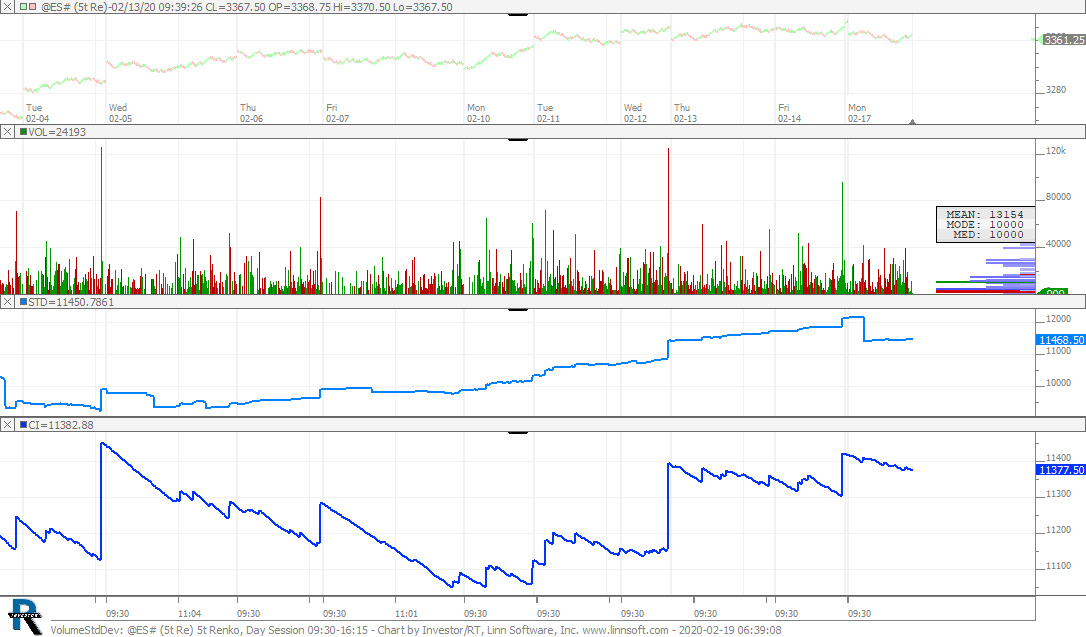 |
VolumeStdDev (@ES#) cpayne [totalcount]
5 years 2 months ago
This chart was uploaded by Investor/RT 14.1.12 showing symbol: @ES#. |
View |
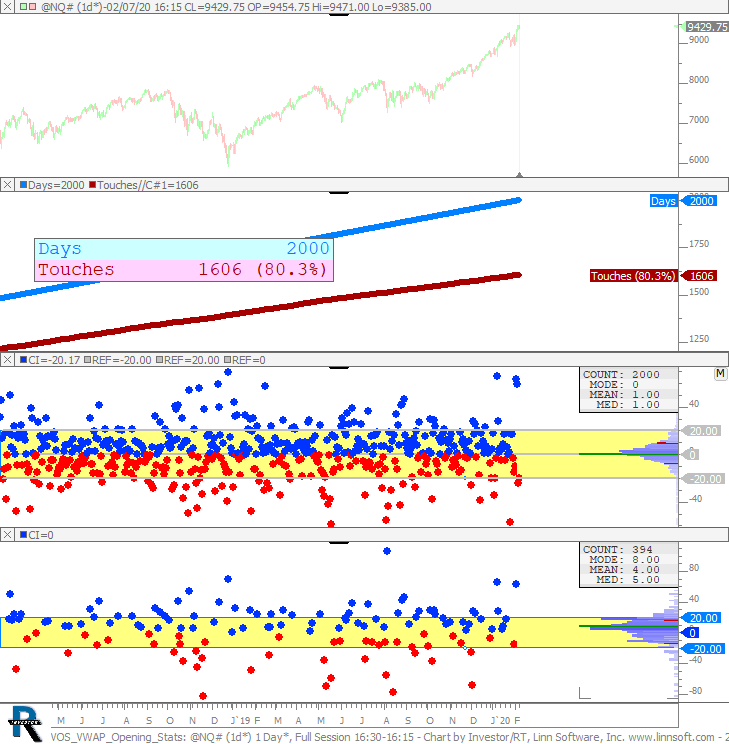 |
VOS VWAP Opening Stats (@NQ#) cpayne [totalcount]
5 years 2 months ago
VWAP Opening Statistics. How often does price touch VWAP in the 1st 60 minutes of day session? Bottom pane profiles the distance from price to VWAP at the open of each day session. |
View |
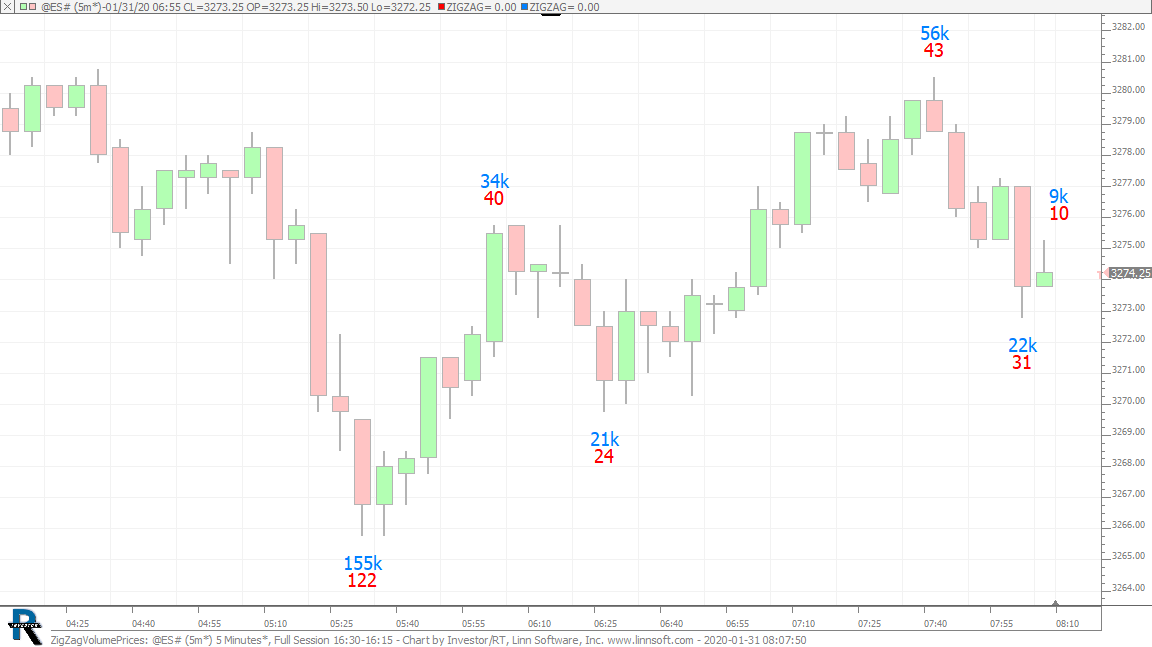 |
ZigZagVolumePrices (@ES#) cpayne [totalcount]
5 years 2 months ago
This chart was uploaded by Investor/RT 14.1.10 showing symbol: @ES#. |
View |
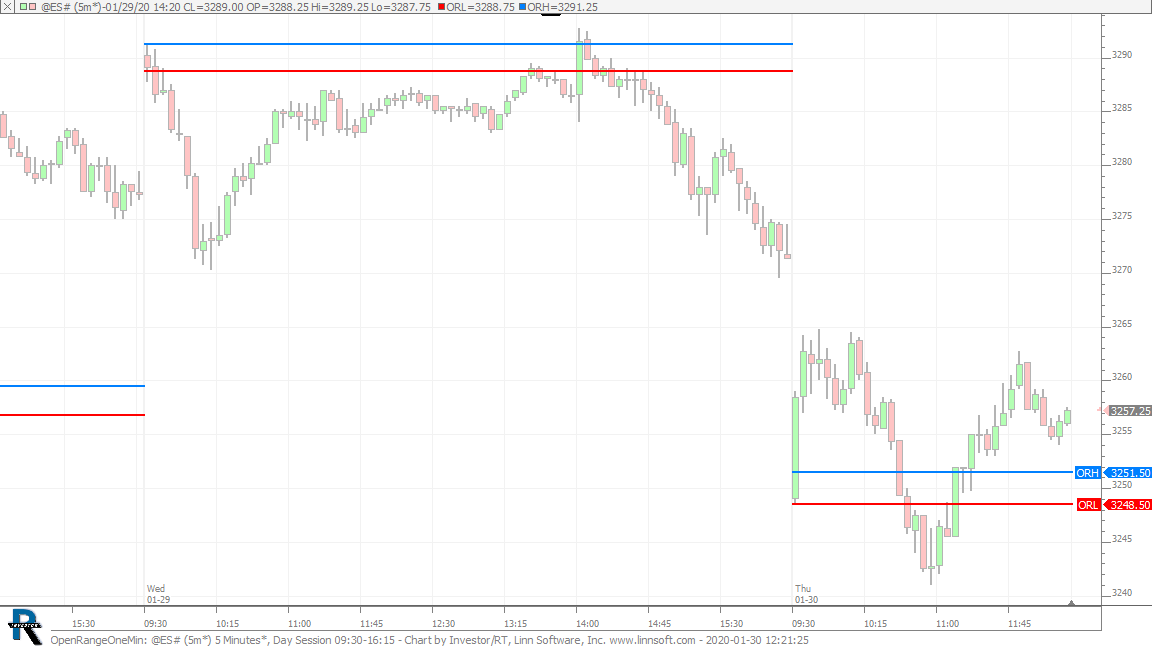 |
OpenRangeOneMin (@ES#) cpayne [totalcount]
5 years 2 months ago
Opening Range Lines - One Minute. This chart was uploaded by Investor/RT 14.1.10 showing symbol: @ES#. |
View |
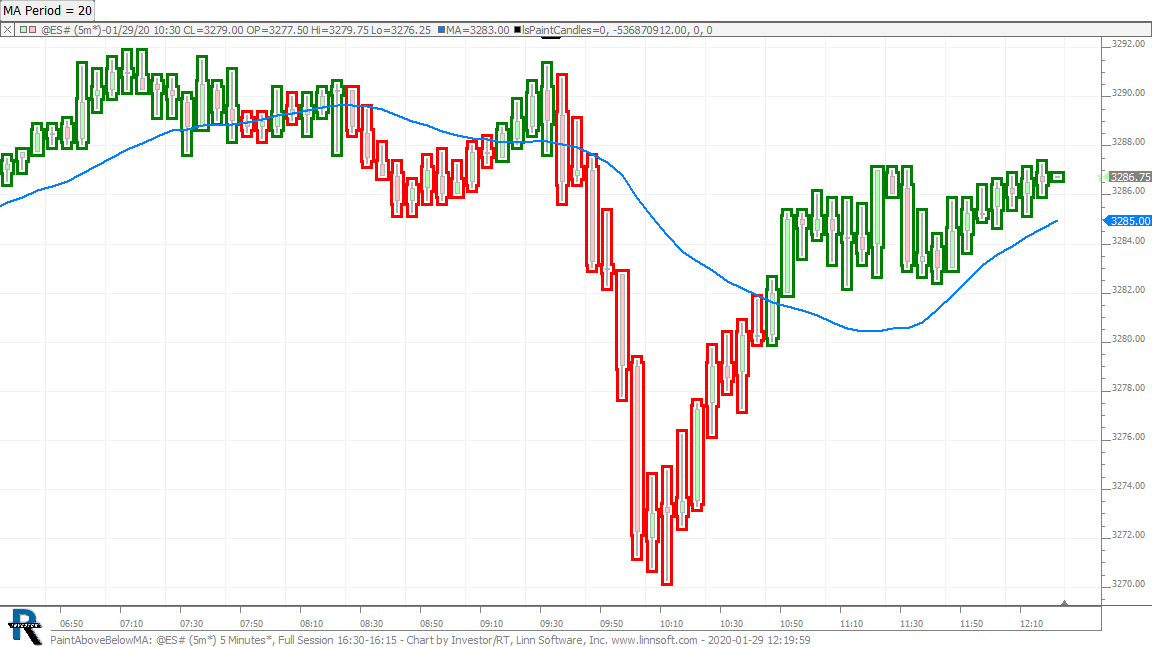 |
PaintAboveBelowMA (@ES#) cpayne [totalcount]
5 years 2 months ago
PaintCandles - Above or Below 20 Period MA. This chart was uploaded by Investor/RT 14.1.10 showing symbol: @ES#. |
View |
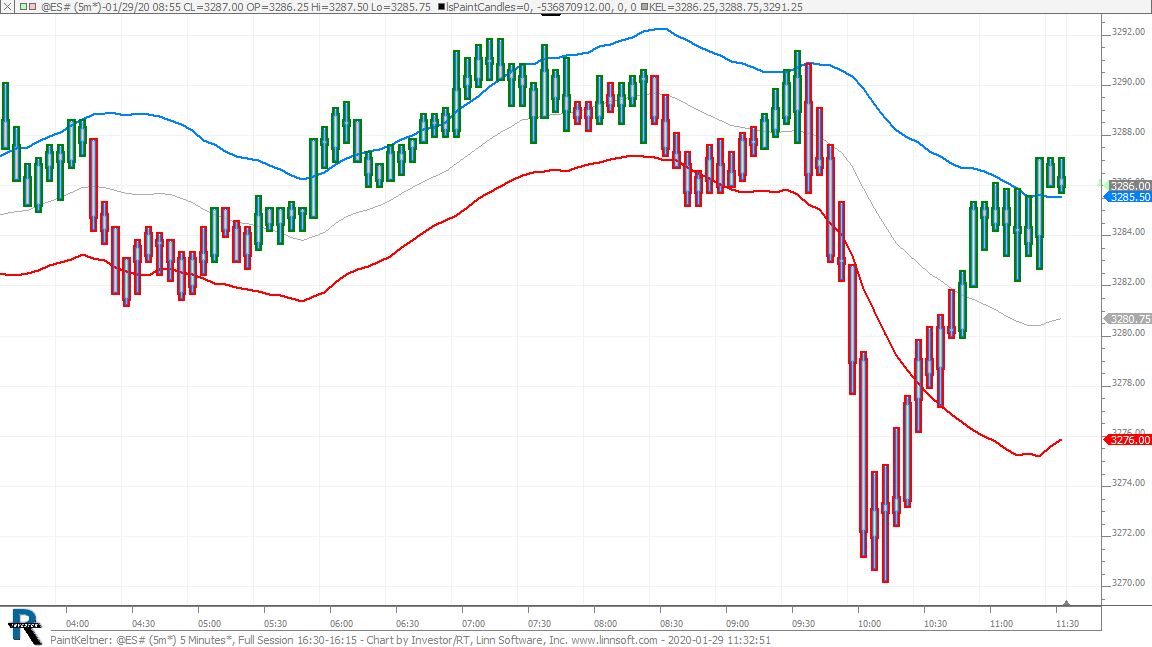 |
PaintKeltner (@ES#) cpayne [totalcount]
5 years 2 months ago
Painted Keltner. This chart was uploaded by Investor/RT 14.1.10 showing symbol: @ES#. |
View |
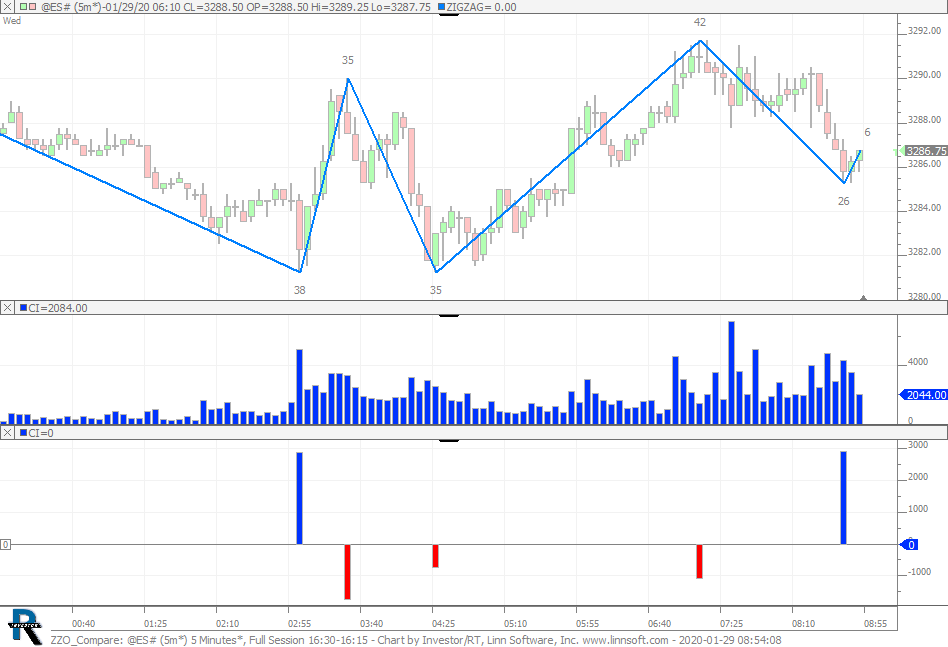 |
ZZO Compare (@ES#) cpayne [totalcount]
5 years 2 months ago
This chart was uploaded by Investor/RT 14.1.10 showing symbol: @ES#. |
View |
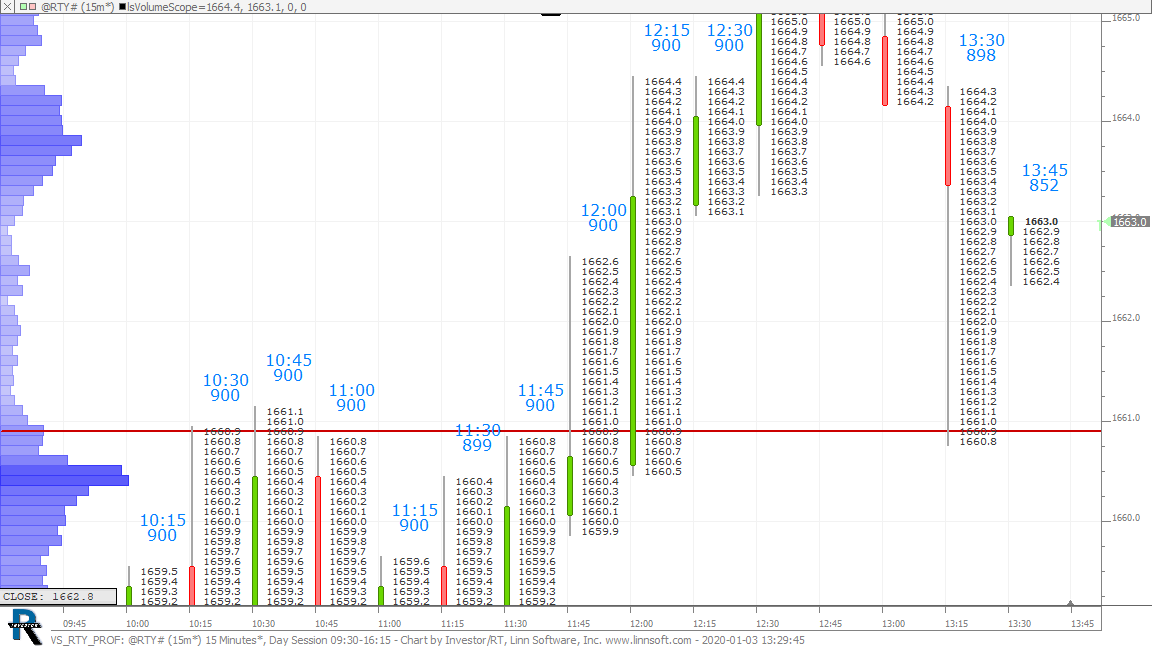 |
VS RTY PROF (@RTY#) cpayne [totalcount]
5 years 3 months ago
This chart was uploaded by Investor/RT 14.1.8 showing symbol: @RTY#. |
View |