 |
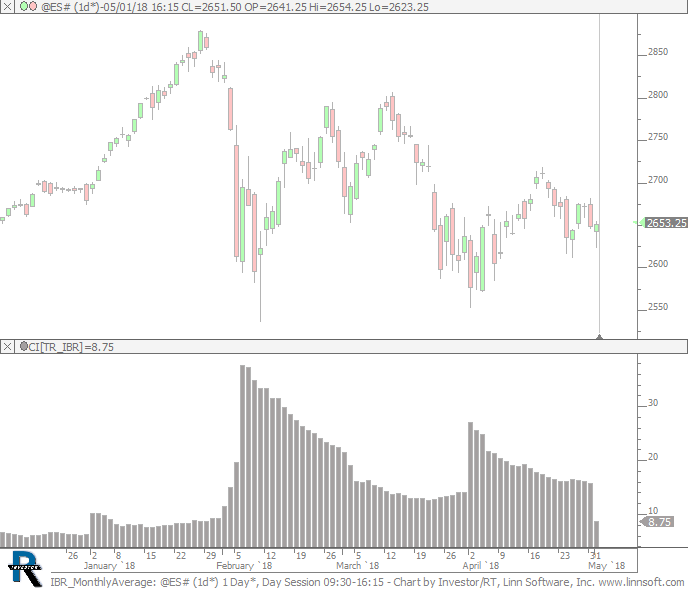
IBR MonthlyAverage (@ES#) cpayne [totalcount]
6 years 11 months ago
IB Range - Monthly Average. This chart was uploaded by Investor/RT 13.3.1 showing symbol: @ES#. |
View |
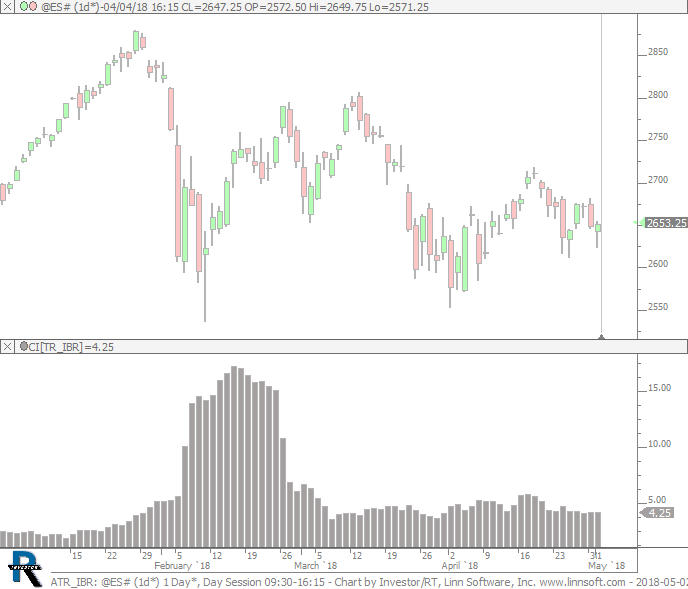 |
ATR IBR (@ES#) cpayne [totalcount]
6 years 11 months ago
ATR of IB Range. This chart was uploaded by Investor/RT 13.3.1 showing symbol: @ES#. |
View |
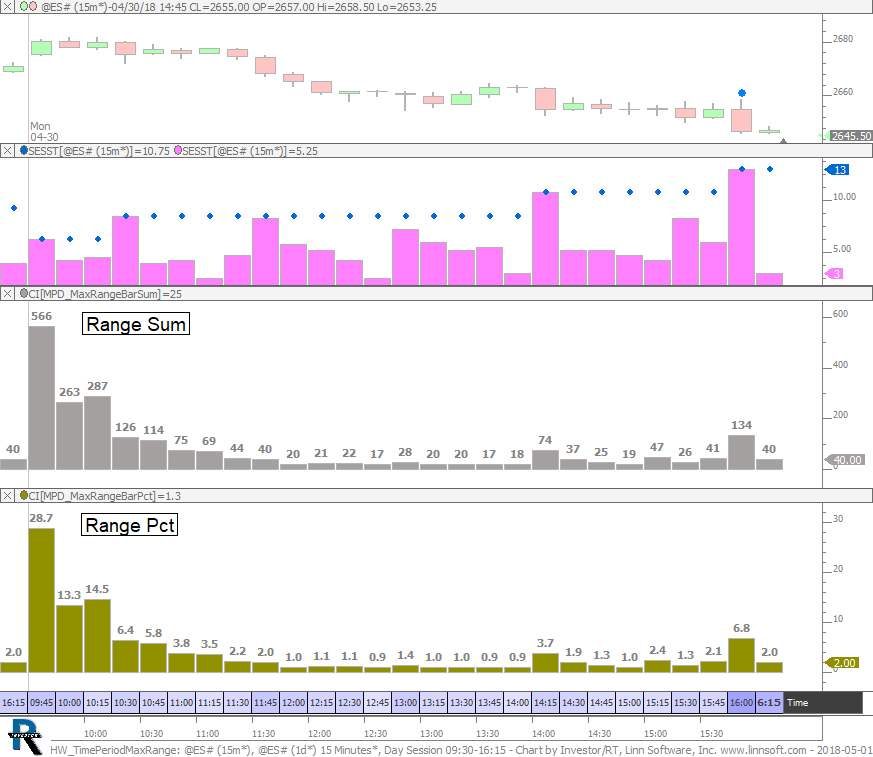 |
HW TimePeriodMaxRange (@ES#) cpayne [totalcount]
6 years 11 months ago
Sum and Percent of time the highest range bar is made at each 15 minute period during the session. This chart was uploaded by Investor/RT 13.3.1 showing symbol: @ES#. |
View |
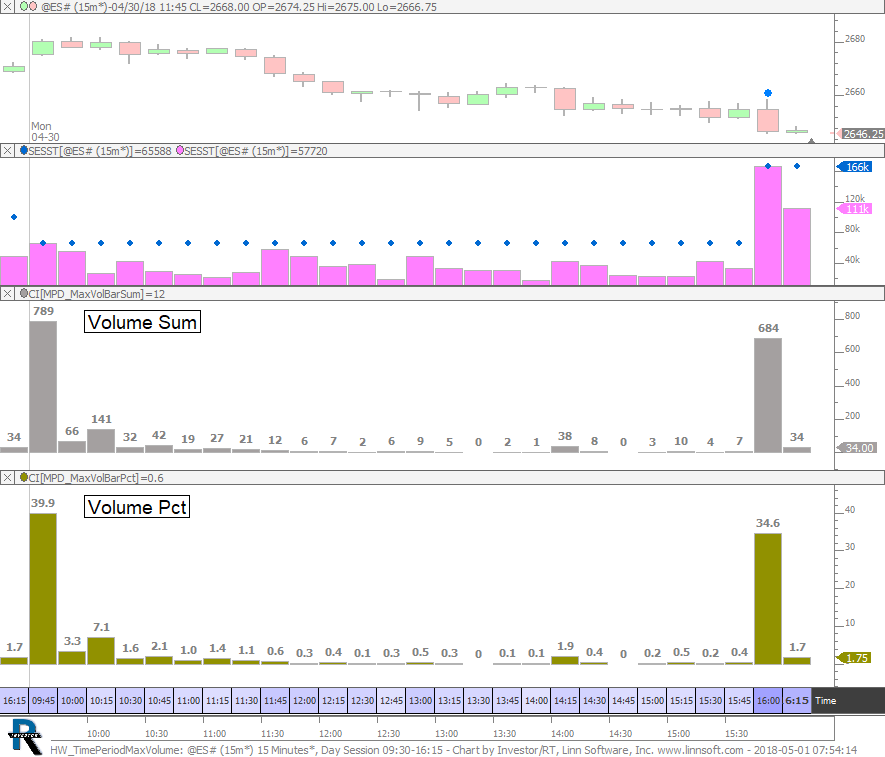 |
HW TimePeriodMaxVolume (@ES#) cpayne [totalcount]
6 years 11 months ago
Sum and Percent of time the highest volume bar is made at each 15 minute period during the session. This chart was uploaded by Investor/RT 13.3.1 showing symbol: @ES#. |
View |
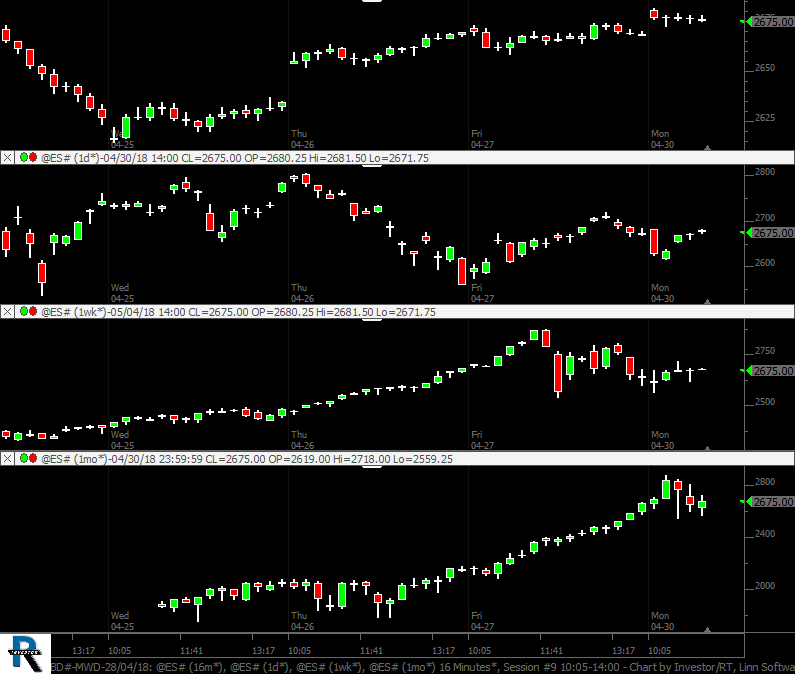 |
BD MWD 28 04 18 (@ES#) cpayne [totalcount]
6 years 11 months ago
This chart was uploaded by Investor/RT 13.3.1 showing symbol: @ES#. |
View |
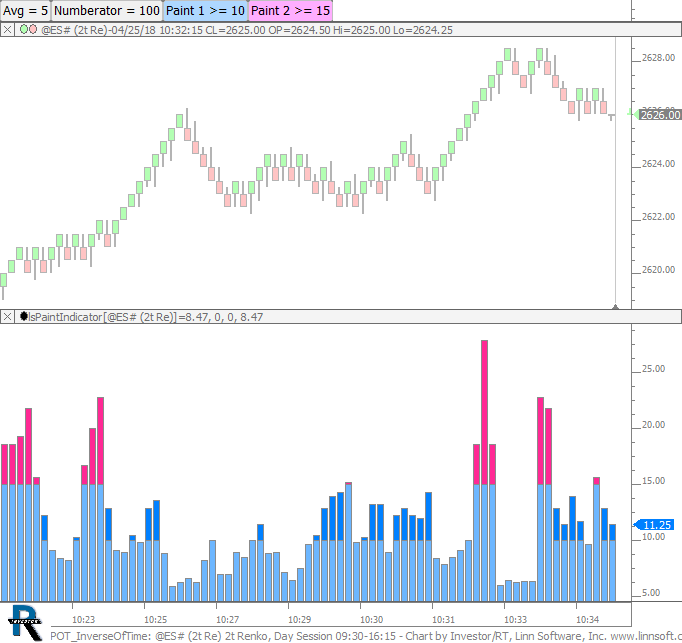 |
POT InverseOfTime (@ES#) cpayne [totalcount]
6 years 12 months ago
Pace of Tape - Lower Pane computes an inverse of the time it takes to complete each bar. A smoothing of time is used for that denominator with the smoothing period specified with button. |
View |
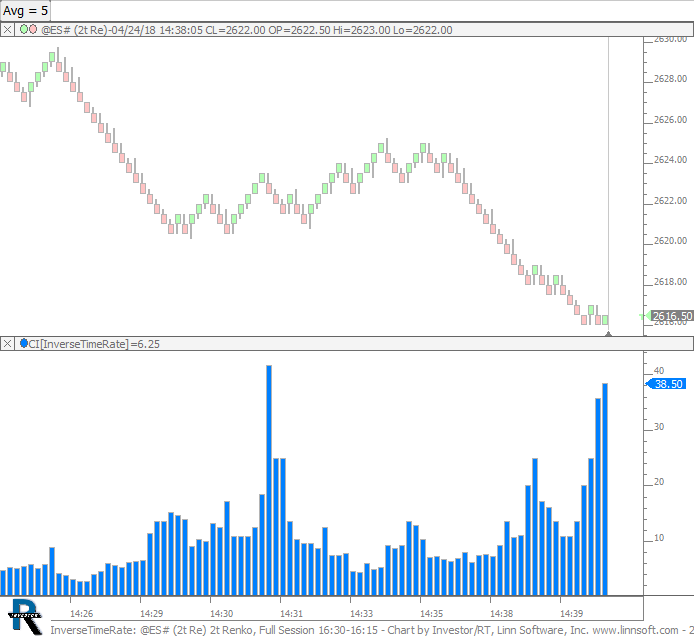 |
InverseTimeRate (@ES#) cpayne [totalcount]
6 years 12 months ago
Indicator in lower pane computes 100 / time (in seconds). Larger value for faster bars and faster moves. The denominator is the 3 bar average of time (in seconds). |
View |
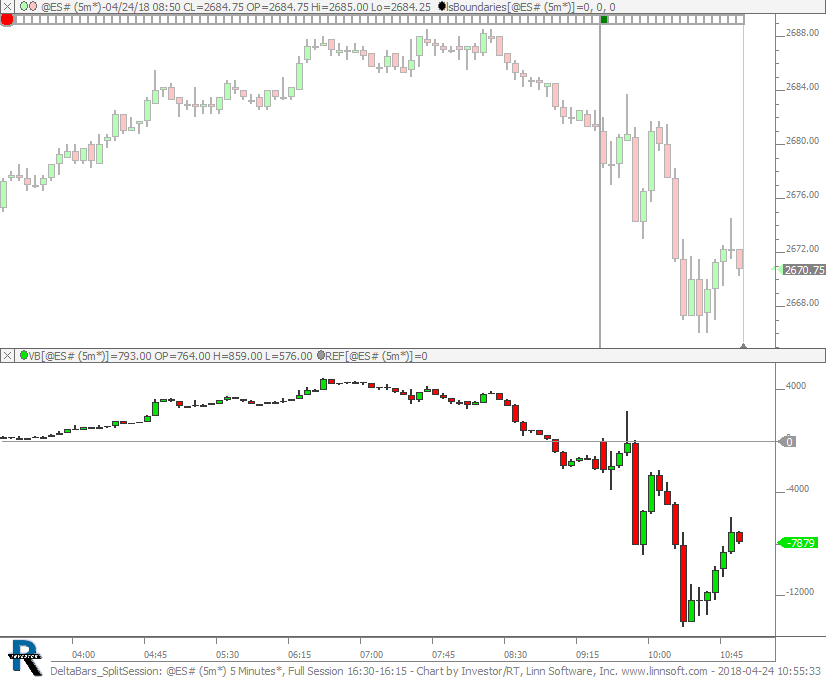 |
DeltaBars SplitSession (@ES#) cpayne [totalcount]
6 years 12 months ago
Cumulative Delta Bars resetting on split session using the Boundaries indicator. This chart was uploaded by Investor/RT 13.2.8 showing symbol: @ES#. |
View |
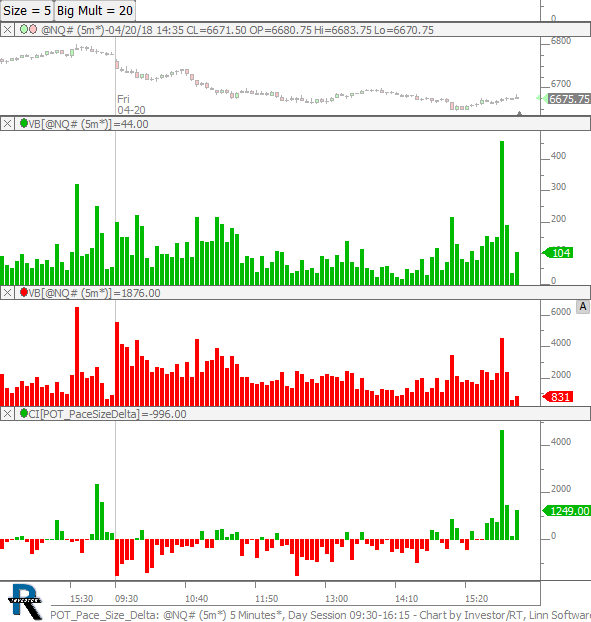 |
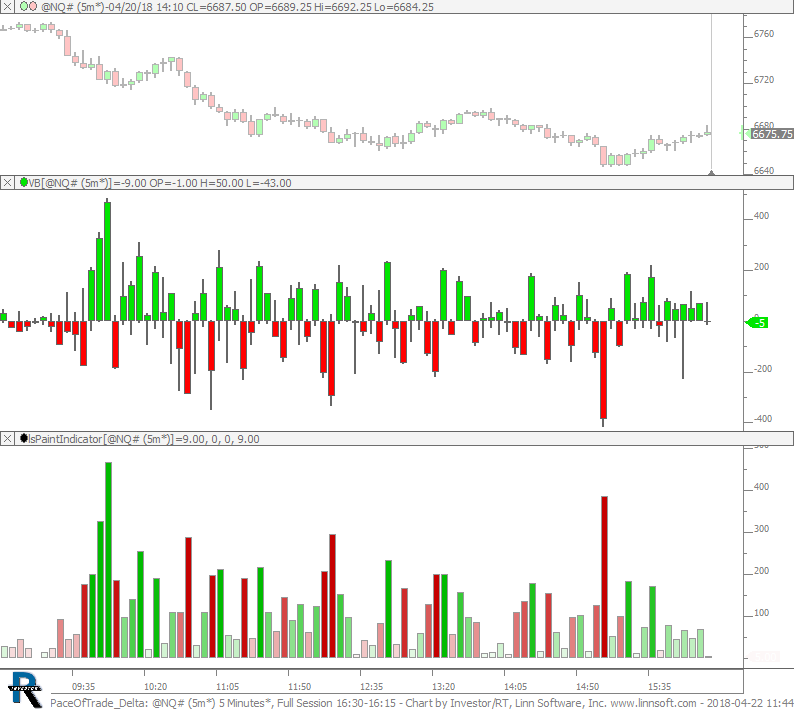
POT Pace Size Delta (@NQ#) cpayne [totalcount]
7 years 17 hours ago
Pace of Trade - Pace of big vs pace of small trades. This chart was uploaded by Investor/RT 13.2.8 showing symbol: @NQ#. |
View |
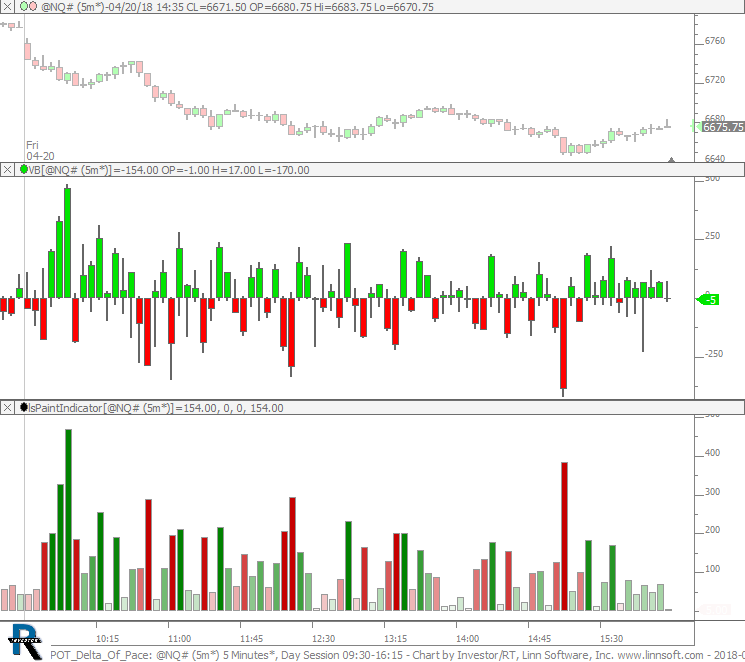 |
POT Delta Of Pace (@NQ#) cpayne [totalcount]
7 years 21 hours ago
Pace of Trade - Delta of Pace - Middle pane plots the difference between the number of trades that occurred at ask minus the number of trades that occurred at the bid. |
View |
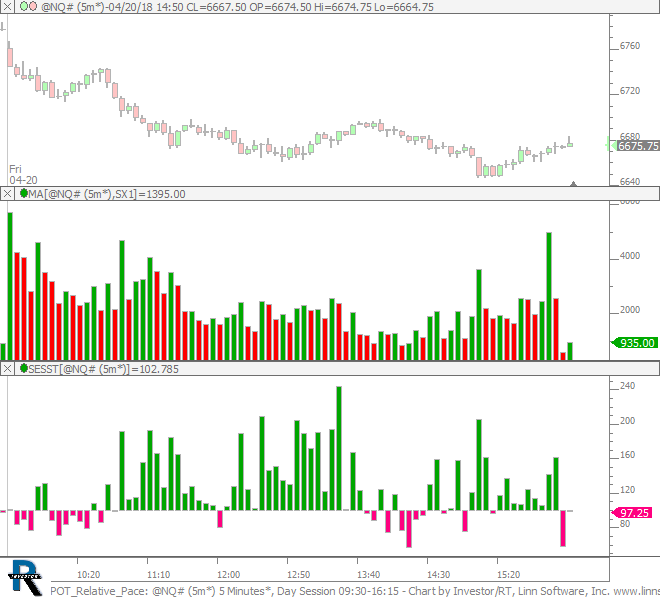 |
POT Relative Pace (@NQ#) cpayne [totalcount]
7 years 21 hours ago
Pace of Tape - Relative Pace - Middle pane plots the number of trades (pace) and bottom pane shows the pace relative to avergae of past 5 days (same timeframe). |
View |
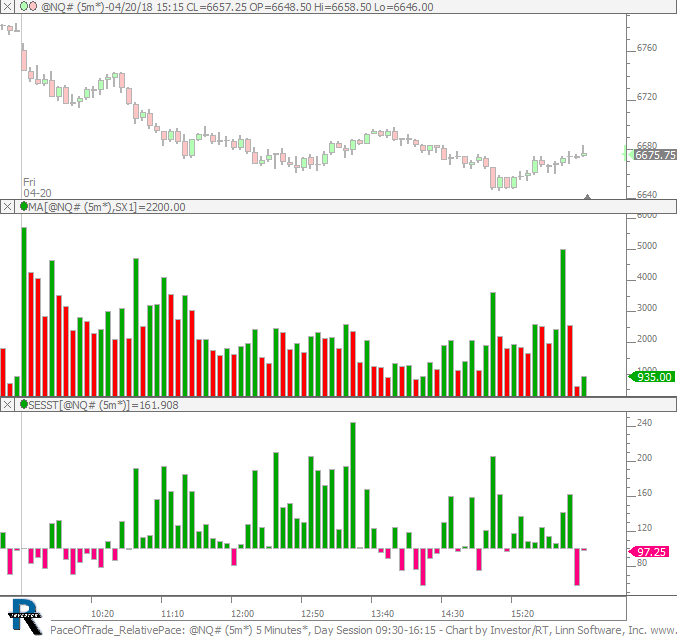 |
PaceOfTrade RelativePace (@NQ#) cpayne [totalcount]
7 years 22 hours ago
Pace of Tape - Relative Pace - Middle pane plots the number of trades (pace) and bottom pane shows the pace relative to avergae of past 5 days (same timeframe). |
View |
 |
PaceOfTrade Delta (@NQ#) cpayne [totalcount]
7 years 22 hours ago
Pace of Trade - Delta. This chart was uploaded by Investor/RT 13.2.8 showing symbol: @NQ#. |
View |
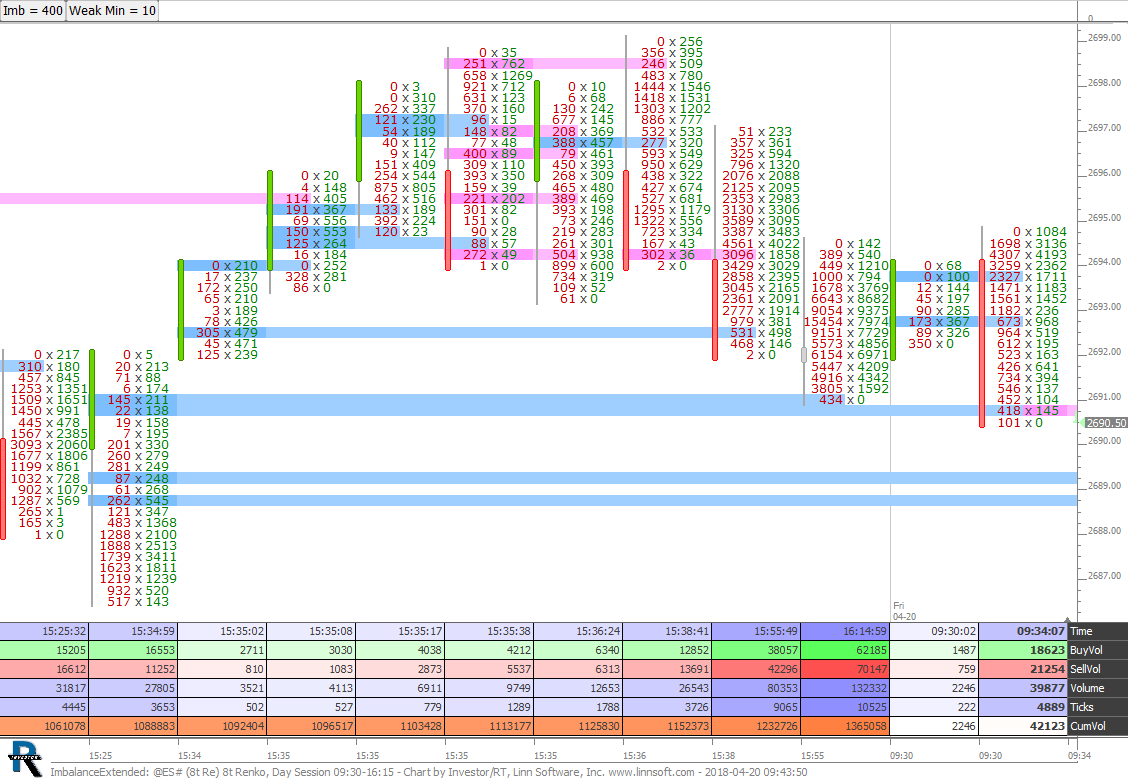 |
ImbalanceExtended (@ES#) cpayne [totalcount]
7 years 3 days ago
This chart was uploaded by Investor/RT 13.2.8 showing symbol: @ES#. |
View |
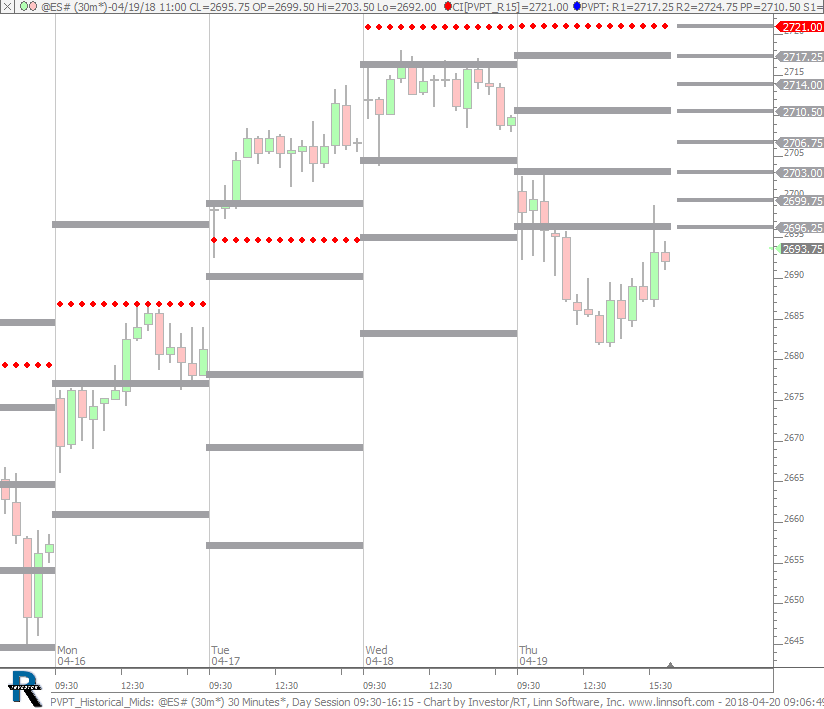 |
PVPT Historical Mids (@ES#) cpayne [totalcount]
7 years 3 days ago
Pivot Point - Historical R 1.5. This chart was uploaded by Investor/RT 13.2.8 showing symbol: @ES#. |
View |
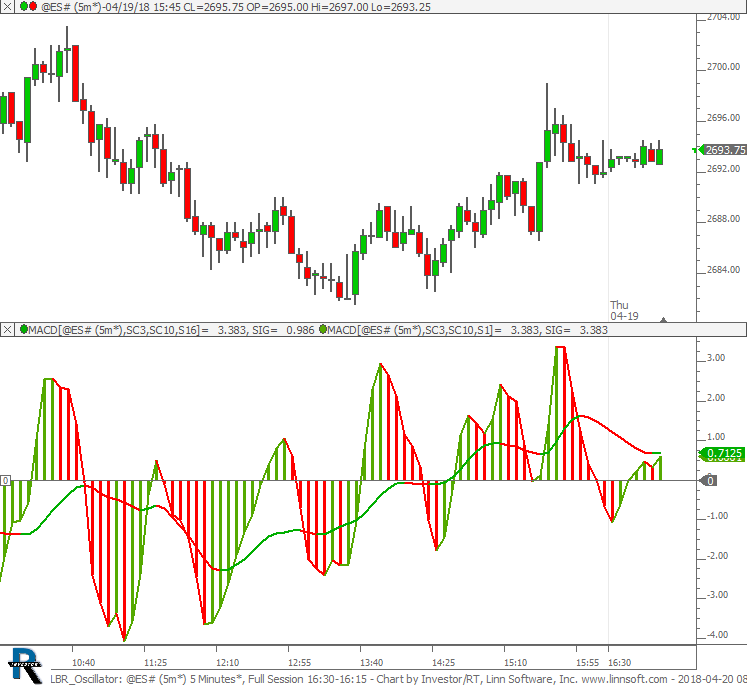 |
LBR Oscillator (@ES#) cpayne [totalcount]
7 years 3 days ago
LBR 3/10 Oscillator - Linda Bradford Rashke Three Ten Oscillator (310). This chart was uploaded by Investor/RT 13.2.8 showing symbol: @ES#. |
View |
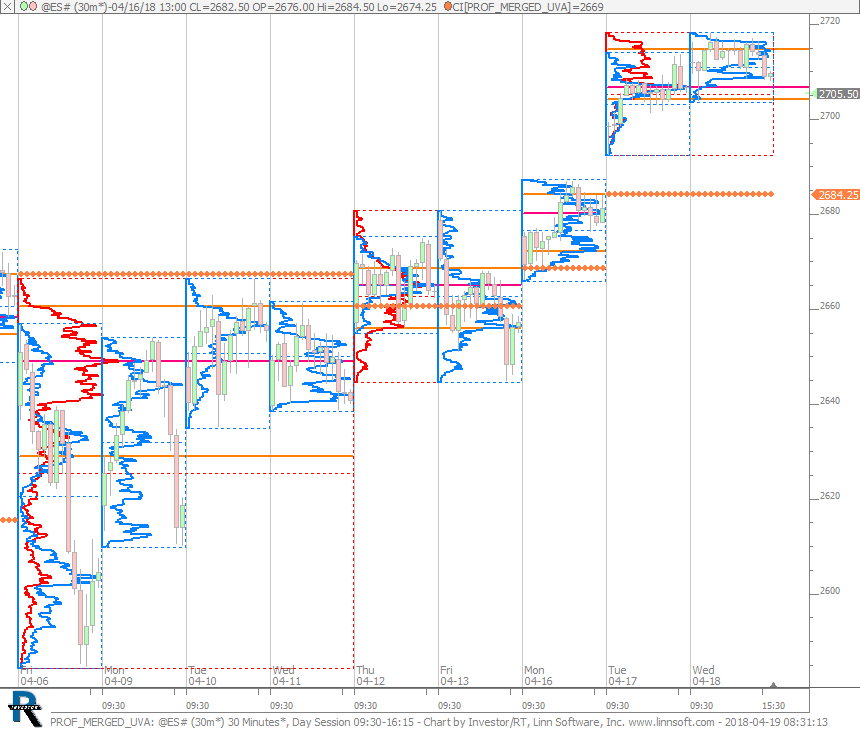 |
PROF MERGED UVA (@ES#) cpayne [totalcount]
7 years 4 days ago
This chart was uploaded by Investor/RT 13.2.8 showing symbol: @ES#. |
View |
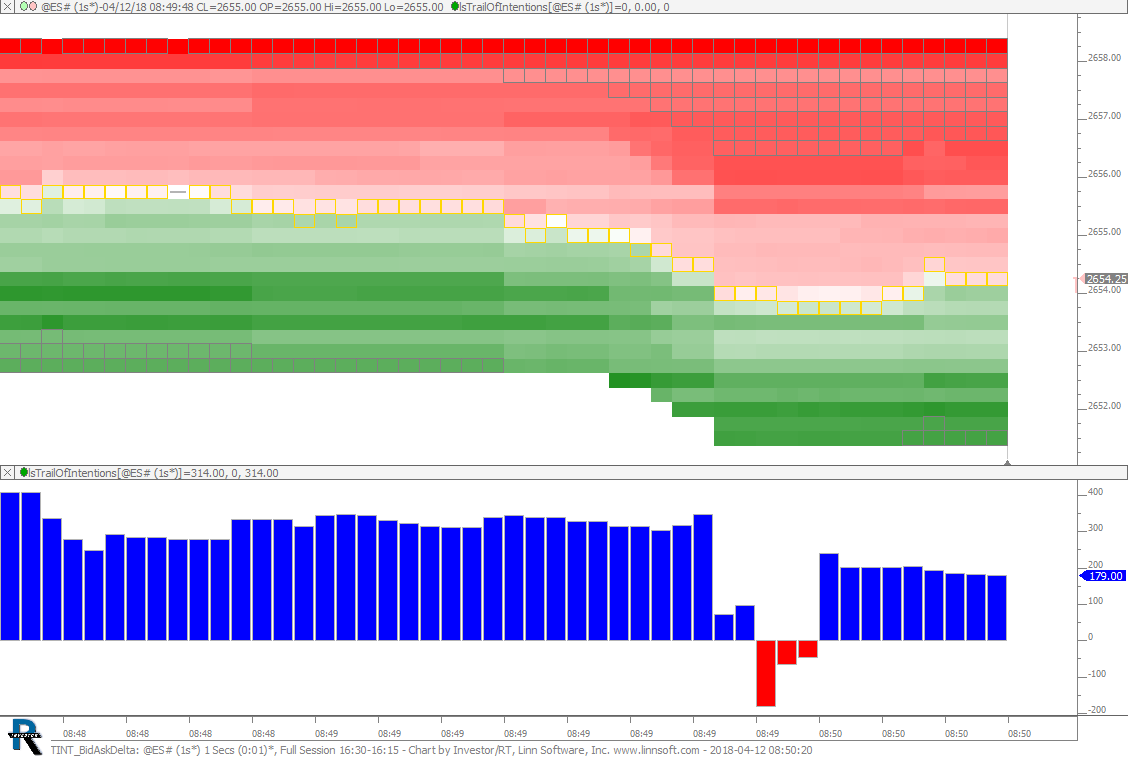 |
TINT BidAskDelta (@ES#) cpayne [totalcount]
7 years 1 week ago
TINT with bid size minus ask size in lower pane. This chart was uploaded by Investor/RT 13.2.8 showing symbol: @ES#. |
View |
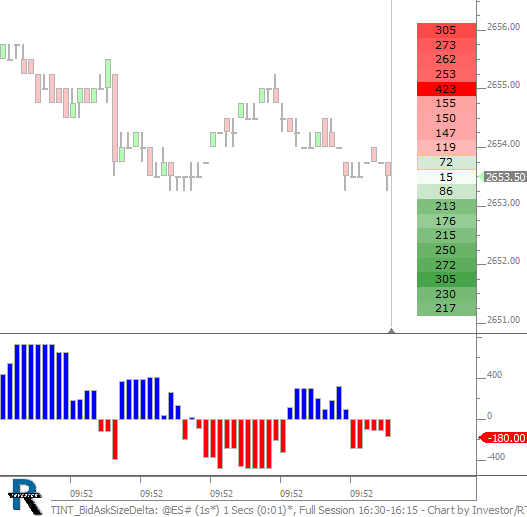 |
TINT BidAskSizeDelta (@ES#) cpayne [totalcount]
7 years 2 weeks ago
Trail of Intentions. Plotting difference between bid sizes and ask sizes in lower pane. This chart was uploaded by Investor/RT 13.2.7 showing symbol: @ES#. |
View |
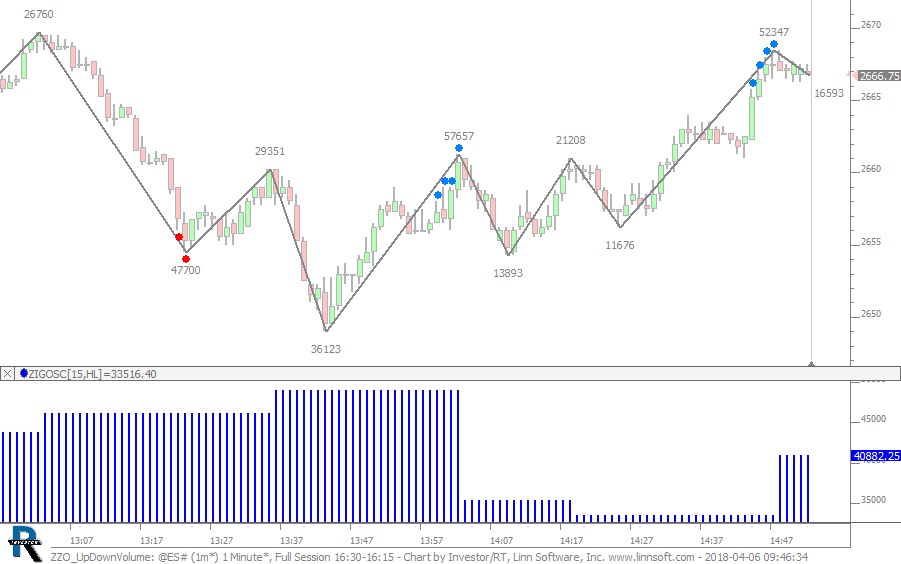 |
ZZO UpDownVolume (@ES#) cpayne [totalcount]
7 years 2 weeks ago
Big Volume Up Move. This chart was uploaded by Investor/RT 13.2.7 showing symbol: @ES#. |
View |
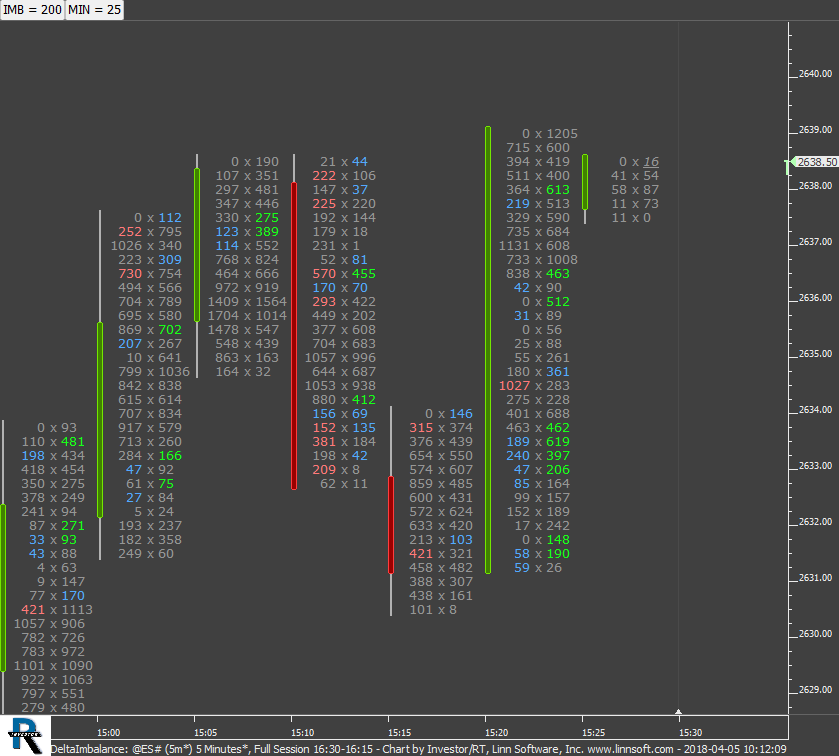 |
DeltaImbalance (@ES#) cpayne [totalcount]
7 years 2 weeks ago
Delta Imbalance - Use Buttons To Control IMB percent and MIN weak side volume. This chart was uploaded by Investor/RT 13.2.7 showing symbol: @ES#. |
View |
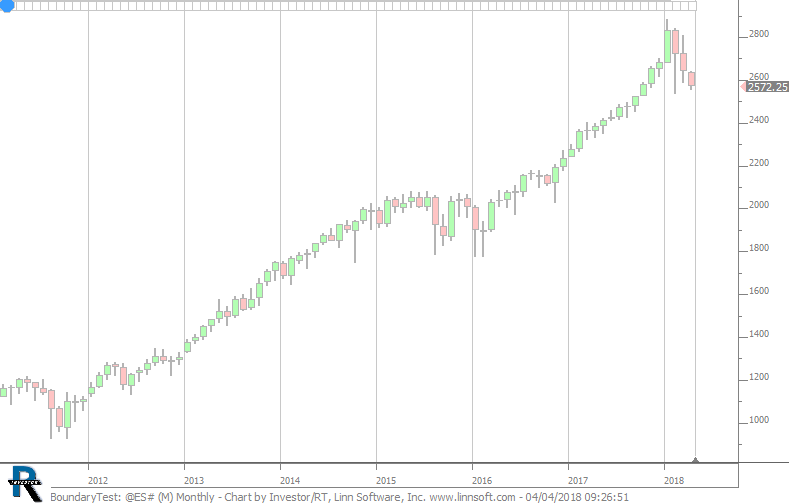 |
BoundaryTest (@ES#) cpayne [totalcount]
7 years 2 weeks ago
Boundaries Testing. This chart was uploaded by Investor/RT 13.2.7 showing symbol: @ES#. |
View |
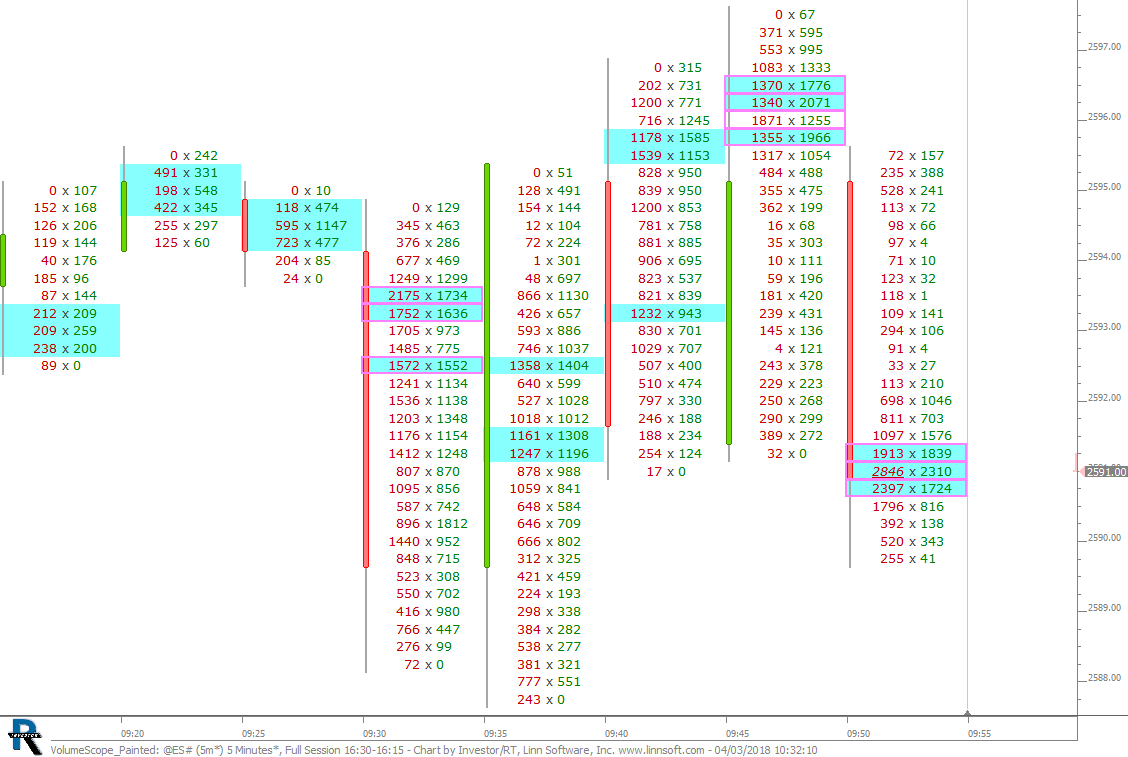 |
VolumeScope Painted (@ES#) cpayne [totalcount]
7 years 2 weeks ago
Highest 3 volume prices painted blue. Volume above 3000 highlighted in pink. This chart was uploaded by Investor/RT 13.2.7 showing symbol: @ES#. |
View |
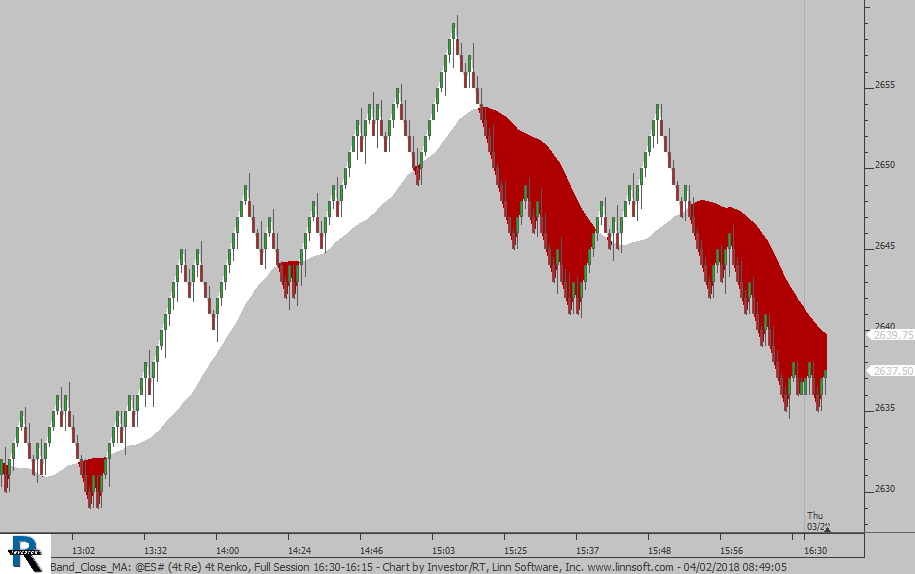 |
Band Close MA (@ES#) cpayne [totalcount]
7 years 3 weeks ago
Band between close and moving average. This chart was uploaded by Investor/RT 13.2.7 showing symbol: @ES#. |
View |
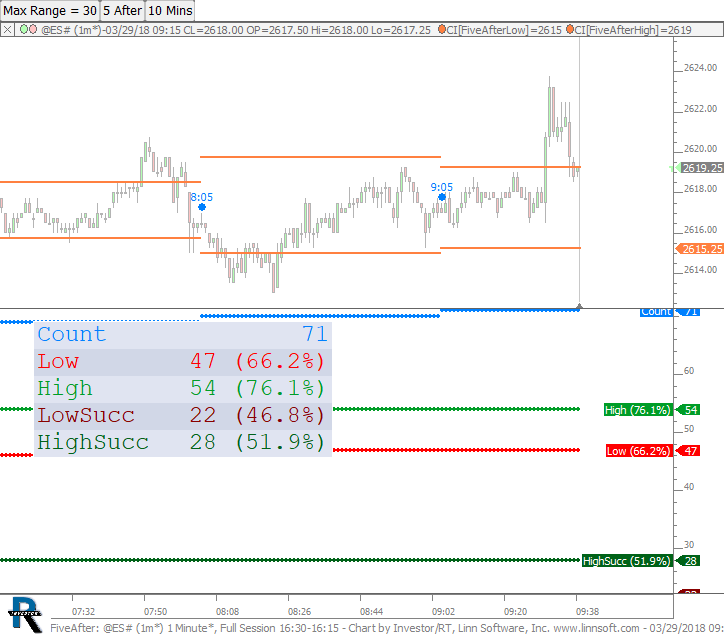 |
FiveAfter (@ES#) cpayne [totalcount]
7 years 3 weeks ago
IB every hour. This chart was uploaded by Investor/RT 13.2.7 showing symbol: @ES#. |
View |