 |
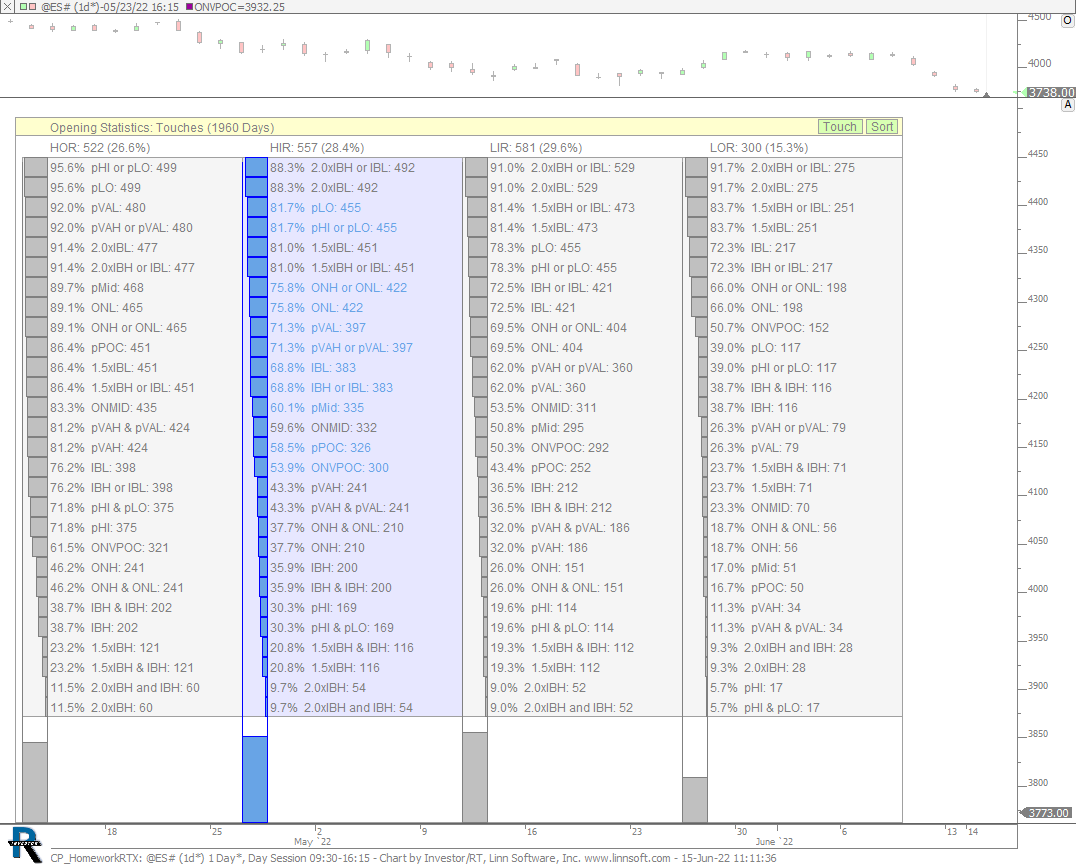
CP HomeworkRTX (@ES#) cpayne [totalcount]
2 years 10 months ago
This chart was uploaded by Investor/RT 15.1.8 showing symbol: @ES#. |
View |
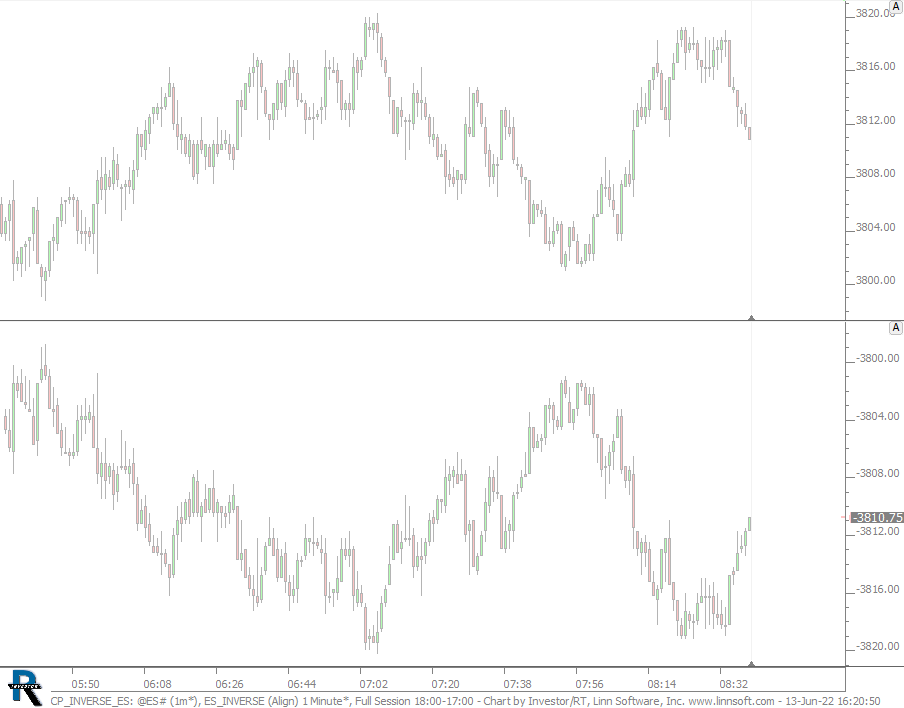 |
CP INVERSE ES (@ES#) cpayne [totalcount]
2 years 10 months ago
This chart was uploaded by Investor/RT 15.1.8 showing symbol: @ES#. |
View |
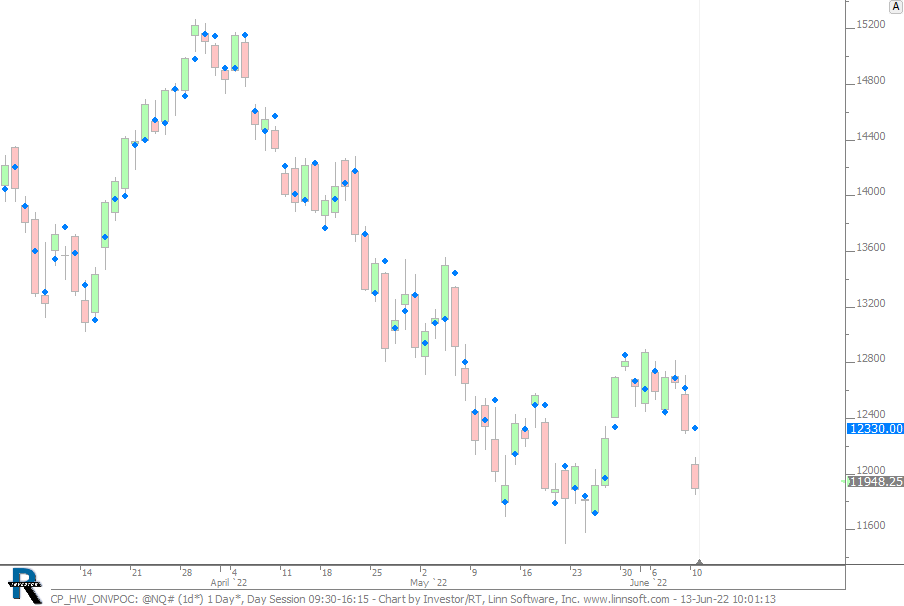 |
CP HW ONVPOC (@NQ#) cpayne [totalcount]
2 years 10 months ago
This chart was uploaded by Investor/RT 15.1.8 showing symbol: @NQ#. |
View |
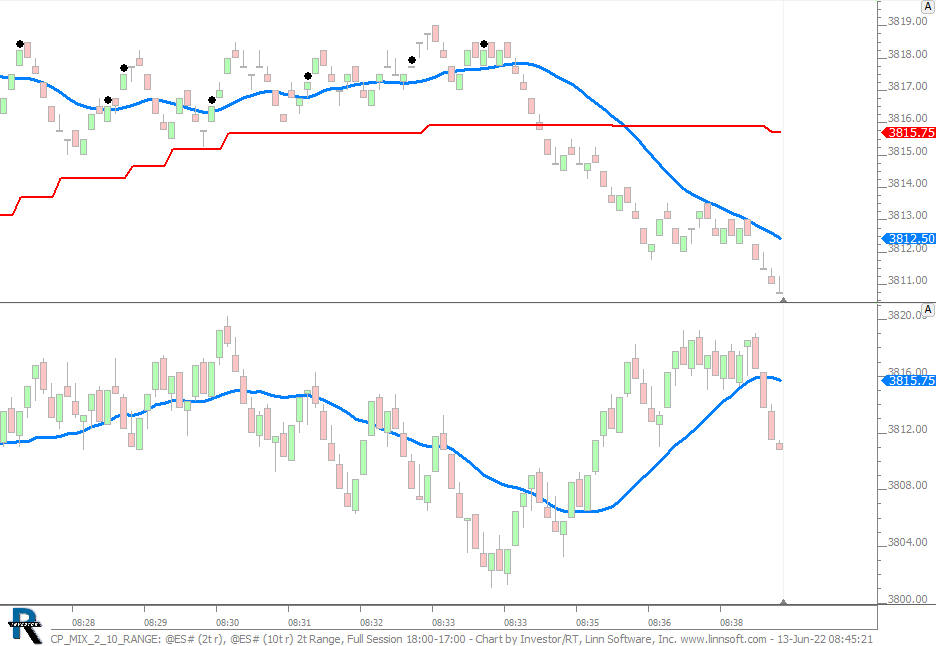 |
CP MIX 2 10 RANGE (@ES#) cpayne [totalcount]
2 years 10 months ago
This chart was uploaded by Investor/RT 15.1.8 showing symbol: @ES#. |
View |
 |
CP BarMid (@ES#) cpayne [totalcount]
2 years 10 months ago
Mid of each bar. This chart was uploaded by Investor/RT 15.1.8 showing symbol: @ES#. |
View |
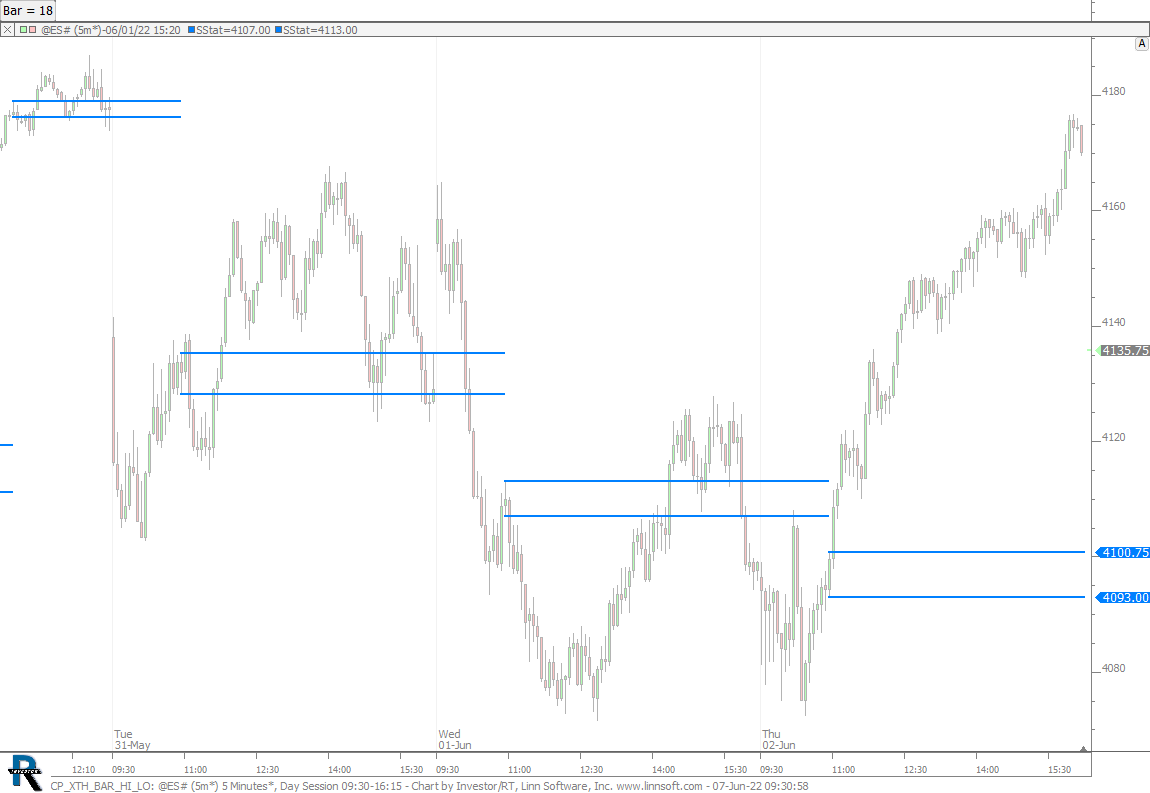 |
CP XTH BAR HI LO (@ES#) cpayne [totalcount]
2 years 10 months ago
This chart was uploaded by Investor/RT 15.1.8 showing symbol: @ES#. |
View |
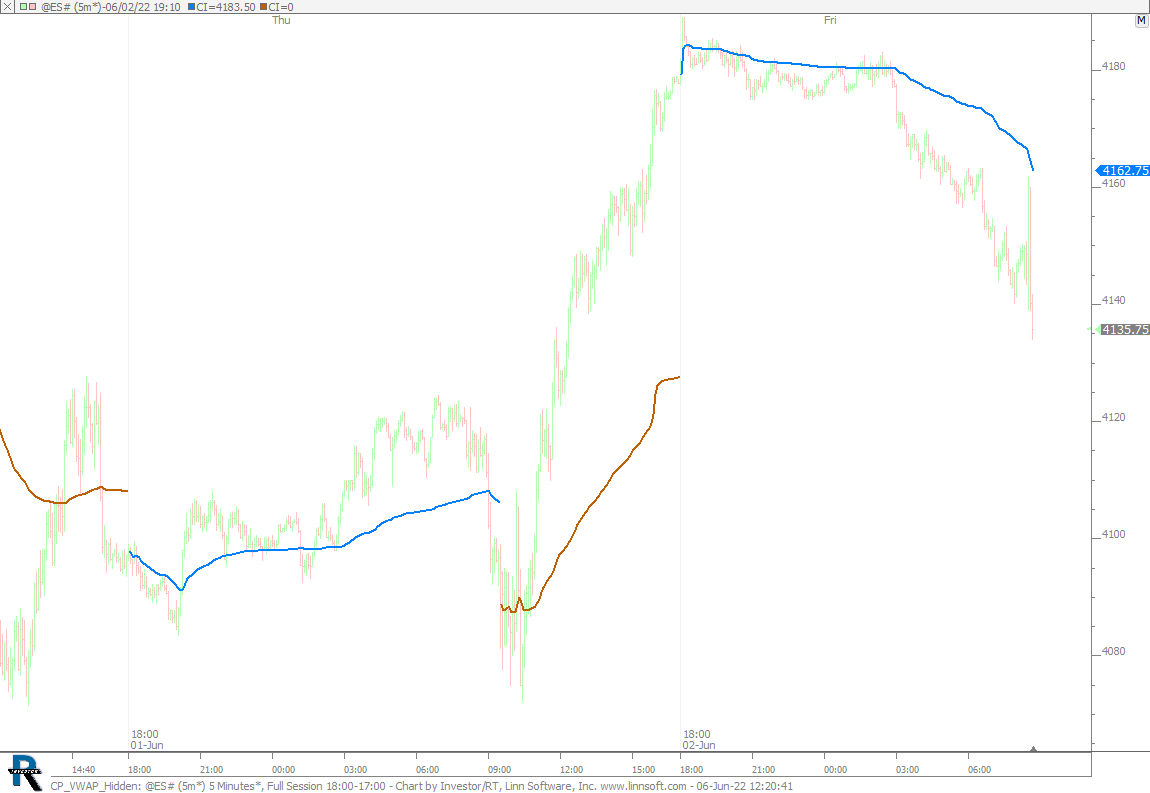 |
CP VWAP Hidden (@ES#) cpayne [totalcount]
2 years 10 months ago
This chart was uploaded by Investor/RT 15.1.8 showing symbol: @ES#. |
View |
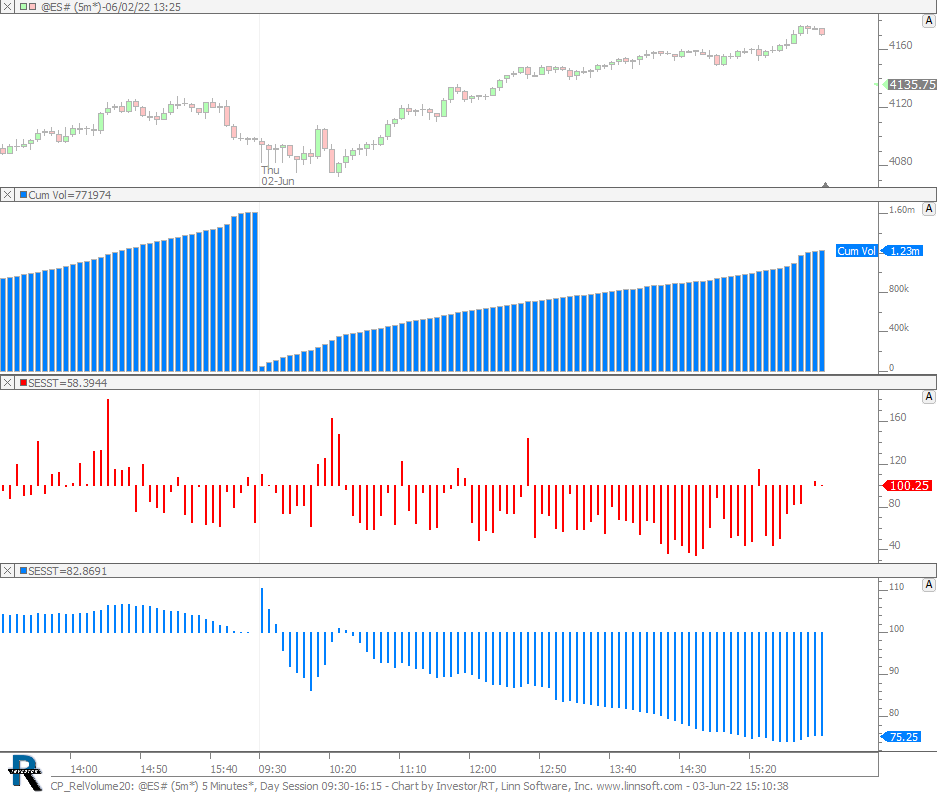 |
CP RelVolume20 (@ES#) cpayne [totalcount]
2 years 10 months ago
This chart was uploaded by Investor/RT 15.1.8 showing symbol: @ES#. |
View |
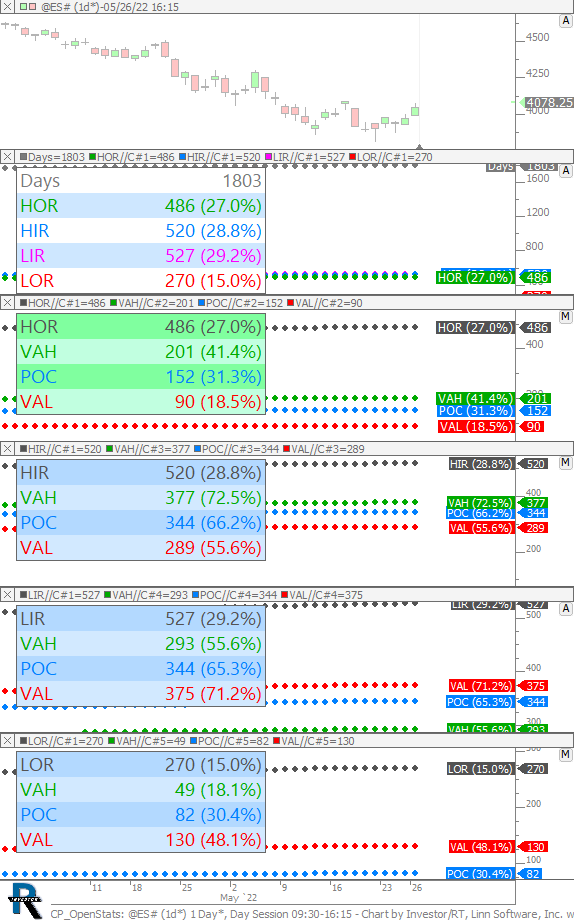 |
CP OpenStats (@ES#) cpayne [totalcount]
2 years 10 months ago
This chart was uploaded by Investor/RT 15.1.7 showing symbol: @ES#. |
View |
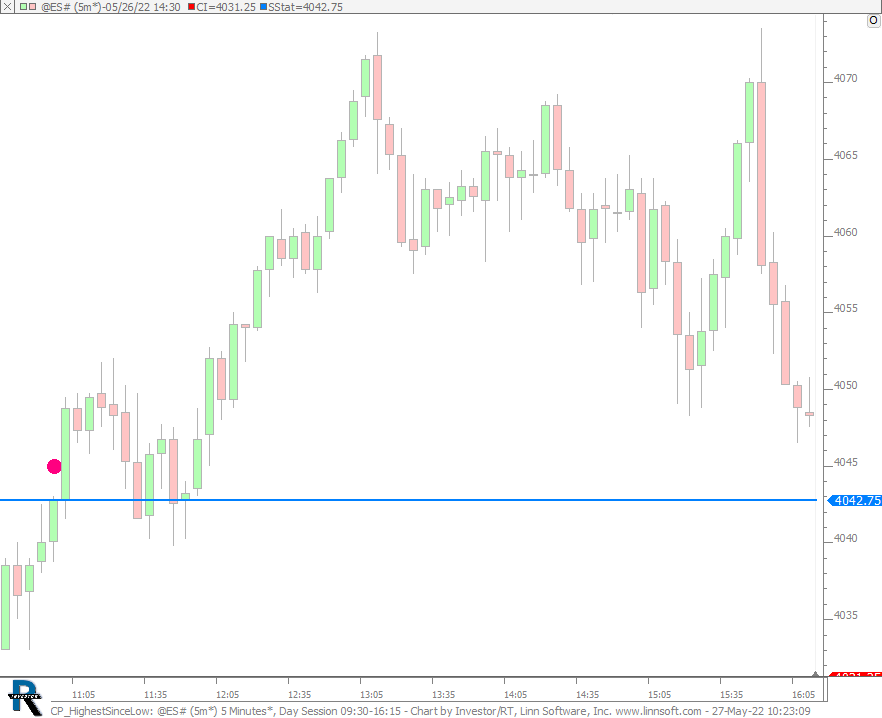 |
CP HighestSinceLow (@ES#) cpayne [totalcount]
2 years 10 months ago
This chart was uploaded by Investor/RT 15.1.7 showing symbol: @ES#. |
View |
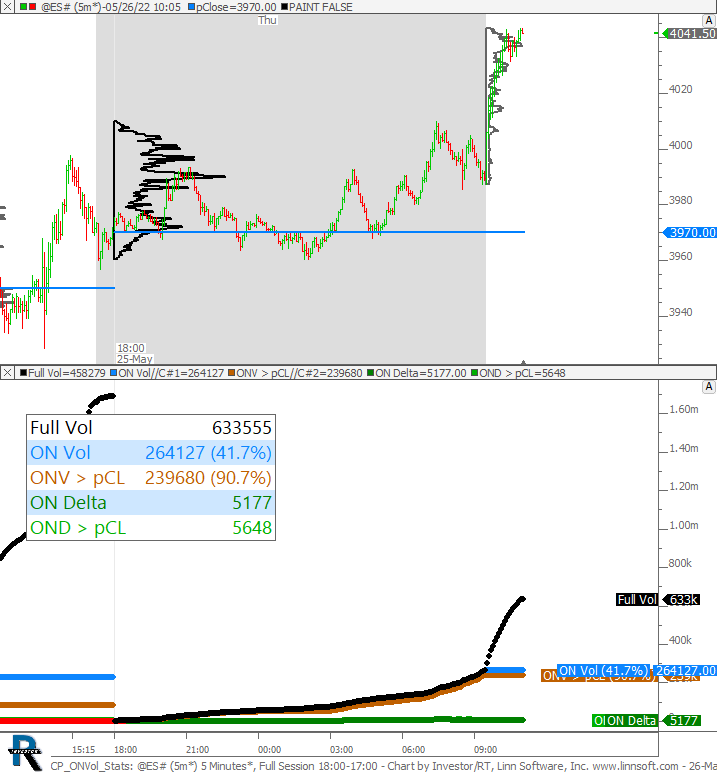 |
CP ONVol Stats (@ES#) cpayne [totalcount]
2 years 10 months ago
This chart was uploaded by Investor/RT 15.1.7 showing symbol: @ES#. |
View |
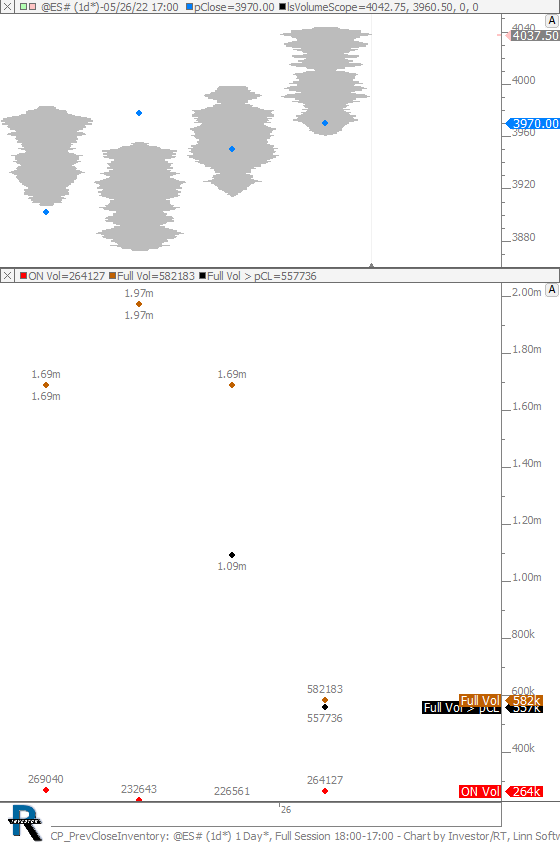 |
CP PrevCloseInventory (@ES#) cpayne [totalcount]
2 years 10 months ago
This chart was uploaded by Investor/RT 15.1.7 showing symbol: @ES#. |
View |
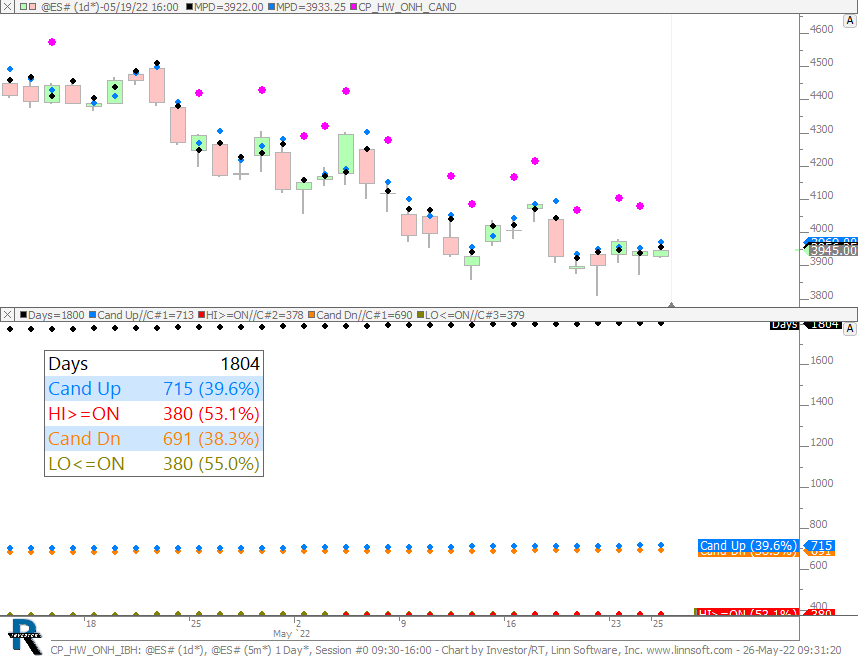 |
CP HW ONH IBH (@ES#) cpayne [totalcount]
2 years 10 months ago
This chart was uploaded by Investor/RT 15.1.4 showing symbol: @ES#. |
View |
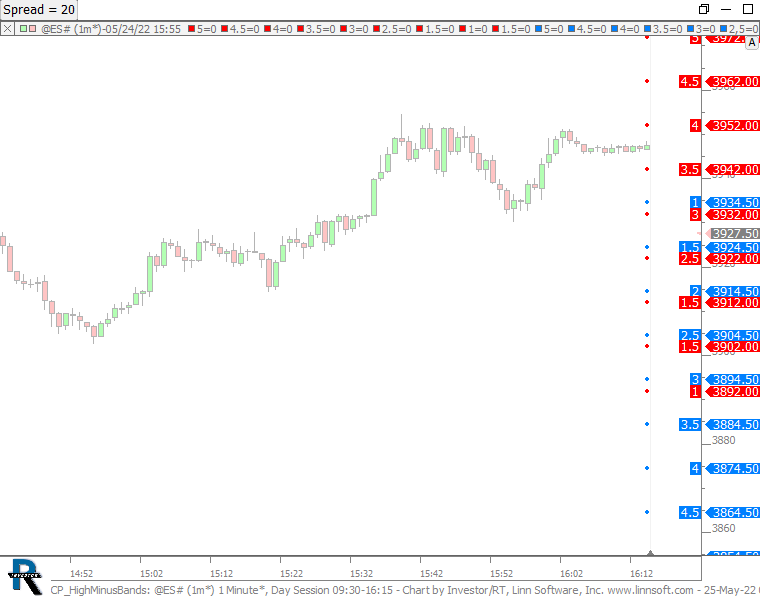 |
CP HighMinusBands (@ES#) cpayne [totalcount]
2 years 11 months ago
This chart was uploaded by Investor/RT 15.1.7 showing symbol: @ES#. |
View |
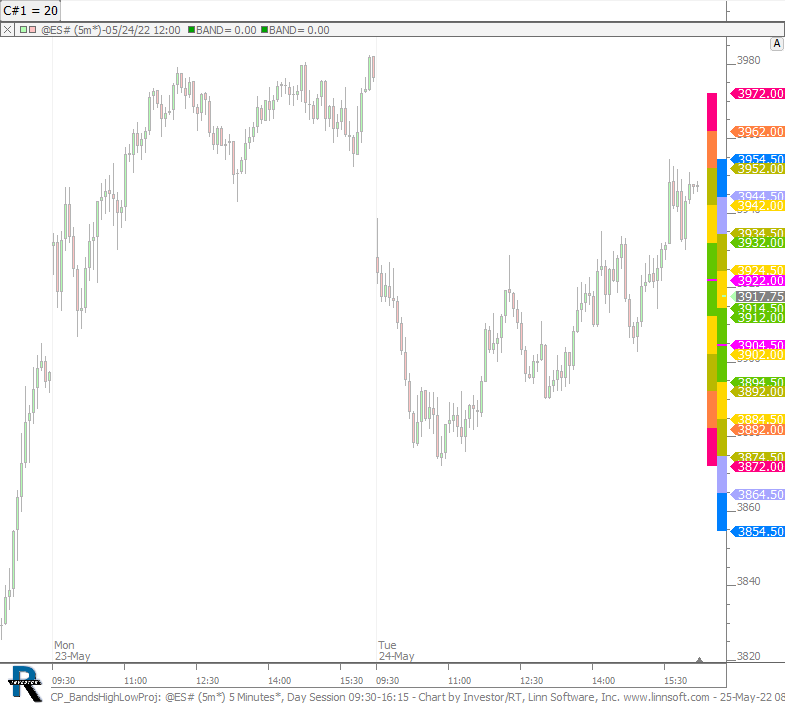 |
CP BandsHighLowProj (@ES#) cpayne [totalcount]
2 years 11 months ago
This chart was uploaded by Investor/RT 15.1.7 showing symbol: @ES#. |
View |
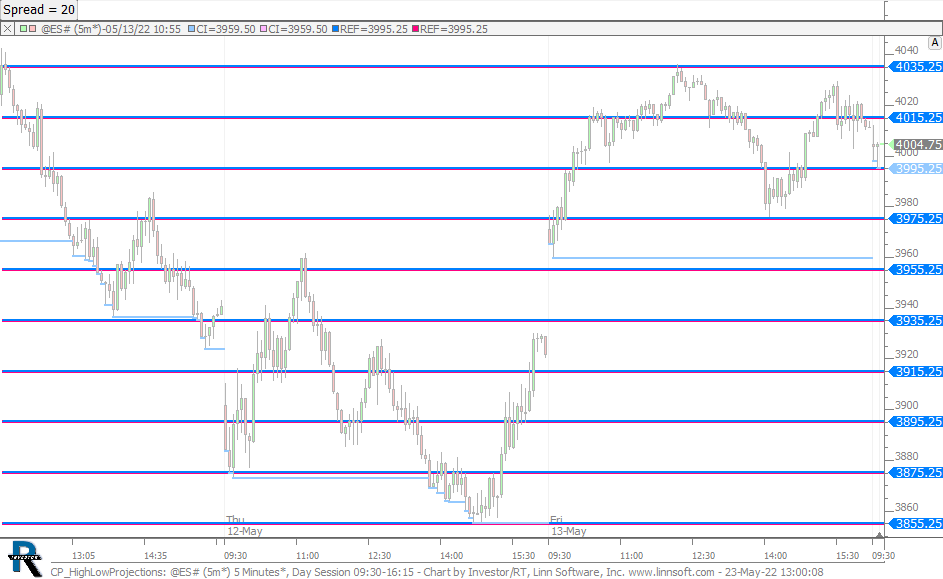 |
CP HighLowProjections (@ES#) cpayne [totalcount]
2 years 11 months ago
This chart was uploaded by Investor/RT 15.1.7 showing symbol: @ES#. |
View |
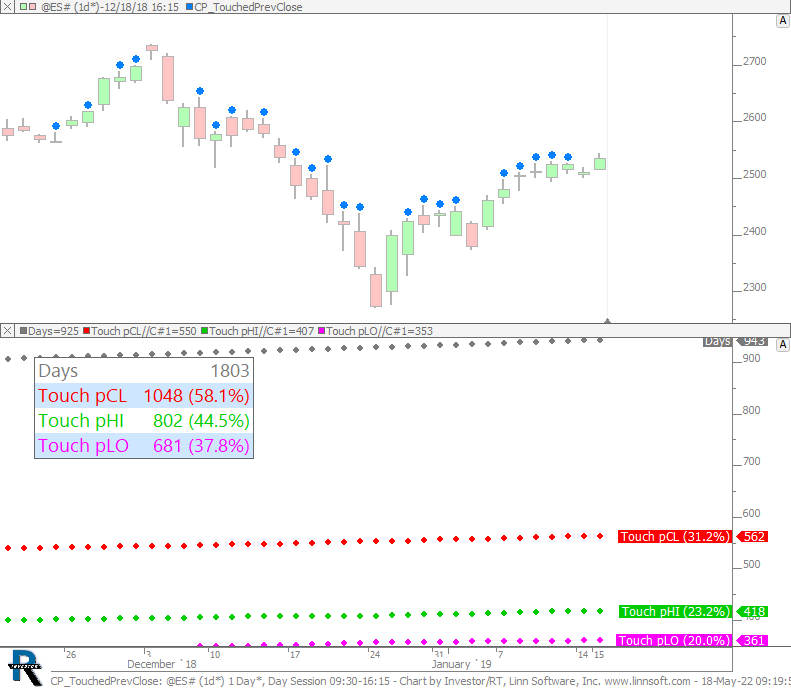 |
CP TouchedPrevClose (@ES#) cpayne [totalcount]
2 years 11 months ago
Counts the number of days that price touched the prior close. In our study, price touched previous close on 1048 of 1803 days (58.1%). |
View |
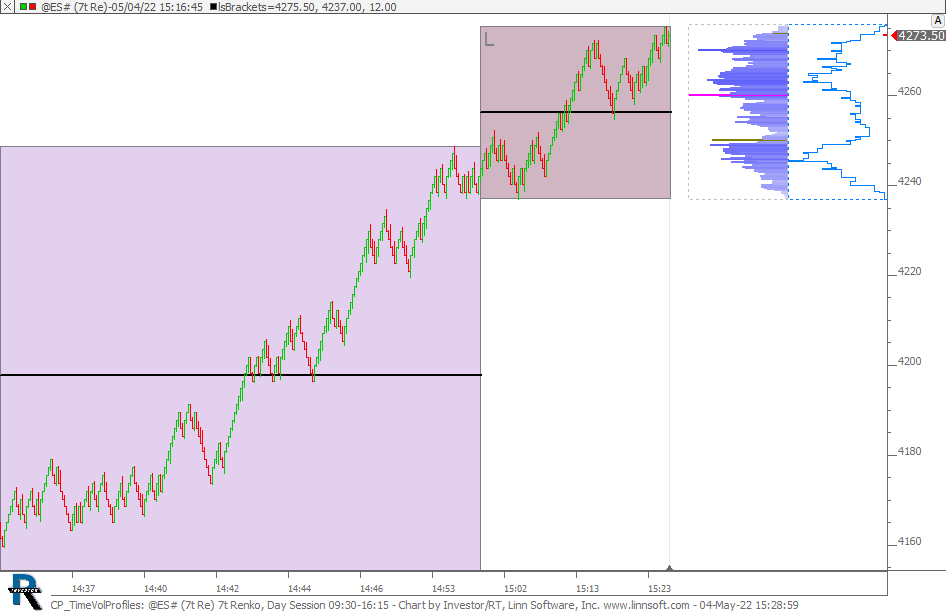 |
CP TimeVolProfiles (@ES#) cpayne [totalcount]
2 years 11 months ago
This chart was uploaded by Investor/RT 15.1.6 showing symbol: @ES#. |
View |
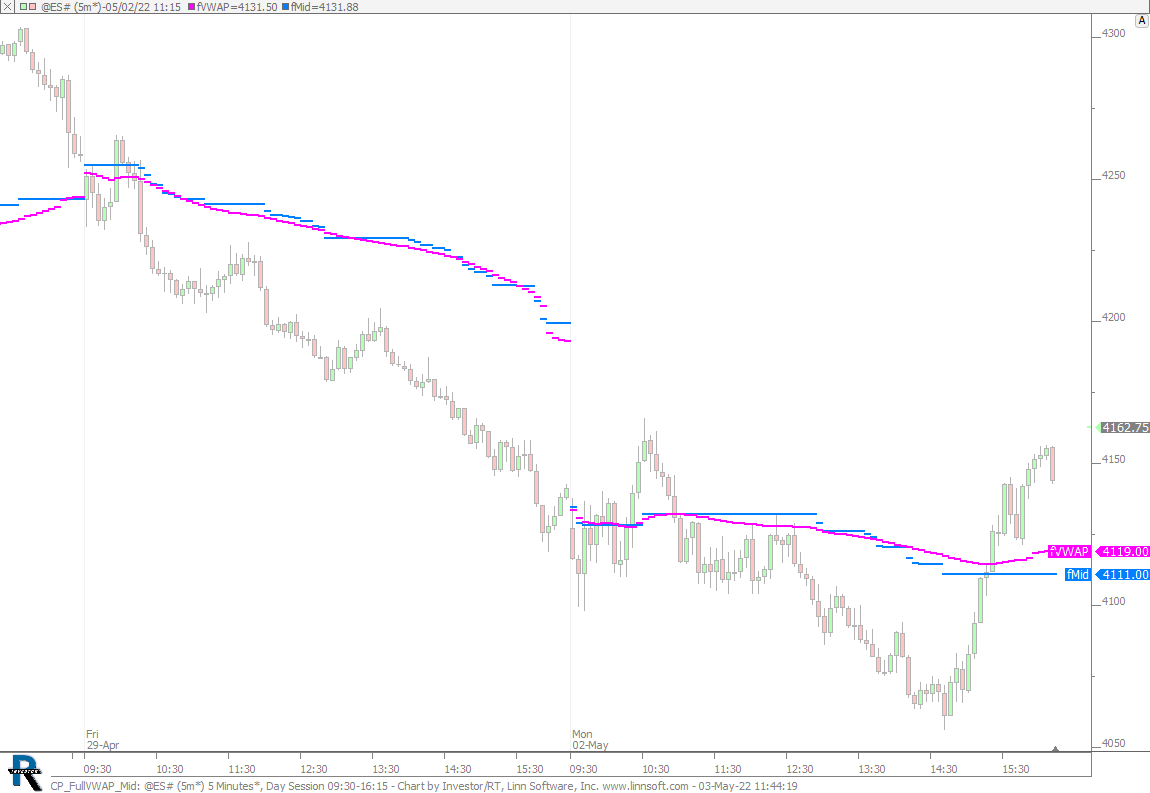 |
CP FullVWAP Mid (@ES#) cpayne [totalcount]
2 years 11 months ago
Full Session Midpoint and VWAP. This chart was uploaded by Investor/RT 15.1.6 showing symbol: @ES#. |
View |
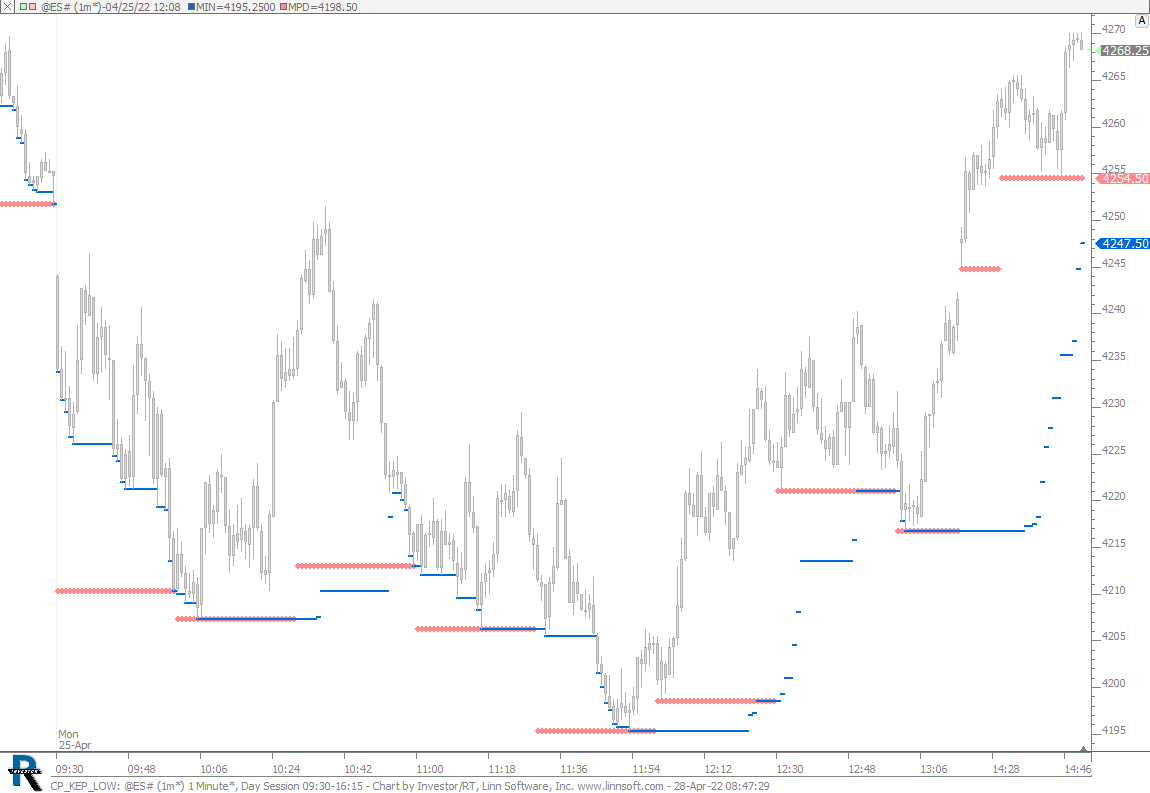 |
CP KEP LOW (@ES#) cpayne [totalcount]
2 years 11 months ago
This chart was uploaded by Investor/RT 15.1.6 showing symbol: @ES#. |
View |
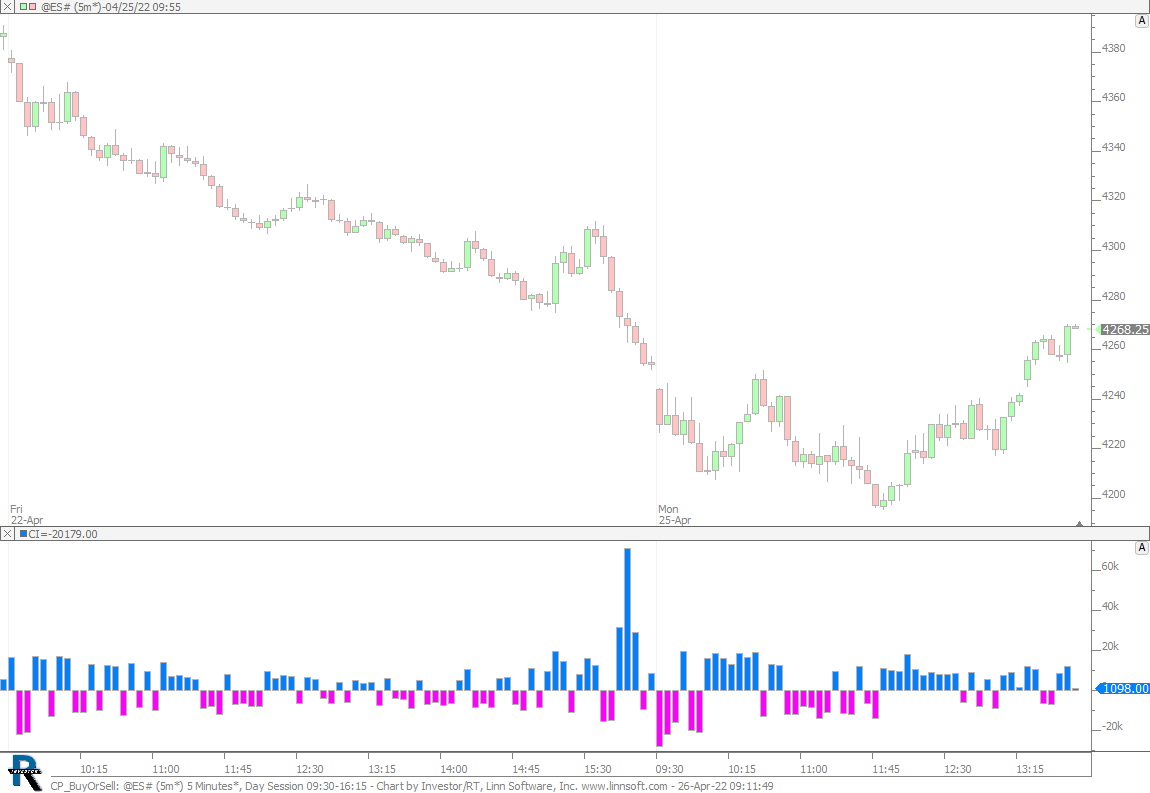 |
CP BuyOrSell (@ES#) cpayne [totalcount]
2 years 11 months ago
This chart was uploaded by Investor/RT 15.1.6 showing symbol: @ES#. |
View |
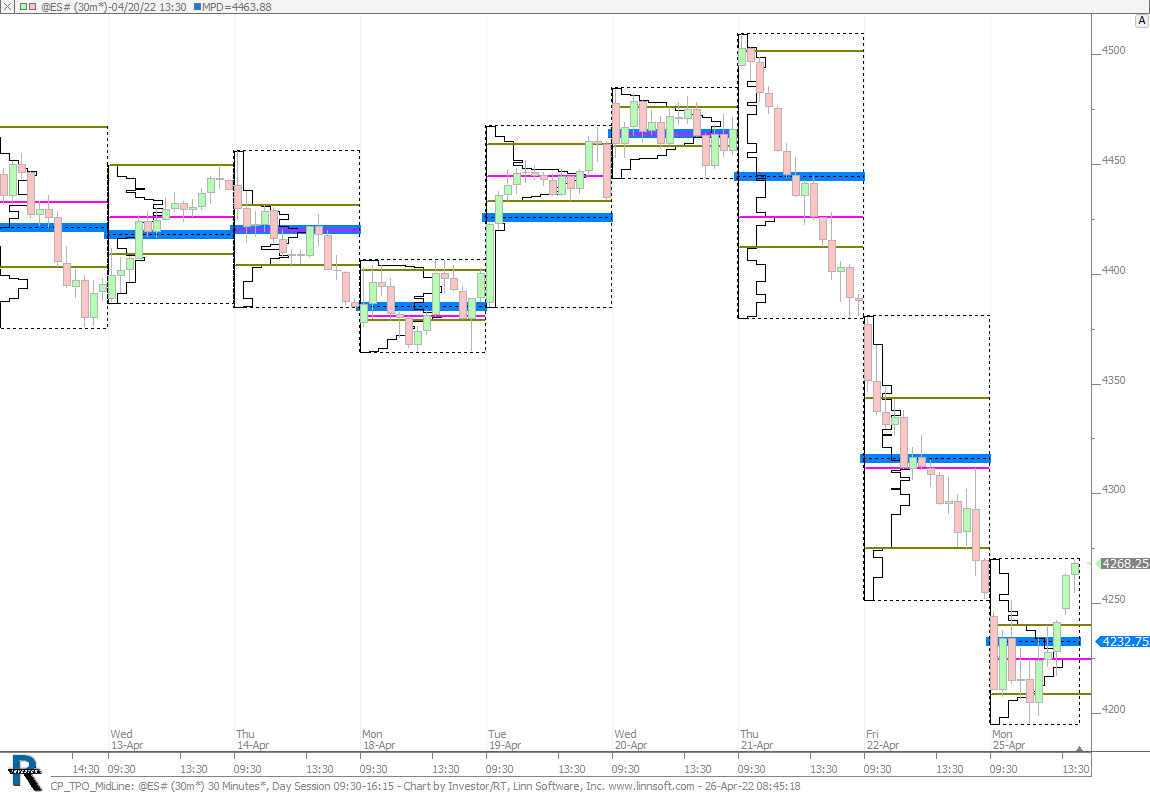 |
CP TPO MidLine (@ES#) cpayne [totalcount]
2 years 11 months ago
This chart was uploaded by Investor/RT 15.1.6 showing symbol: @ES#. |
View |
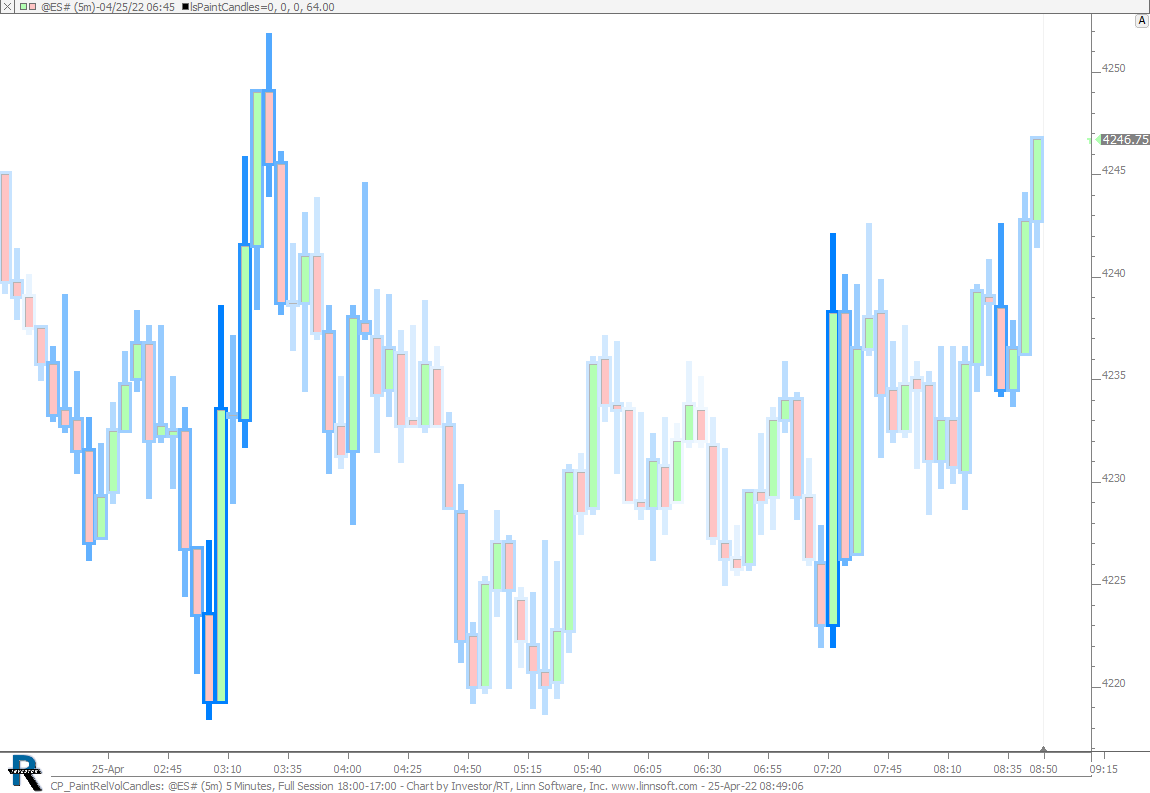 |
CP PaintRelVolCandles (@ES#) cpayne [totalcount]
2 years 12 months ago
Paint Candles based on Relative Volume. This chart was uploaded by Investor/RT 15.1.6 showing symbol: @ES#. |
View |
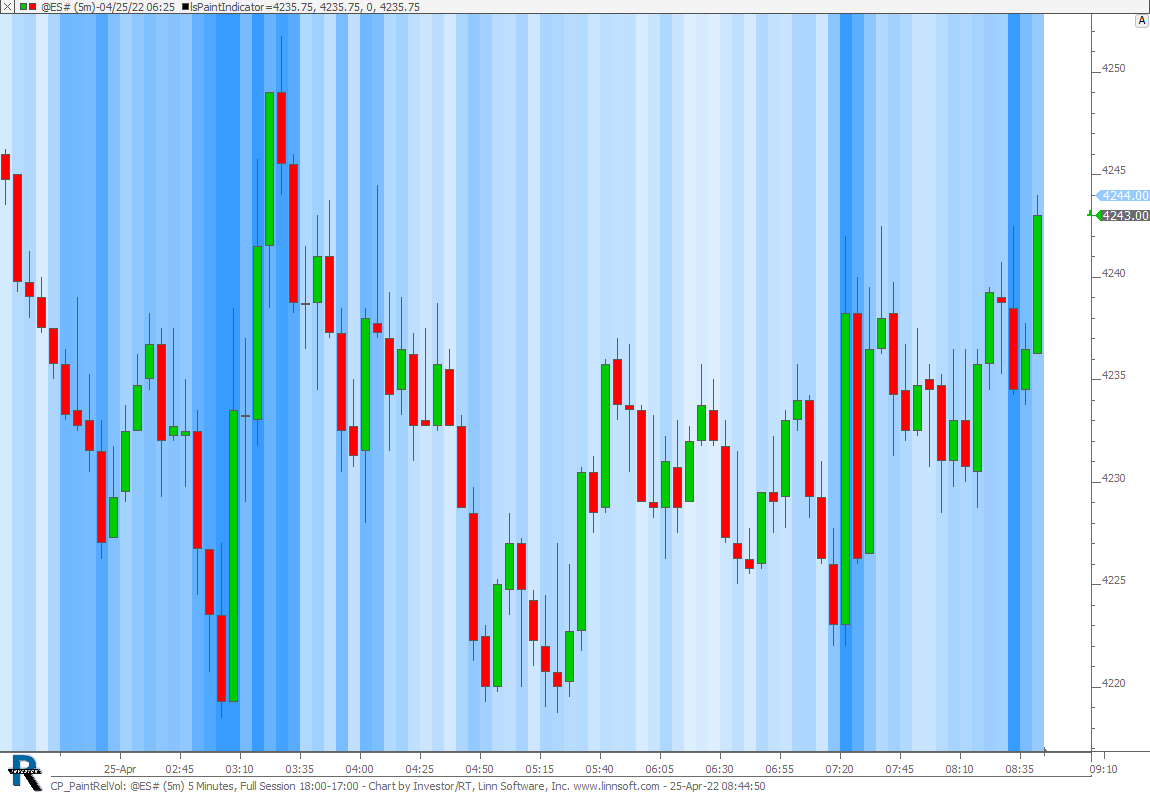 |
CP PaintRelVol (@ES#) cpayne [totalcount]
2 years 12 months ago
Paint Background based on relative volume. This chart was uploaded by Investor/RT 15.1.6 showing symbol: @ES#. |
View |
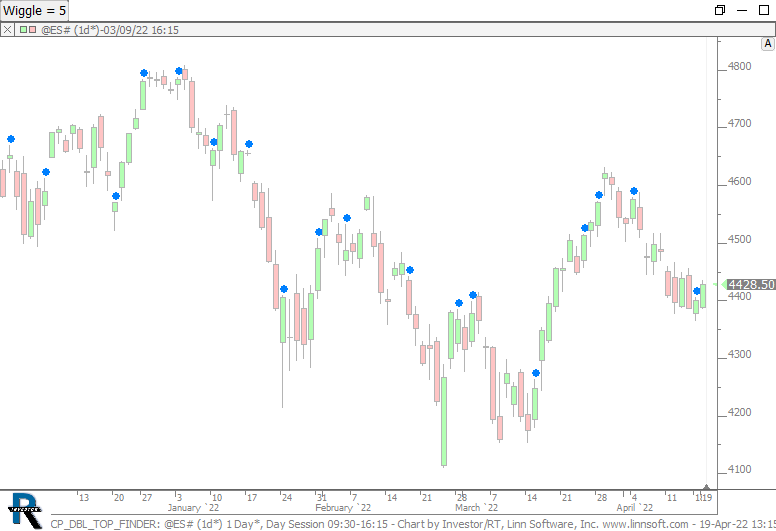 |
CP DBL TOP FINDER (@ES#) cpayne [totalcount]
3 years 21 hours ago
Double Tops within Daily Bars. This chart was uploaded by Investor/RT 15.1.6 showing symbol: @ES#. |
View |