 |
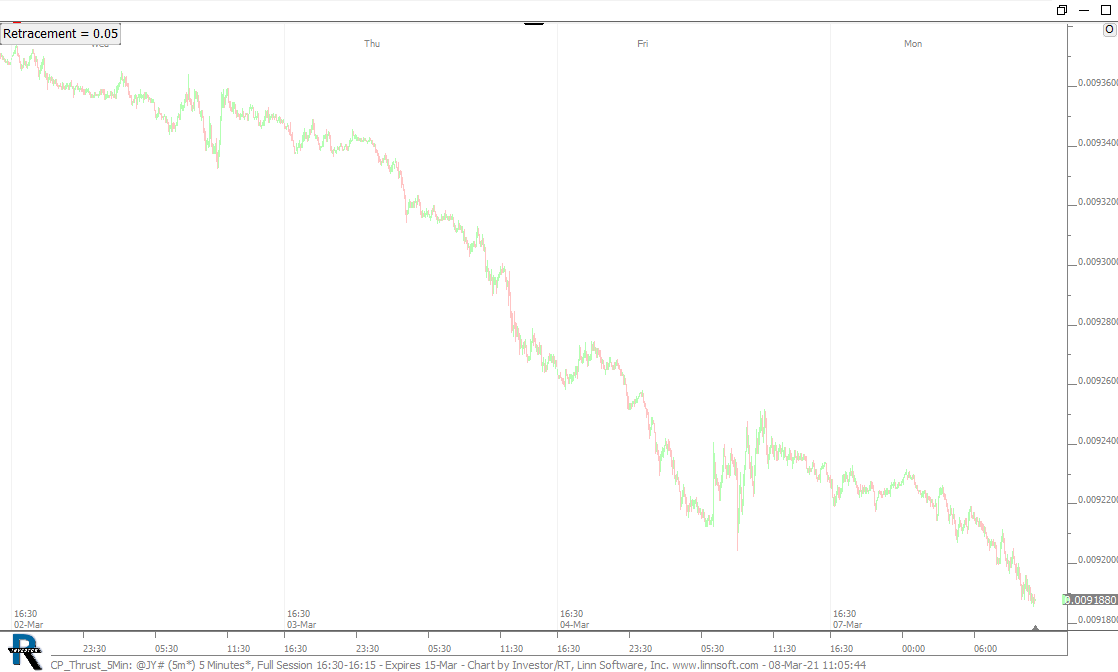
CP Thrust 5Min (@JY#) cpayne [totalcount]
4 years 1 month ago
This chart was uploaded by Investor/RT 14.2.6 showing symbol: @JY#. |
View |
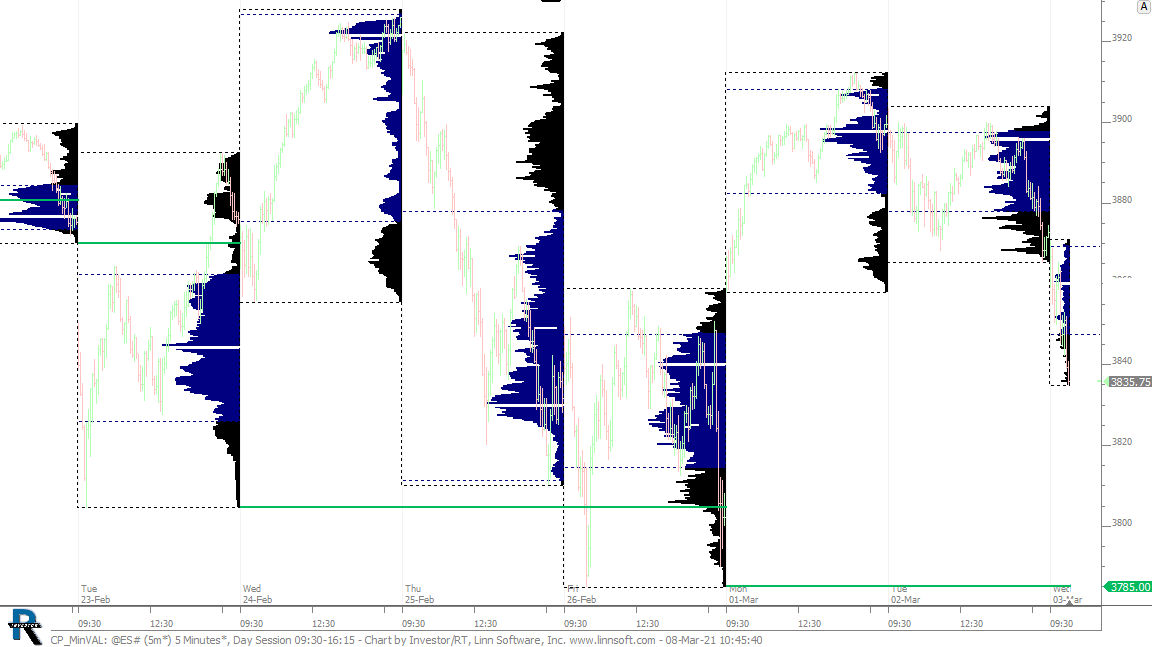 |
CP MinVAL (@ES#) cpayne [totalcount]
4 years 1 month ago
Min VAL of last 5 profiles. This chart was uploaded by Investor/RT 14.2.6 showing symbol: @ES#. |
View |
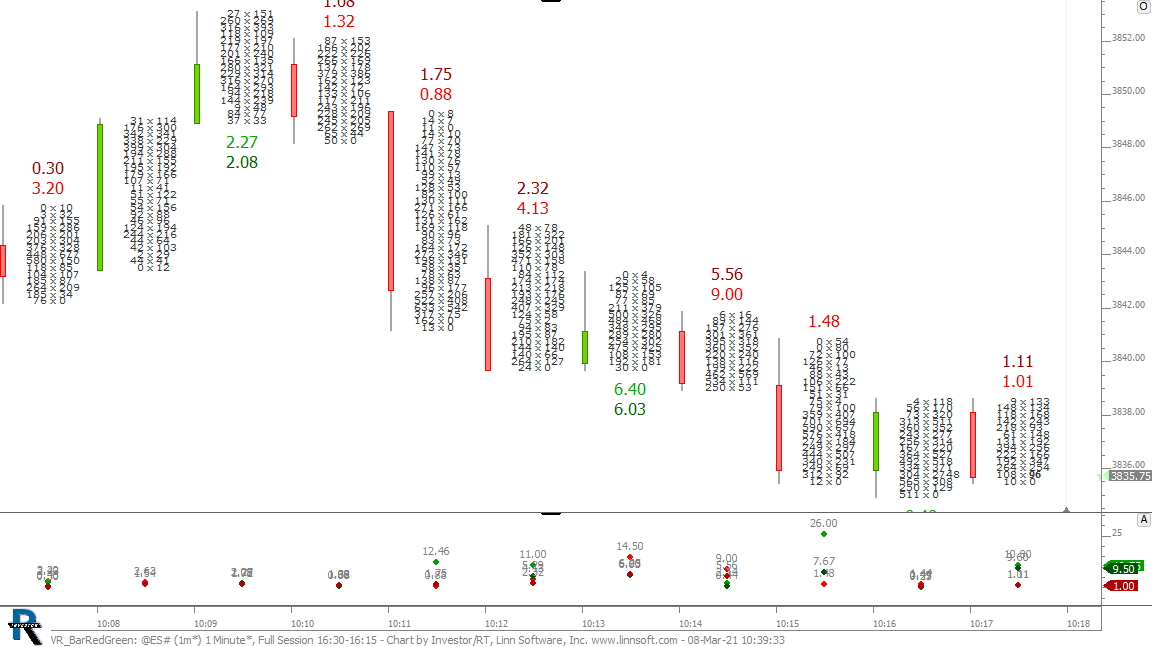 |
VR BarRedGreen (@ES#) cpayne [totalcount]
4 years 1 month ago
This chart was uploaded by Investor/RT 14.2.6 showing symbol: @ES#. |
View |
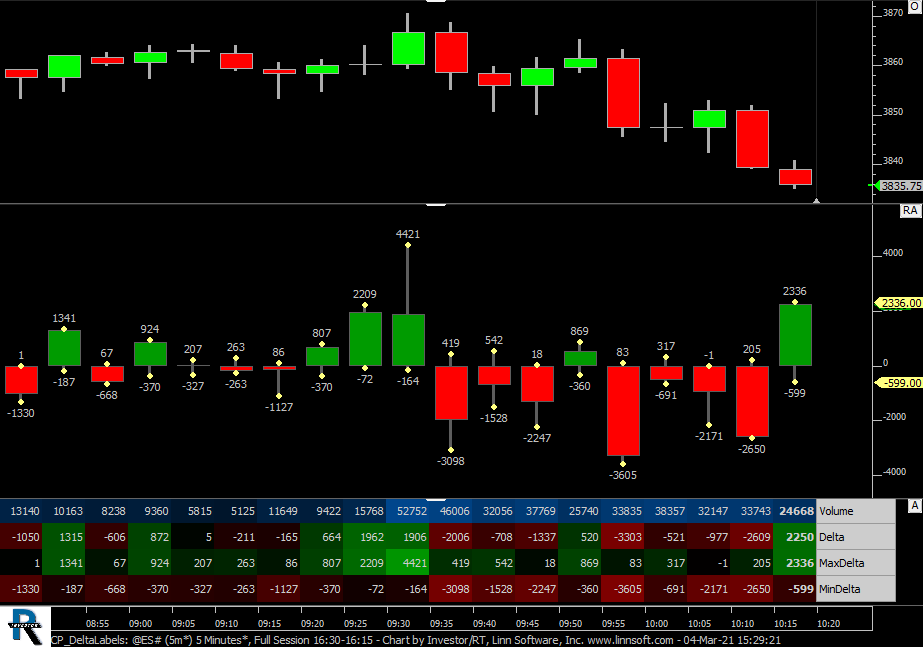 |
CP DeltaLabels (@ES#) cpayne [totalcount]
4 years 1 month ago
Max and Min Delta Labels. This chart was uploaded by Investor/RT 14.2.6 showing symbol: @ES#. |
View |
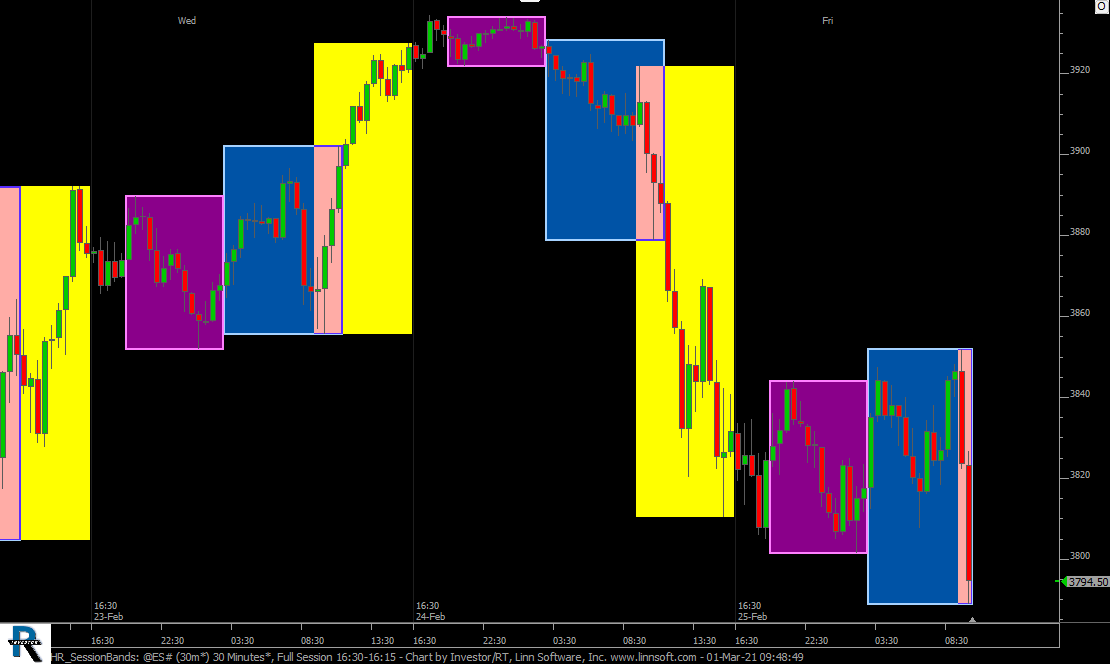 |
HR SessionBands (@ES#) cpayne [totalcount]
4 years 1 month ago
Bands for US, Asia, and Europe Sessoin. This chart was uploaded by Investor/RT 14.2.6 showing symbol: @ES#. |
View |
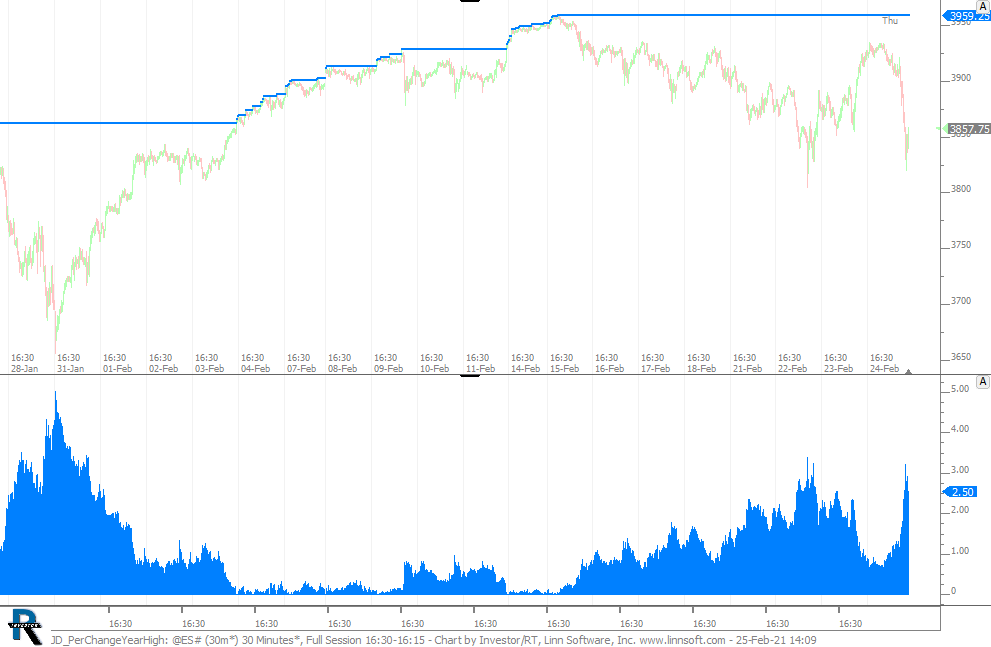 |
JD PerChangeYearHigh (@ES#) cpayne [totalcount]
4 years 1 month ago
Percent Change from Yearly High. This chart was uploaded by Investor/RT 14.2.6 showing symbol: @ES#. |
View |
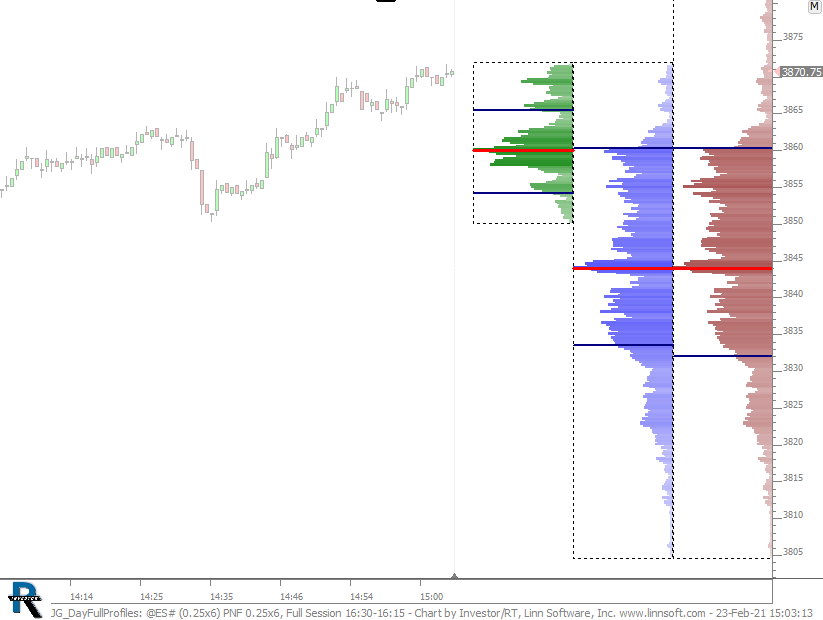 |
JG DayFullProfiles (@ES#) cpayne [totalcount]
4 years 1 month ago
Day and Full Session Profiles. This chart was uploaded by Investor/RT 14.2.6 showing symbol: @ES#. |
View |
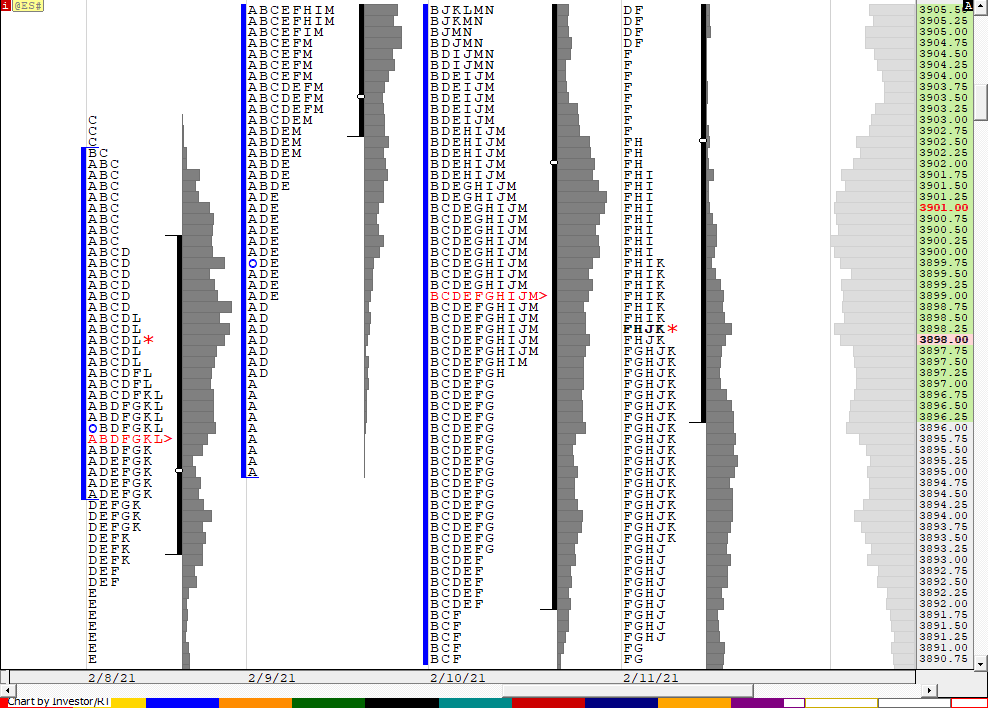 |
CD MarketProfile (@ES#) cpayne [totalcount]
4 years 2 months ago
Market Profile with Volume. This chart was uploaded by Investor/RT 14.2.6 showing symbol: @ES#. |
View |
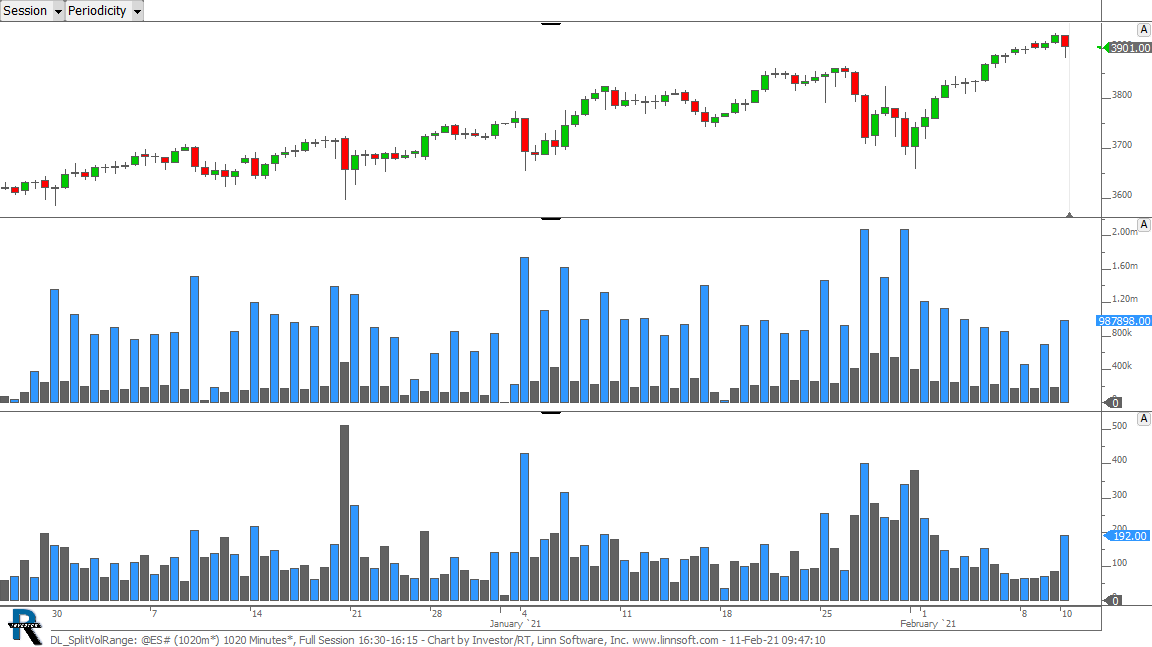 |
DL SplitVolRange (@ES#) cpayne [totalcount]
4 years 2 months ago
Day Session vs ON Session Volume and Range. This chart was uploaded by Investor/RT 14.2.6 showing symbol: @ES#. |
View |
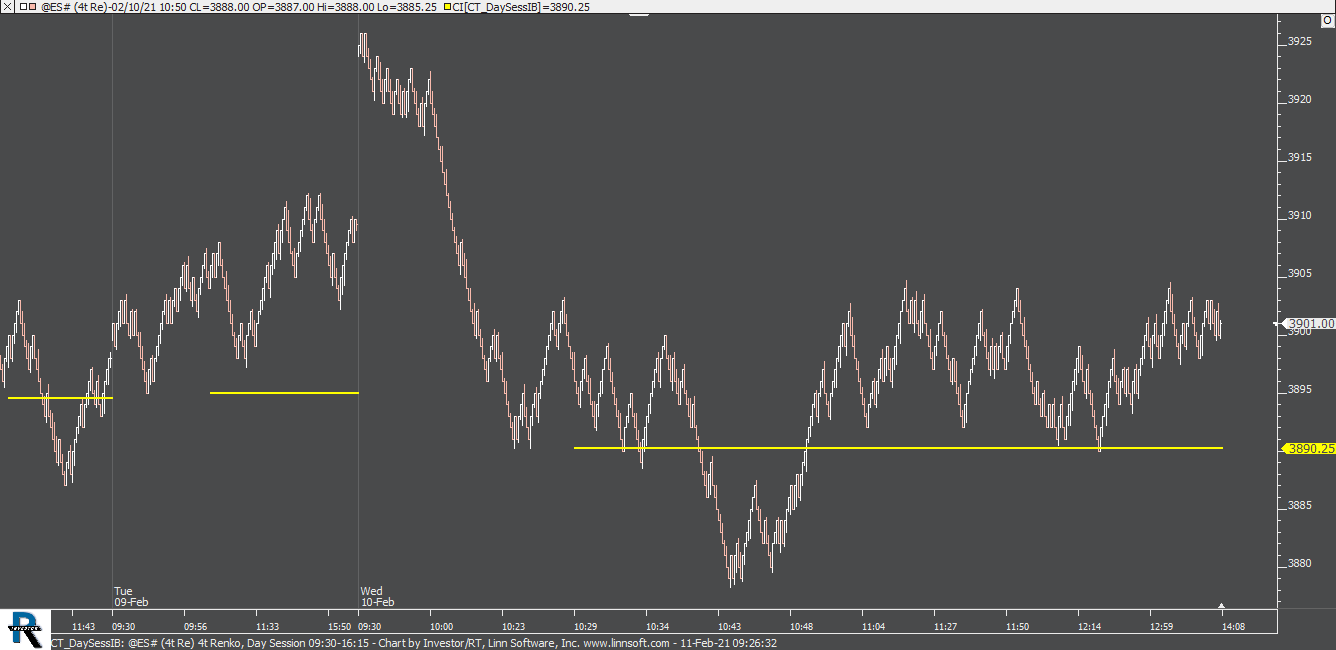 |
CT DaySessIB (@ES#) cpayne [totalcount]
4 years 2 months ago
This chart was uploaded by Investor/RT 14.2.6 showing symbol: @ES#. |
View |
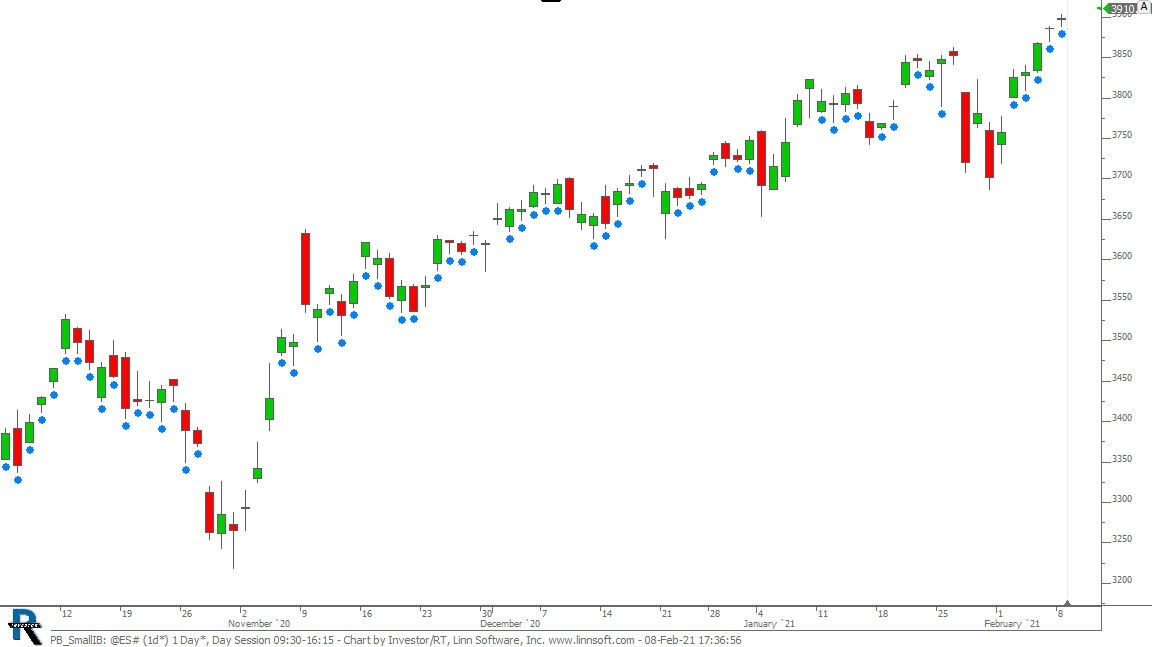 |
PB SmallIB (@ES#) cpayne [totalcount]
4 years 2 months ago
This chart was uploaded by Investor/RT 14.2.6 showing symbol: @ES#. |
View |
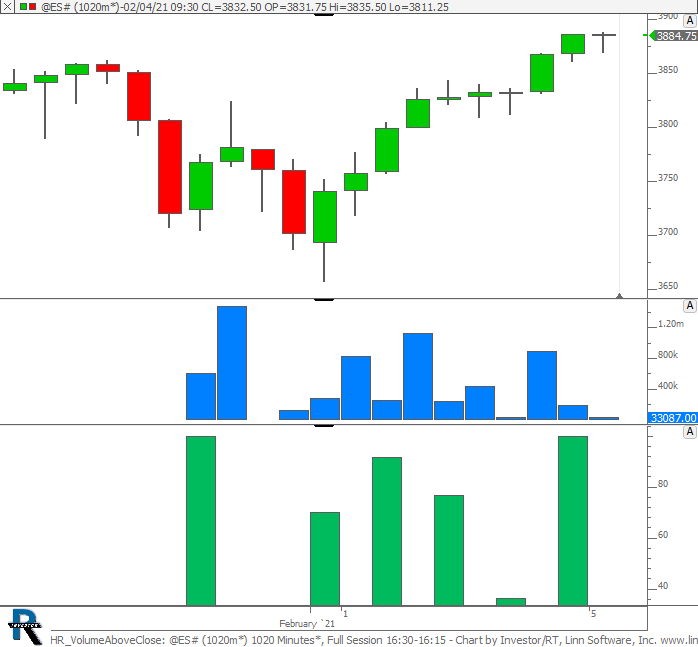 |
HR VolumeAboveClose (@ES#) cpayne [totalcount]
4 years 2 months ago
This chart was uploaded by Investor/RT 14.2.6 showing symbol: @ES#. |
View |
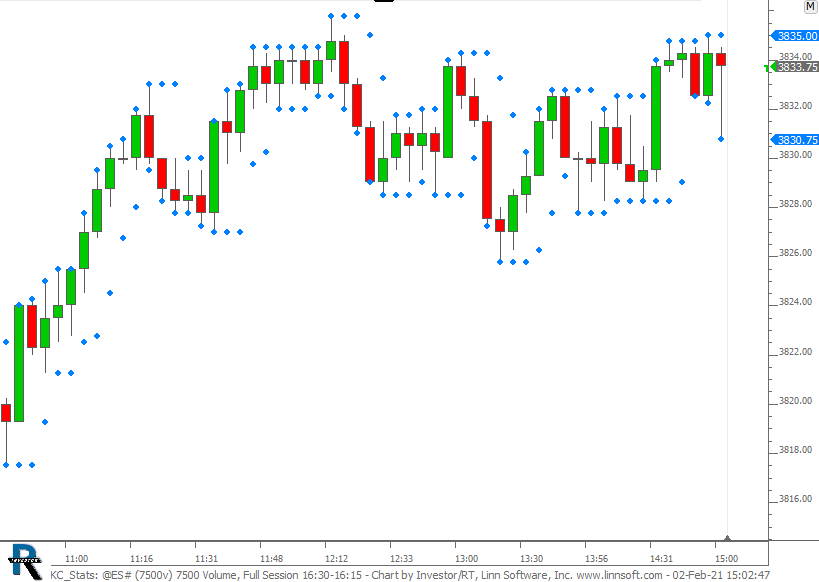 |
KC Stats (@ES#) cpayne [totalcount]
4 years 2 months ago
This chart was uploaded by Investor/RT 14.2.6 showing symbol: @ES#. |
View |
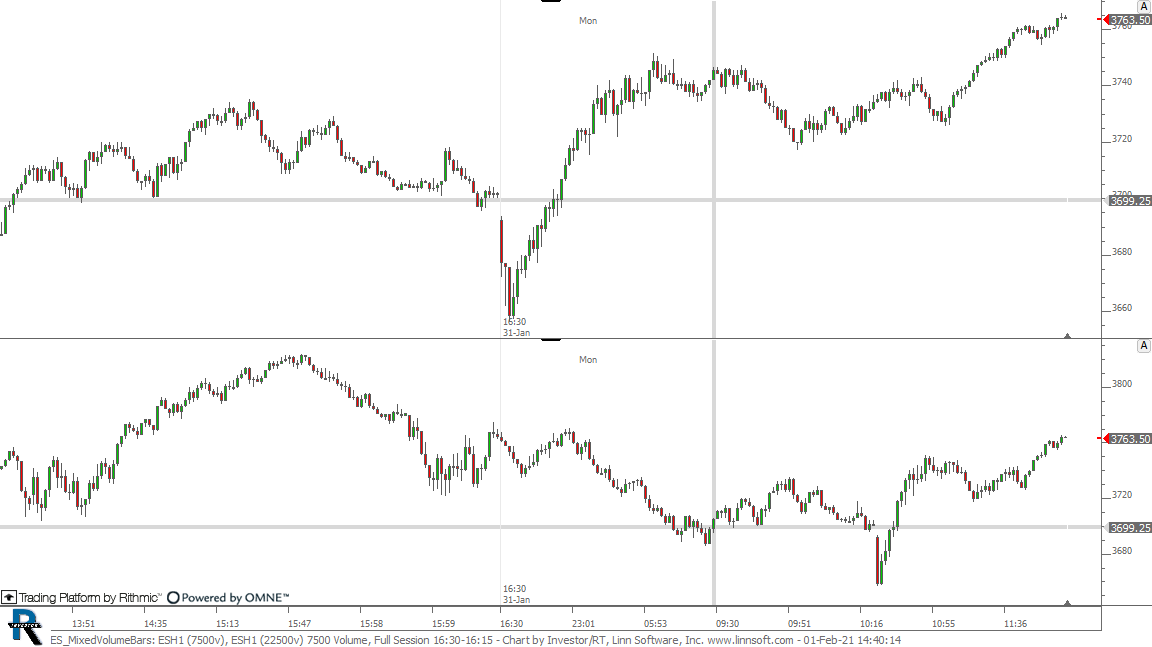 |
ES MixedVolumeBars (ESH1) cpayne [totalcount]
4 years 2 months ago
This chart was uploaded by Investor/RT 14.2.6 showing symbol: ESH1. |
View |
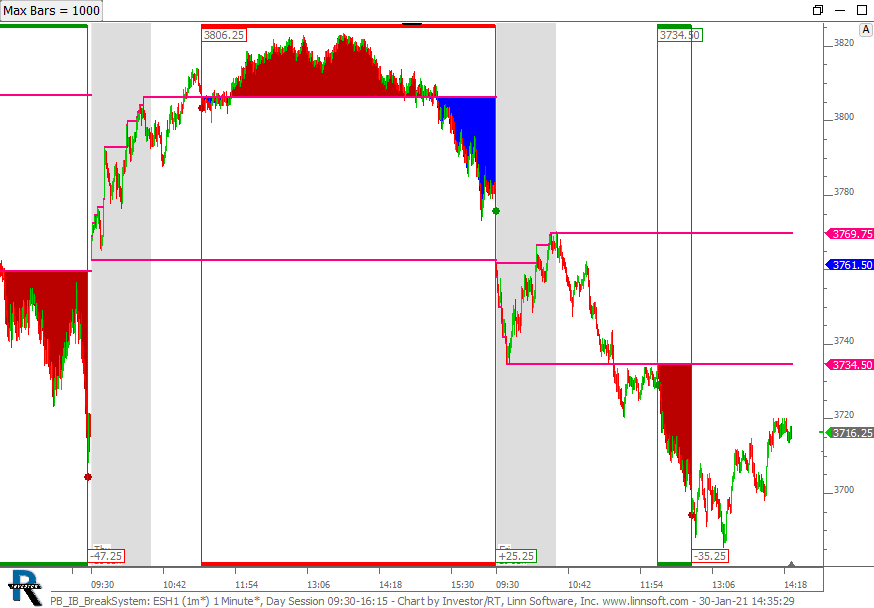 |
PB IB BreakSystem (ESH1) cpayne [totalcount]
4 years 2 months ago
This chart was uploaded by Investor/RT 14.2.6 showing symbol: ESH1. |
View |
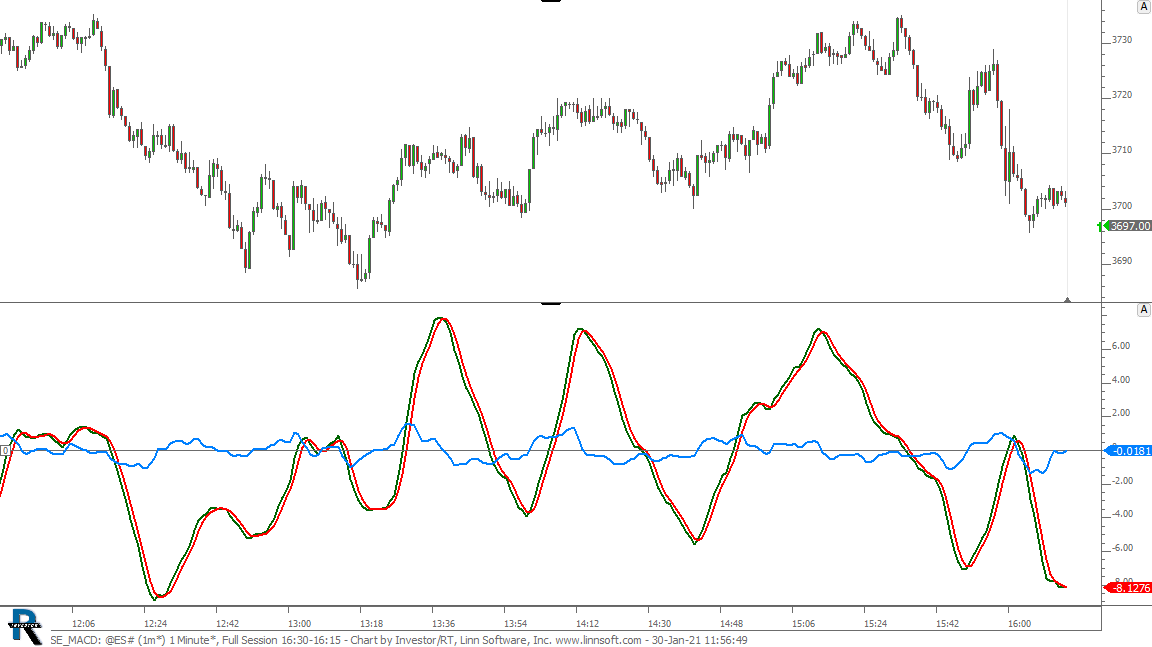 |
SE MACD (@ES#) cpayne [totalcount]
4 years 2 months ago
MACD with Signal. This chart was uploaded by Investor/RT 14.2.6 showing symbol: @ES#. |
View |
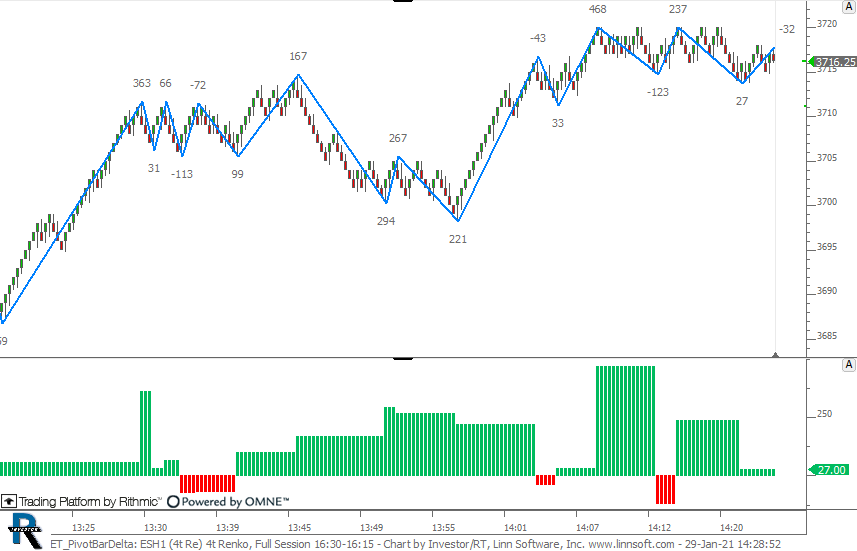 |
ET PivotBarDelta (ESH1) cpayne [totalcount]
4 years 2 months ago
Pivot Bar Delta in Custom Indicator. This chart was uploaded by Investor/RT 14.2.6 showing symbol: ESH1. |
View |
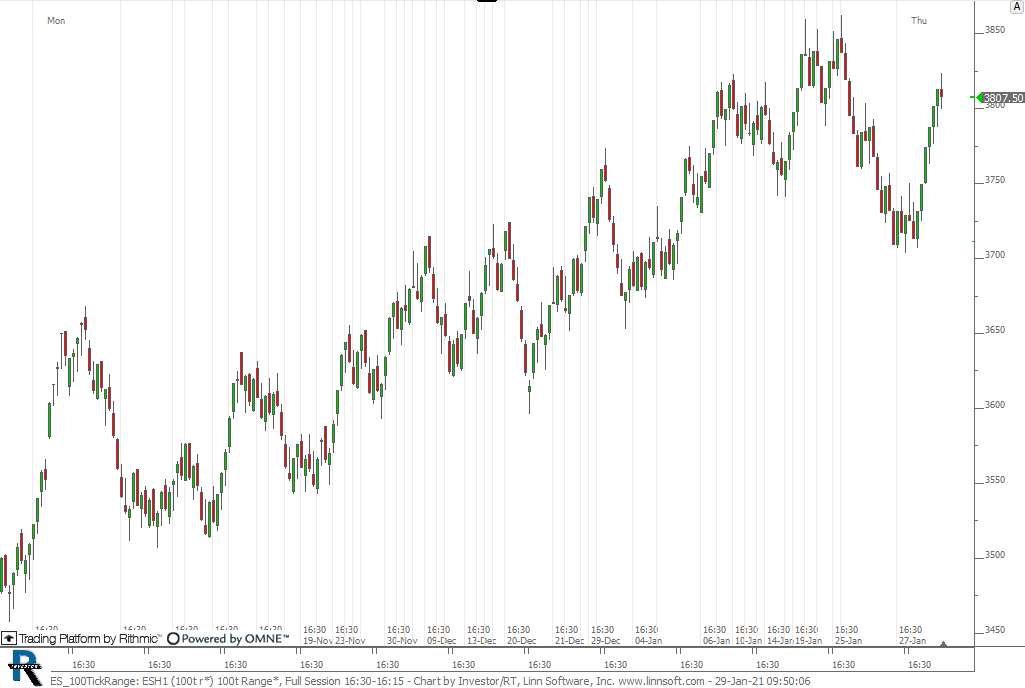 |
ES 100TickRange (ESH1) cpayne [totalcount]
4 years 2 months ago
This chart was uploaded by Investor/RT 14.2.6 showing symbol: ESH1. |
View |
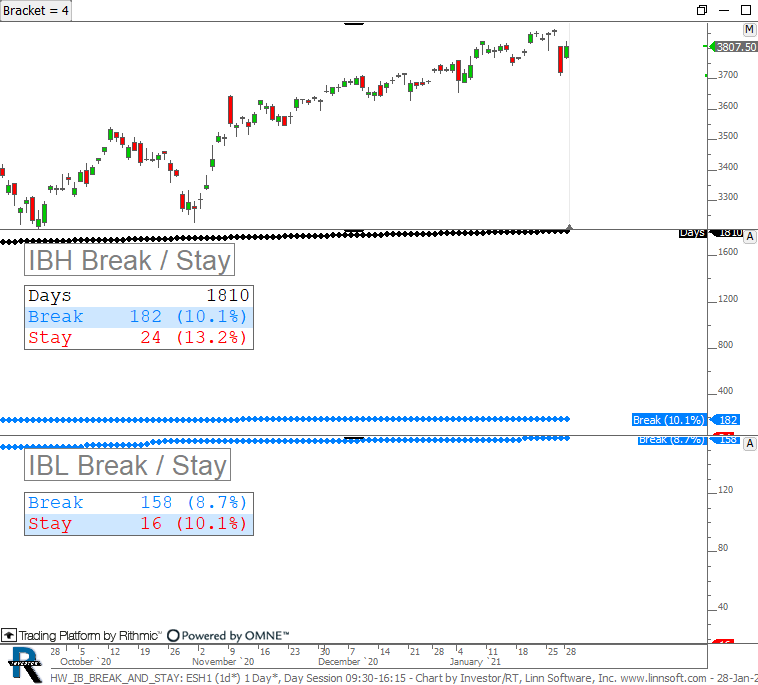 |
HW IB BREAK AND STAY (ESH1) cpayne [totalcount]
4 years 2 months ago
Chart shows how many days price first broke above the IBH during each bracket and how often it stayed above the IBH for the rest of the brackets. |
View |
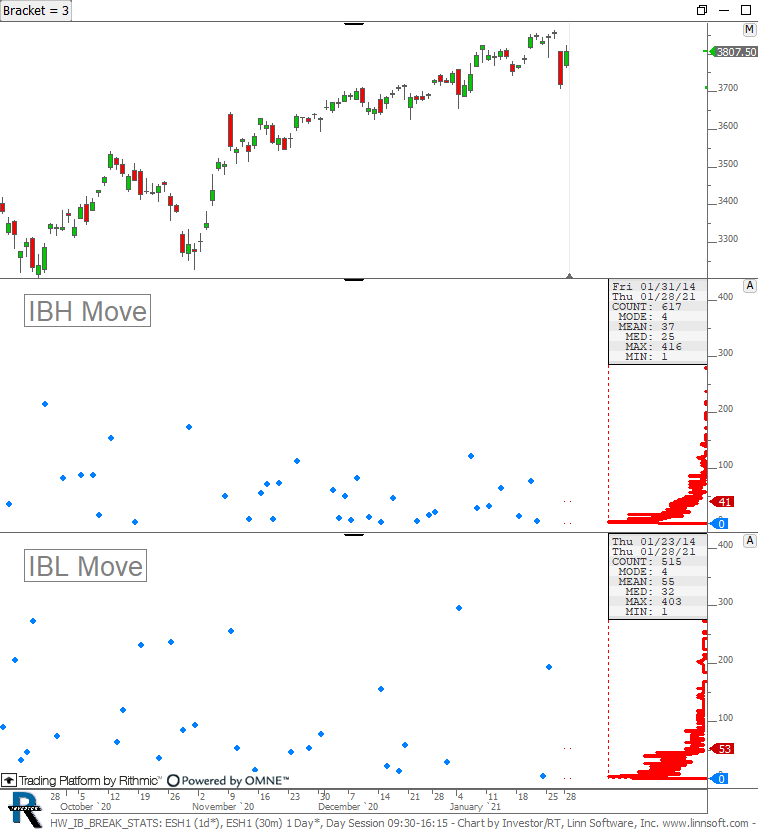 |
HW IB BREAK STATS (ESH1) cpayne [totalcount]
4 years 2 months ago
Chart plots the max moves that occur beyond IBH and IBL when price breaks the IBH and IBL during each bracket. Use button at top to adjust bracket (3 for C, 4 for D, etc). |
View |
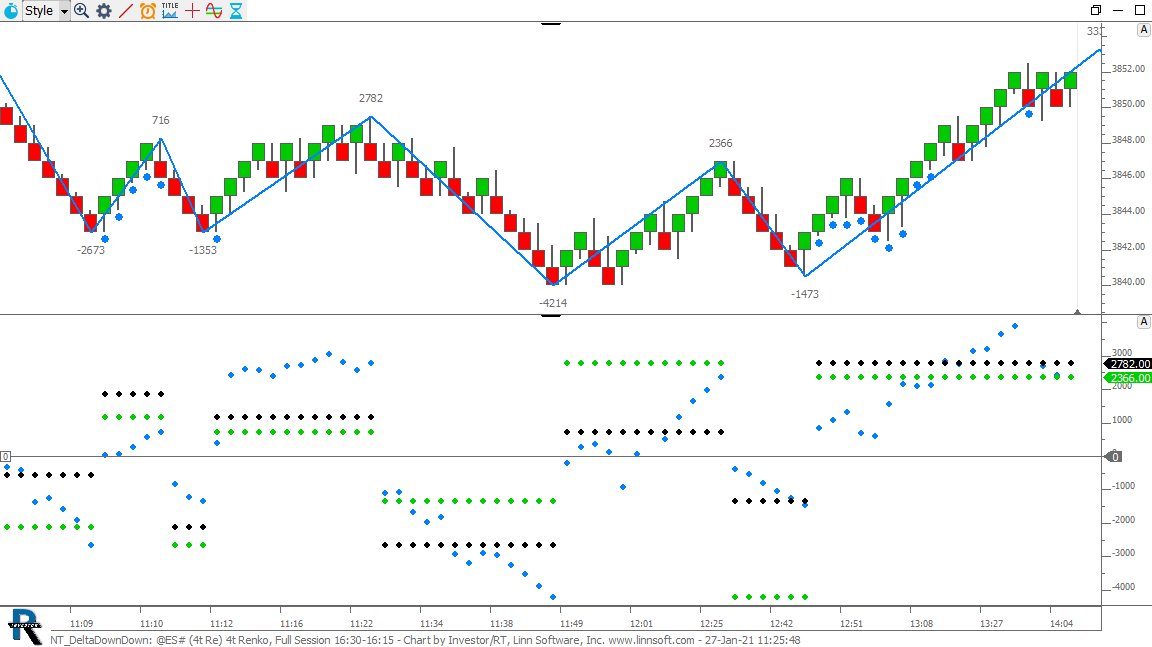 |
NT DeltaDownDown (@ES#) cpayne [totalcount]
4 years 2 months ago
This chart was uploaded by Investor/RT 14.2.6 showing symbol: @ES#. |
View |
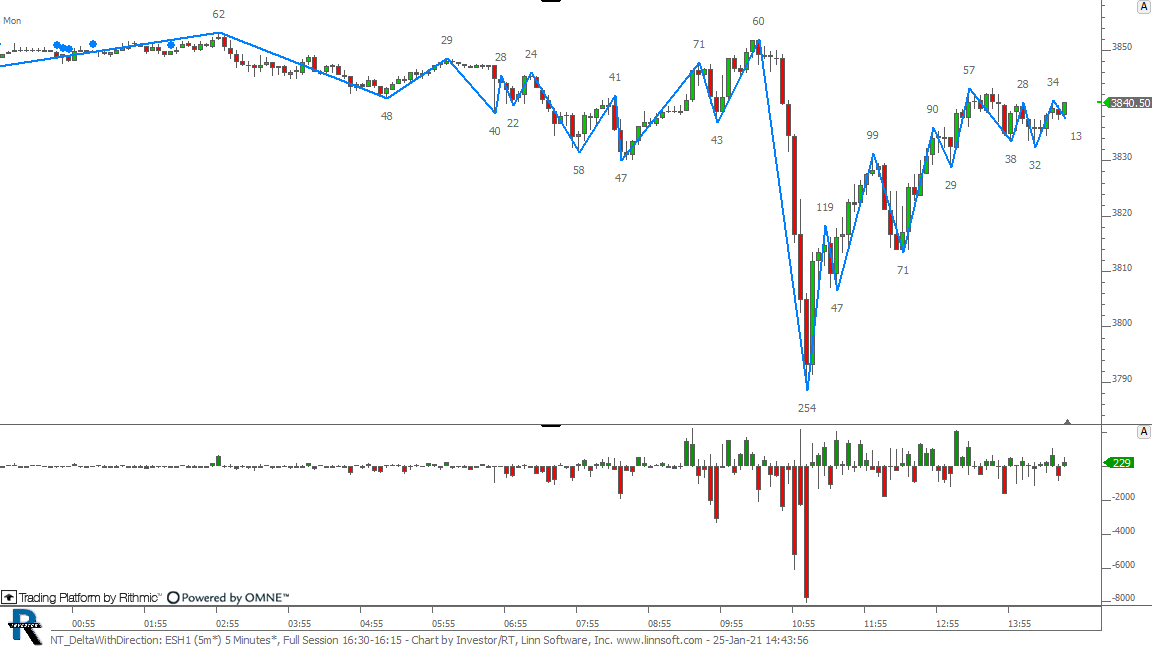 |
NT DeltaWithDirection (ESH1) cpayne [totalcount]
4 years 2 months ago
This chart was uploaded by Investor/RT 14.2.6 showing symbol: ESH1. |
View |
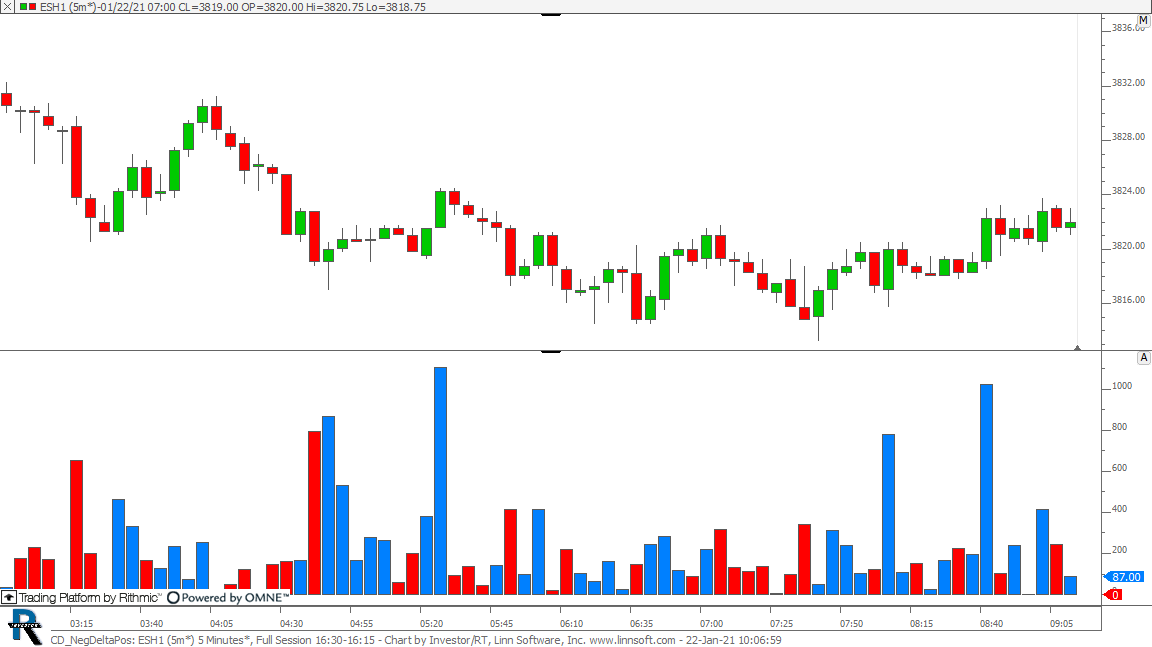 |
CD NegDeltaPos (ESH1) cpayne [totalcount]
4 years 2 months ago
This chart was uploaded by Investor/RT 14.2.6 showing symbol: ESH1. |
View |
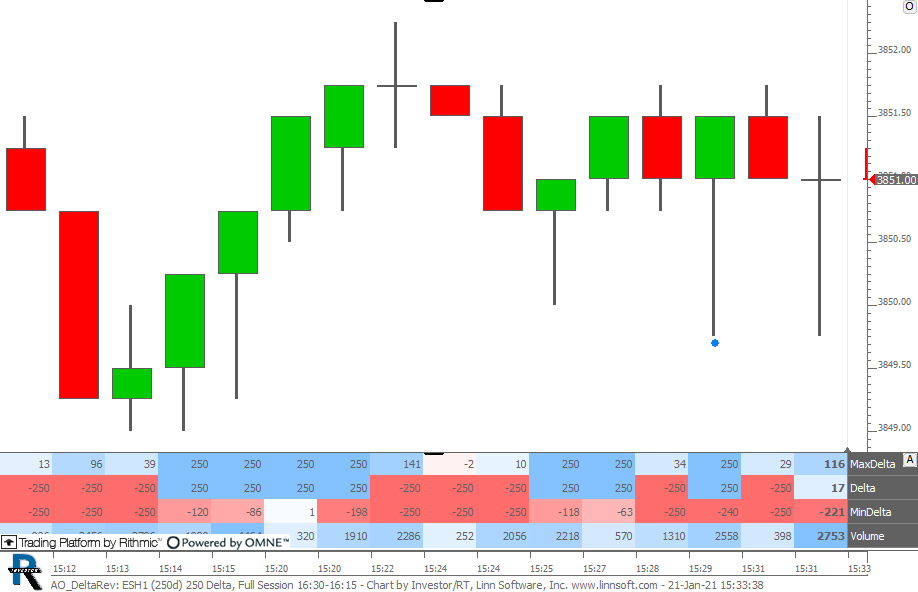 |
AO DeltaRev (ESH1) cpayne [totalcount]
4 years 3 months ago
This chart was uploaded by Investor/RT 14.2.6 showing symbol: ESH1. |
View |
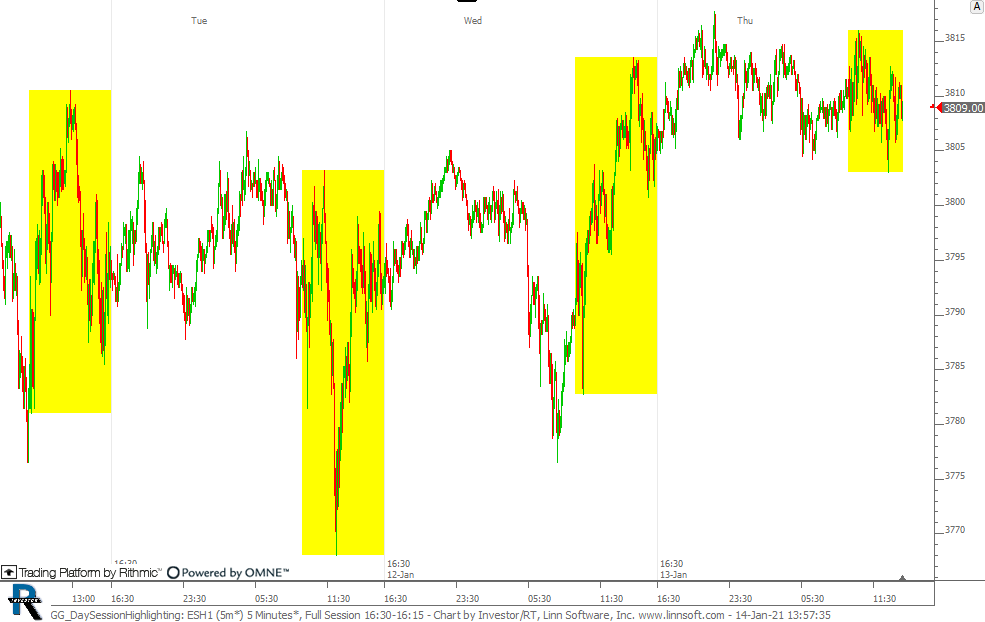 |
GG DaySessionHighlighting (ESH1) cpayne [totalcount]
4 years 3 months ago
Chart highlights the day session range in yellow. This chart was uploaded by Investor/RT 14.2.6 showing symbol: ESH1. |
View |