 |
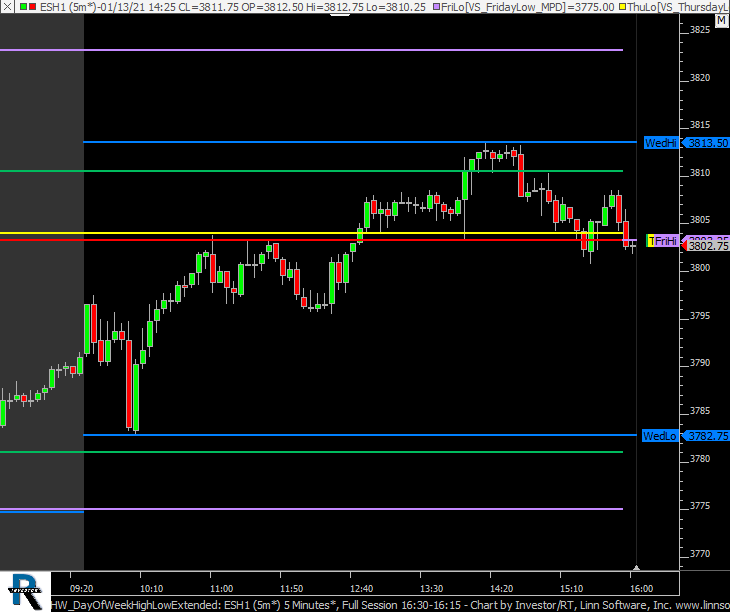
HW DayOfWeekHighLowExtended (ESH1) cpayne [totalcount]
4 years 3 months ago
The day session high and low of each day of the week is extended through the week until it resets on same day of week on following week. |
View |
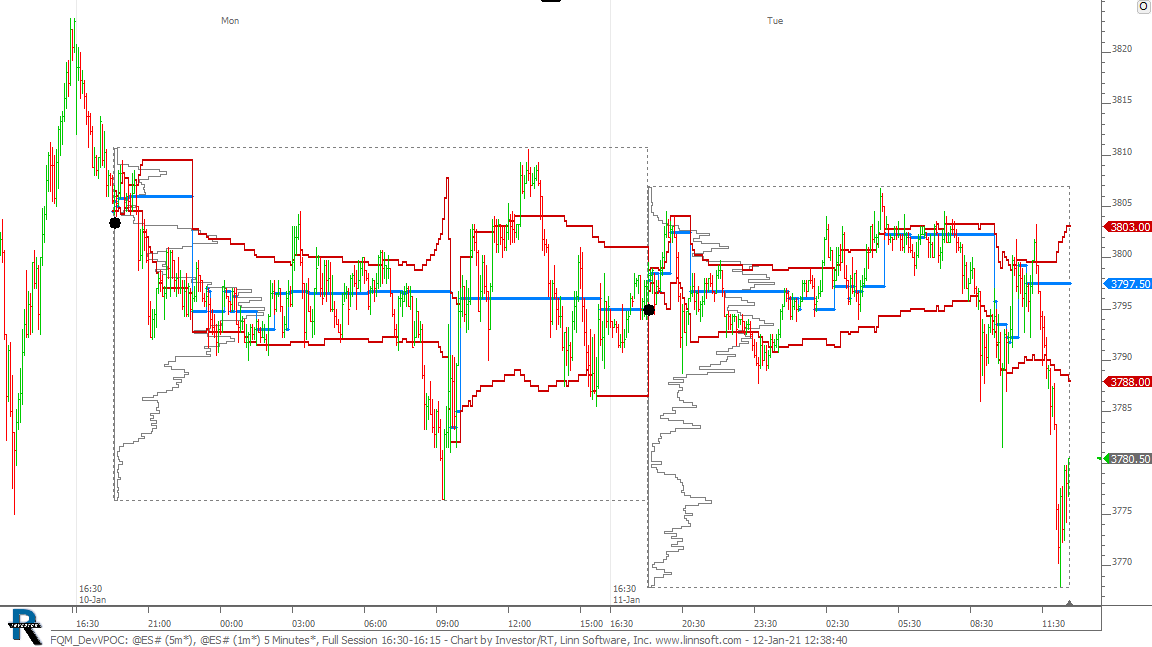 |
FQM DevVPOC (@ES#) cpayne [totalcount]
4 years 3 months ago
This chart was uploaded by Investor/RT 14.2.6 showing symbol: @ES#. |
View |
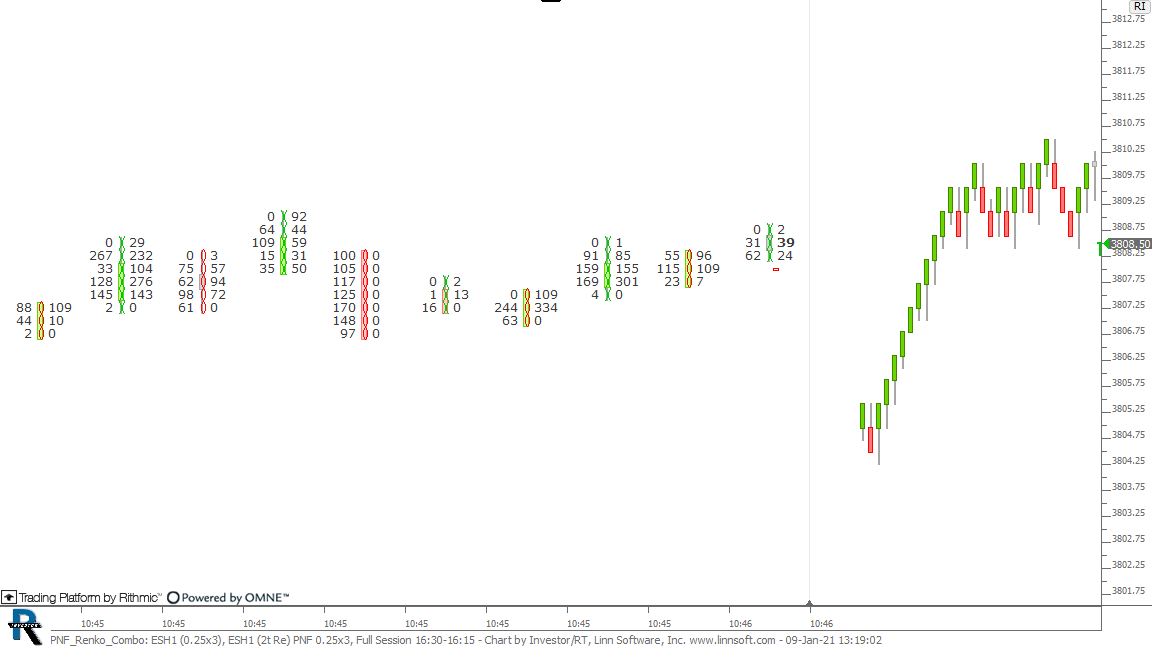 |
PNF Renko Combo (ESH1) cpayne [totalcount]
4 years 3 months ago
This chart was uploaded by Investor/RT 14.2.6 showing symbol: ESH1. |
View |
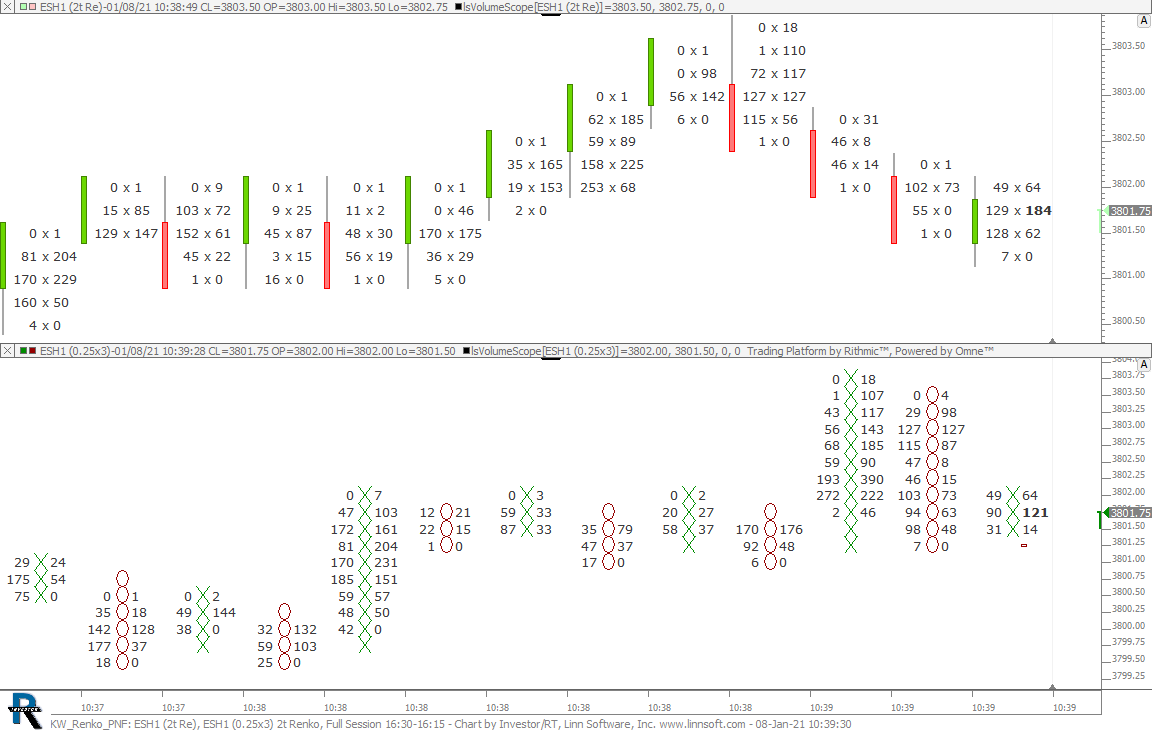 |
KW Renko PNF (ESH1) cpayne [totalcount]
4 years 3 months ago
Renko mixed with PNF. This chart was uploaded by Investor/RT 14.2.6 showing symbol: ESH1. |
View |
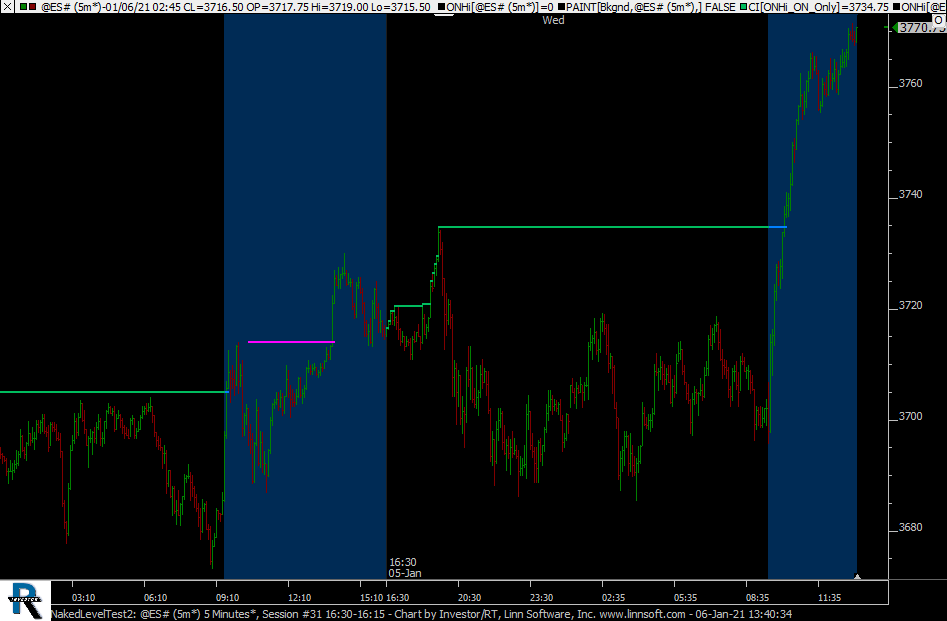 |
NakedLevelTest2 (@ES#) cpayne [totalcount]
4 years 3 months ago
This chart was uploaded by Investor/RT 14.2.6 showing symbol: @ES#. |
View |
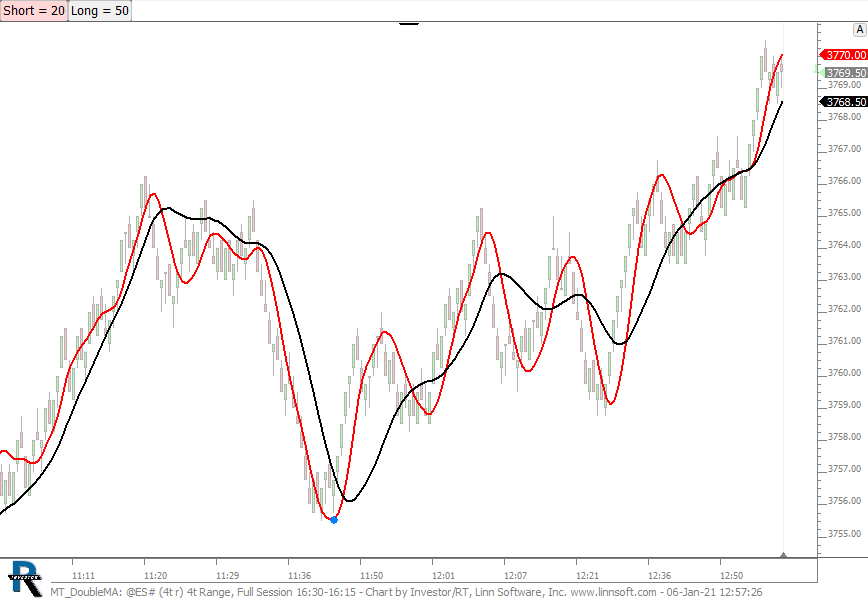 |
MT DoubleMA (@ES#) cpayne [totalcount]
4 years 3 months ago
This chart was uploaded by Investor/RT 14.2.6 showing symbol: @ES#. |
View |
|
|
ClearChart (@ES#) cpayne [totalcount]
4 years 3 months ago
This chart was uploaded by Investor/RT 14.2.6 showing symbol: @ES#. |
View |
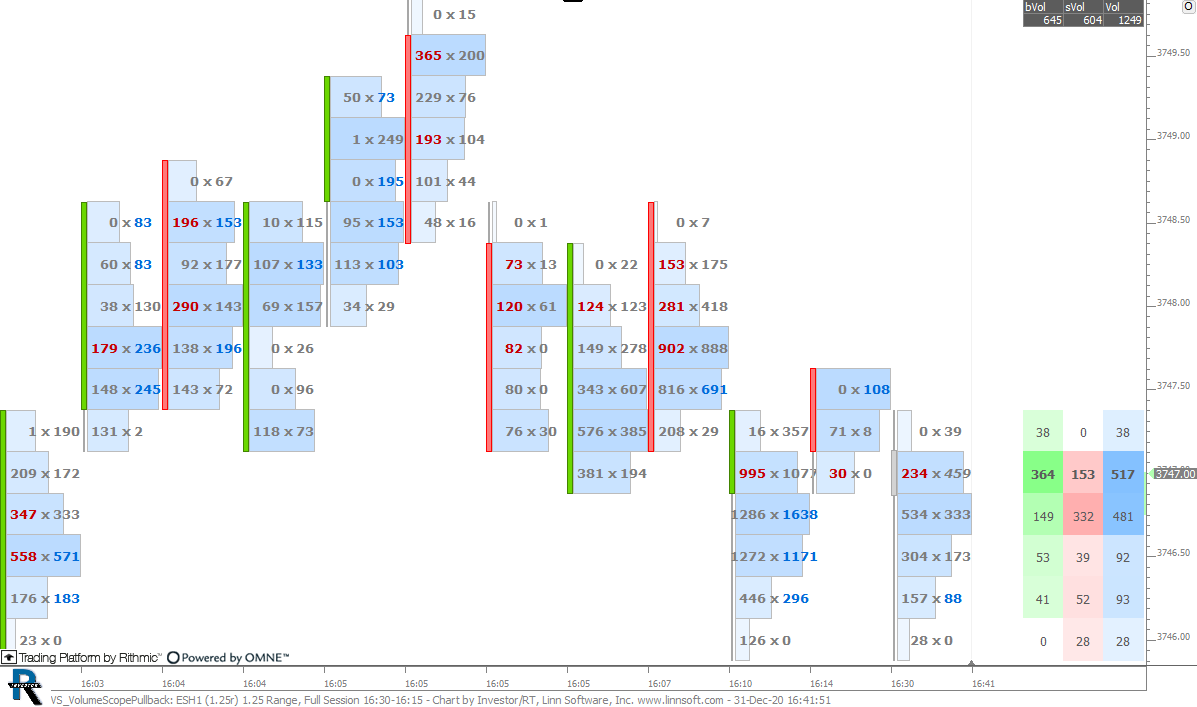 |
VS VolumeScopePullback (ESH1) cpayne [totalcount]
4 years 3 months ago
This chart was uploaded by Investor/RT 14.2.5 showing symbol: ESH1. |
View |
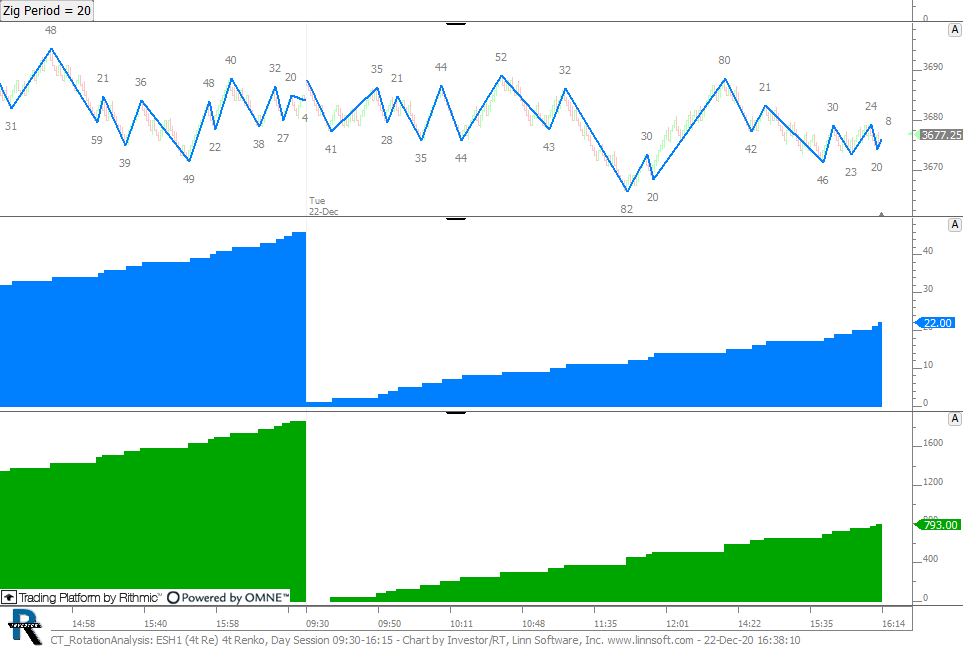 |
CT RotationAnalysis (ESH1) cpayne [totalcount]
4 years 4 months ago
This chart was uploaded by Investor/RT 14.2.5 showing symbol: ESH1. |
View |
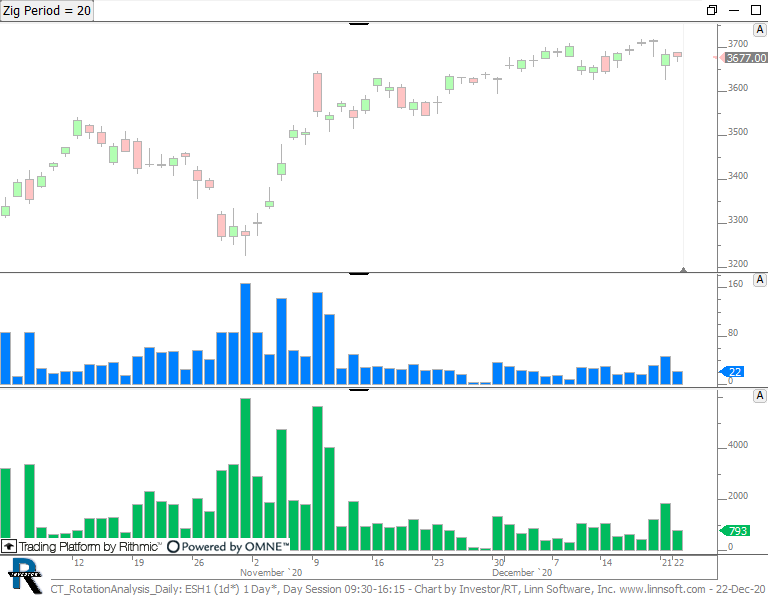 |
CT RotationAnalysis Daily (ESH1) cpayne [totalcount]
4 years 4 months ago
This chart was uploaded by Investor/RT 14.2.5 showing symbol: ESH1. |
View |
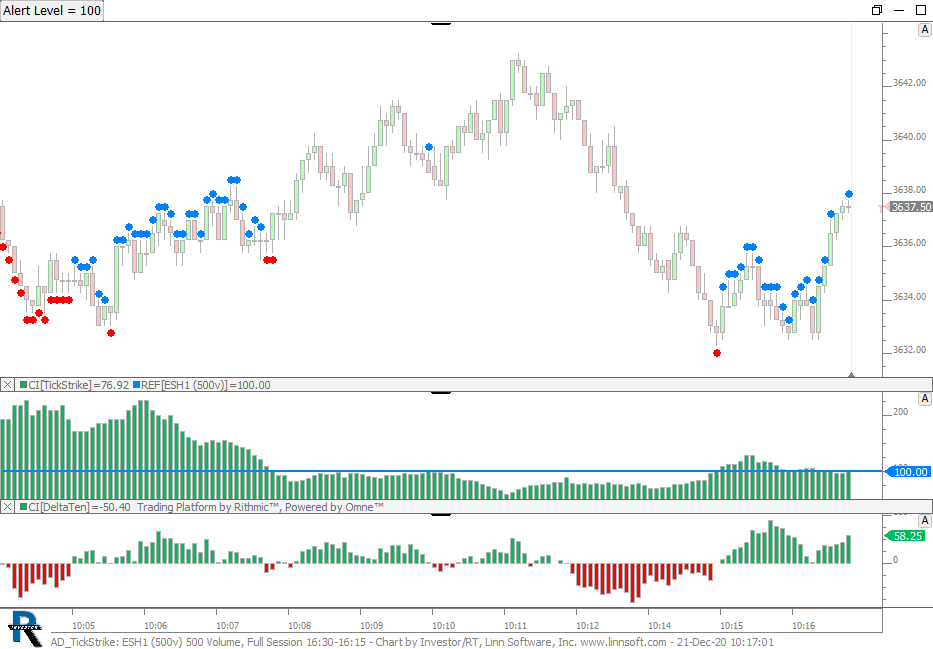 |
AD TickStrike (ESH1) cpayne [totalcount]
4 years 4 months ago
This chart was uploaded by Investor/RT 14.2.5 showing symbol: ESH1. |
View |
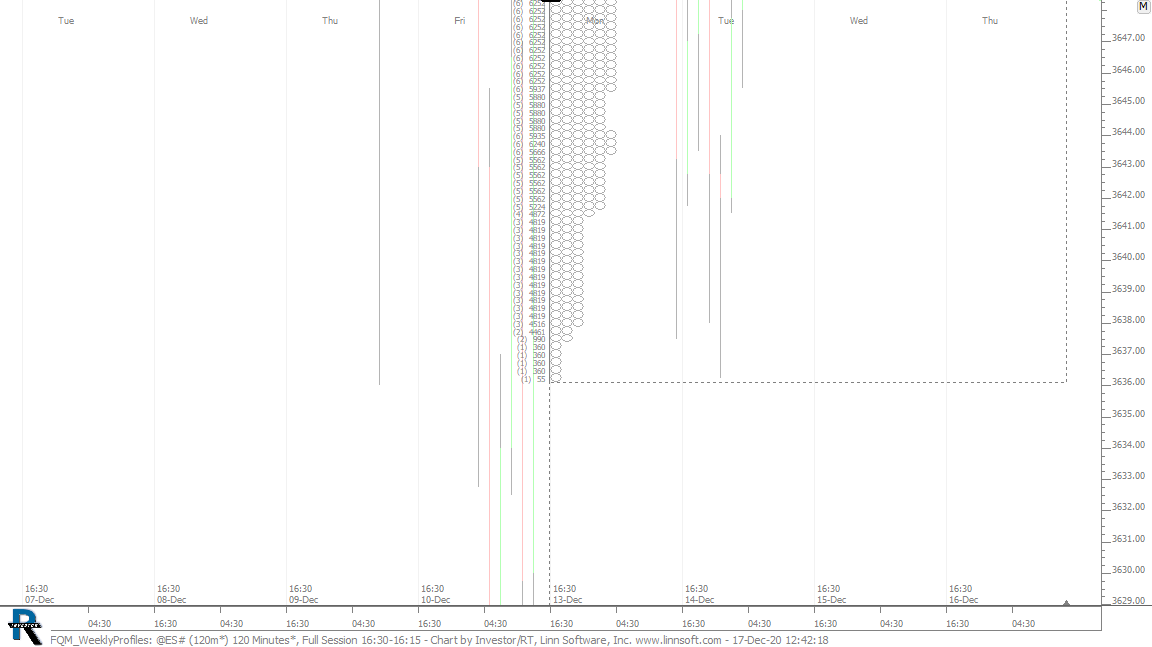 |
FQM WeeklyProfiles (@ES#) cpayne [totalcount]
4 years 4 months ago
Weekly Profiles - 120 Minute TPOs. This chart was uploaded by Investor/RT 14.2.5 showing symbol: @ES#. |
View |
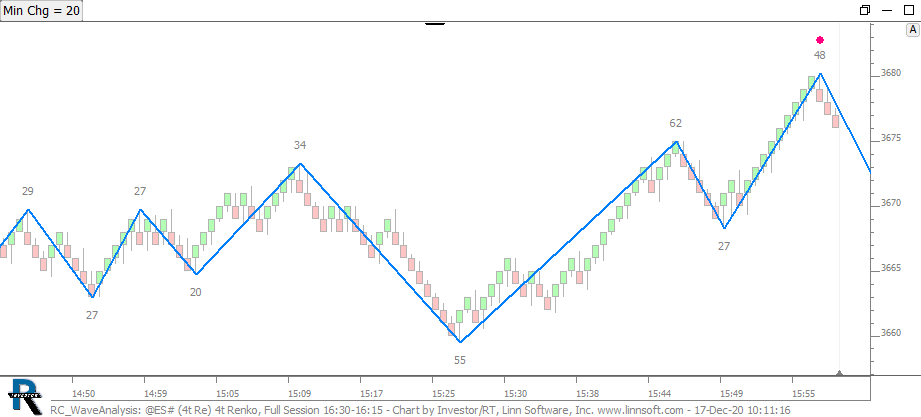 |
RC WaveAnalysis (@ES#) cpayne [totalcount]
4 years 4 months ago
Wave Study. This chart was uploaded by Investor/RT 14.2.5 showing symbol: @ES#. |
View |
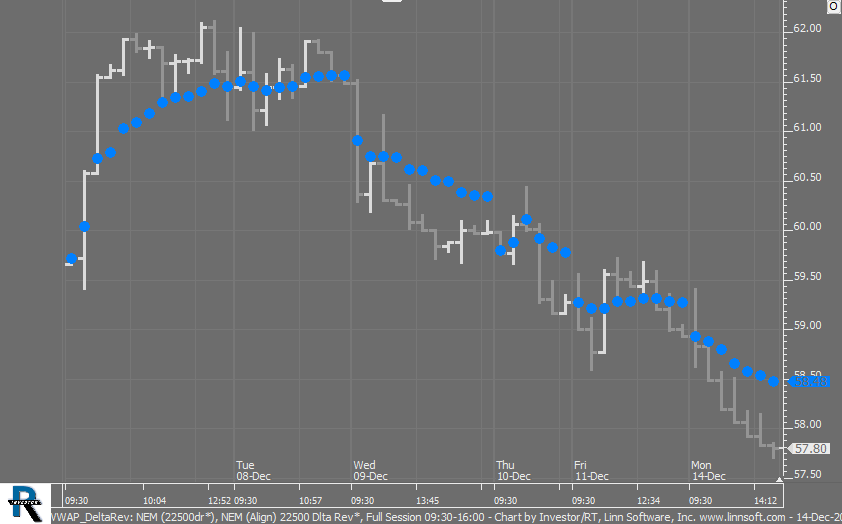 |
VWAP DeltaRev (NEM) cpayne [totalcount]
4 years 4 months ago
This chart was uploaded by Investor/RT 14.2.5 showing symbol: NEM. |
View |
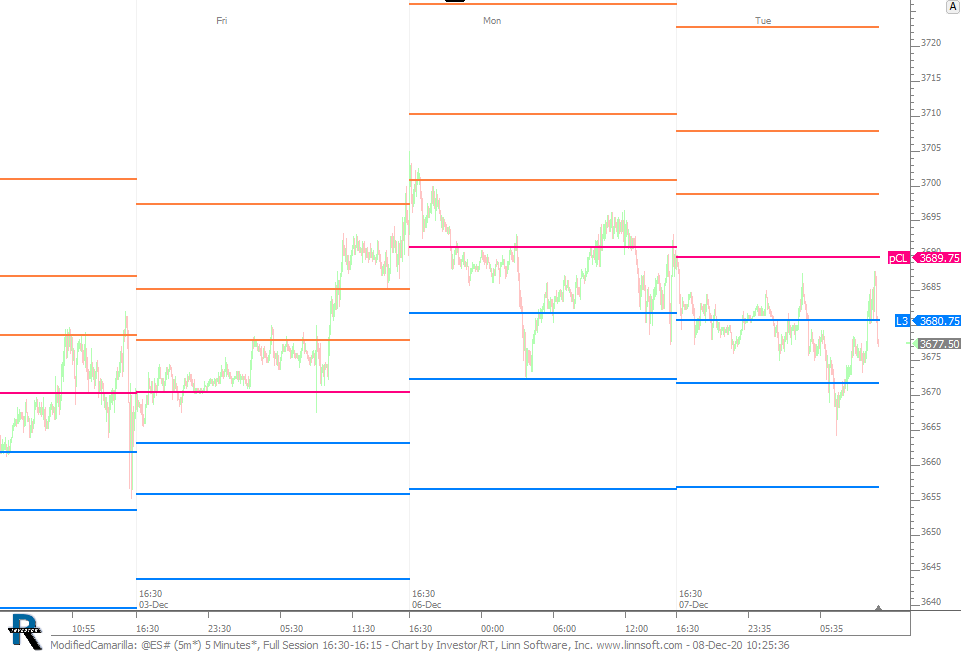 |
ModifiedCamarilla (@ES#) cpayne [totalcount]
4 years 4 months ago
Modified Camarilla. This chart was uploaded by Investor/RT 14.2.5 showing symbol: @ES#. |
View |
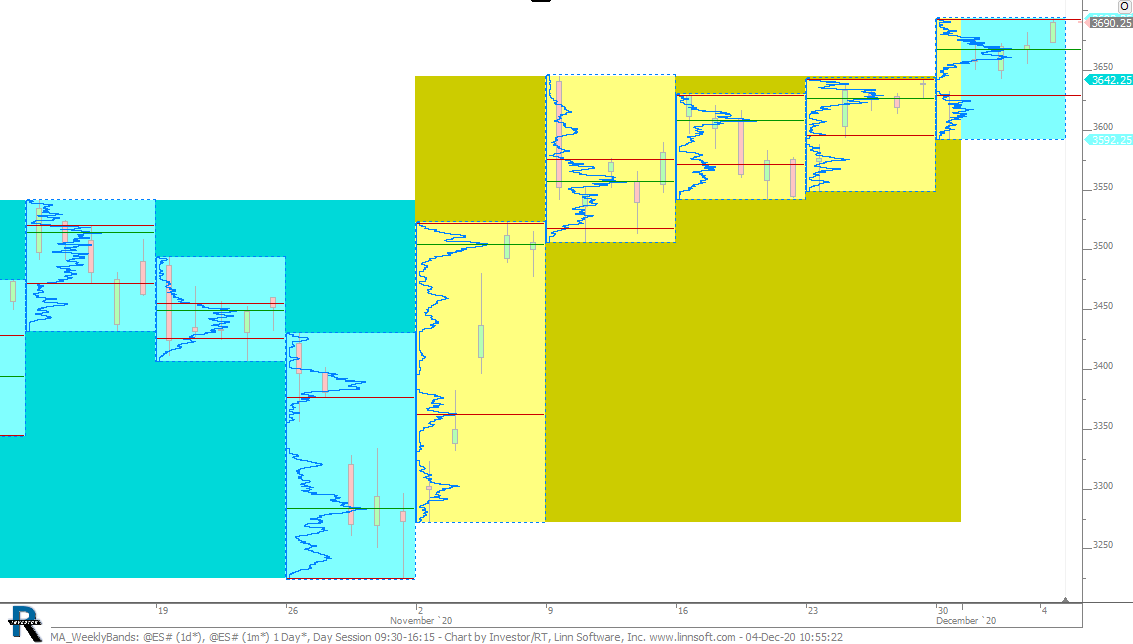 |
MA WeeklyBands (@ES#) cpayne [totalcount]
4 years 4 months ago
Weekly Profiles with Alternating Months Highlighted. This chart was uploaded by Investor/RT 14.2.5 showing symbol: @ES#. |
View |
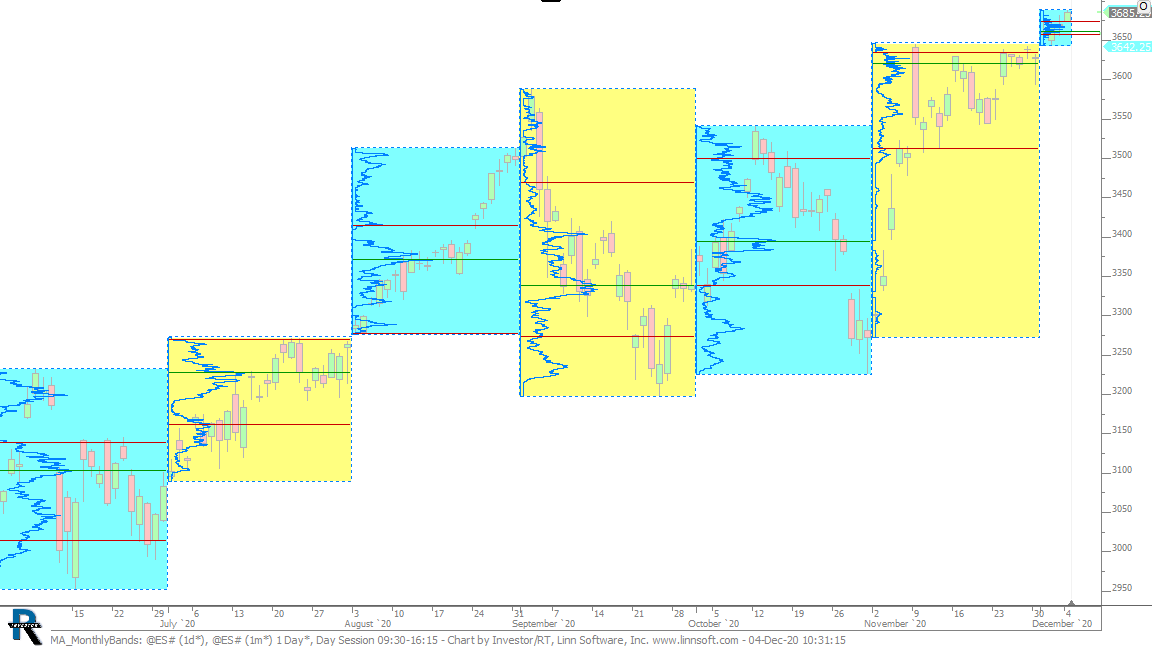 |
MA MonthlyBands (@ES#) cpayne [totalcount]
4 years 4 months ago
Alternating Months Highlighted and Profiled. This chart was uploaded by Investor/RT 14.2.5 showing symbol: @ES#. |
View |
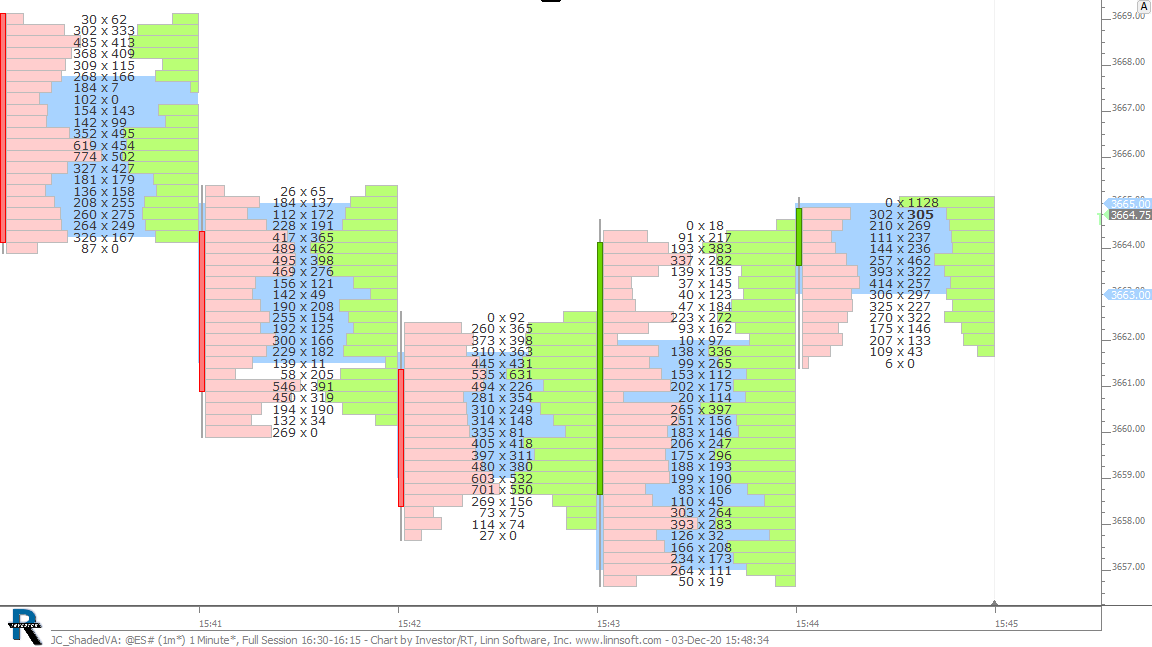 |
JC ShadedVA (@ES#) cpayne [totalcount]
4 years 4 months ago
This chart was uploaded by Investor/RT 14.2.5 showing symbol: @ES#. |
View |
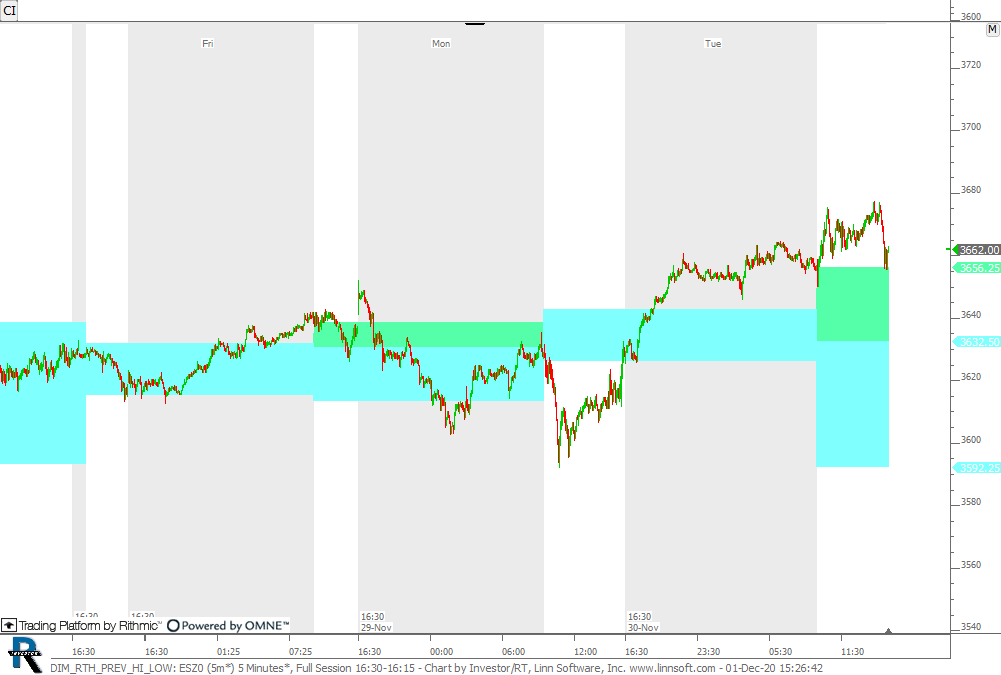 |
DIM RTH PREV HI LOW (ESZ0) cpayne [totalcount]
4 years 4 months ago
This chart was uploaded by Investor/RT 14.2.5 showing symbol: ESZ0. |
View |
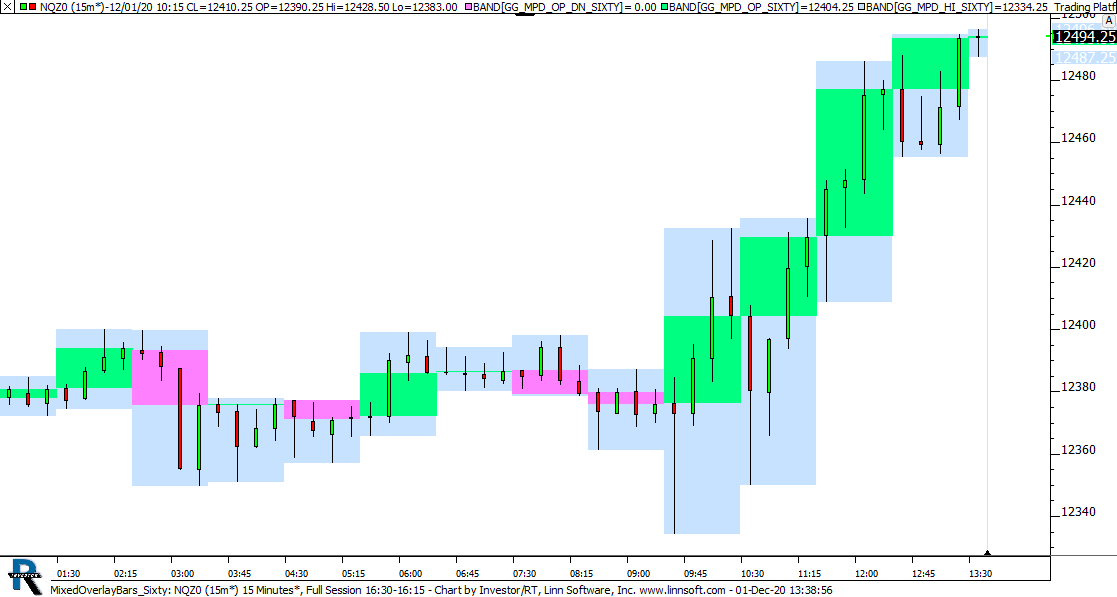 |
MixedOverlayBars Sixty (NQZ0) cpayne [totalcount]
4 years 4 months ago
This chart was uploaded by Investor/RT 14.2.5 showing symbol: NQZ0. |
View |
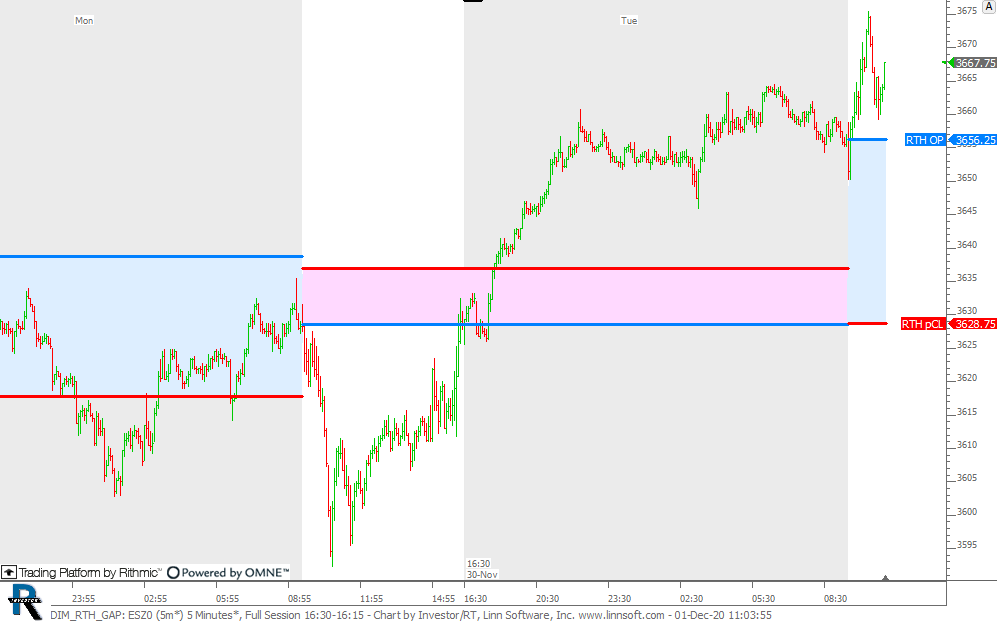 |
DIM RTH GAP (ESZ0) cpayne [totalcount]
4 years 4 months ago
RTH Gap on Full Session Chart. Blue on Gap Up and Pink on Gap Down. This chart was uploaded by Investor/RT 14.2.5 showing symbol: ESZ0. |
View |
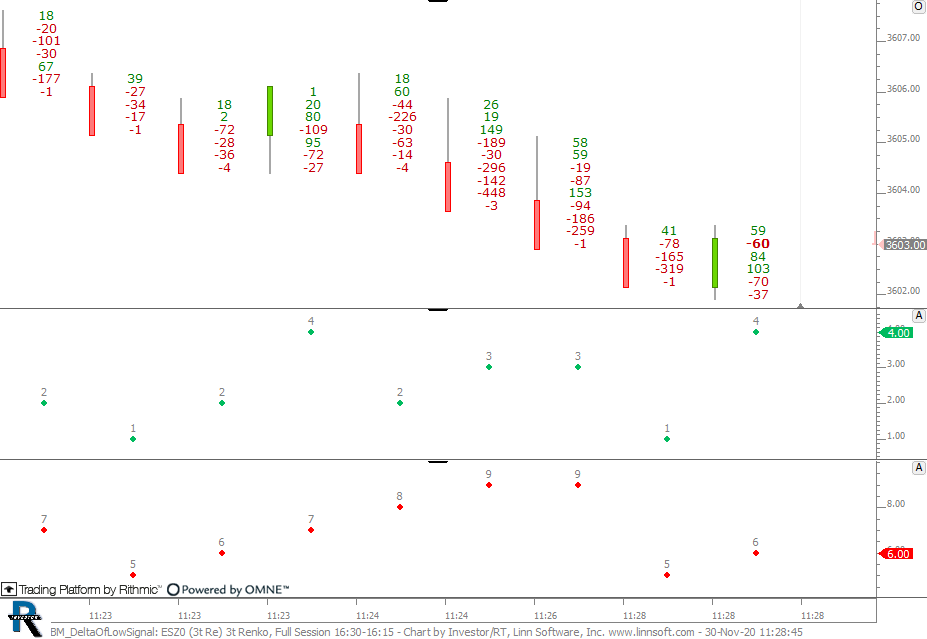 |
BM DeltaOfLowSignal (ESZ0) cpayne [totalcount]
4 years 4 months ago
This chart was uploaded by Investor/RT 14.2.5 showing symbol: ESZ0. |
View |
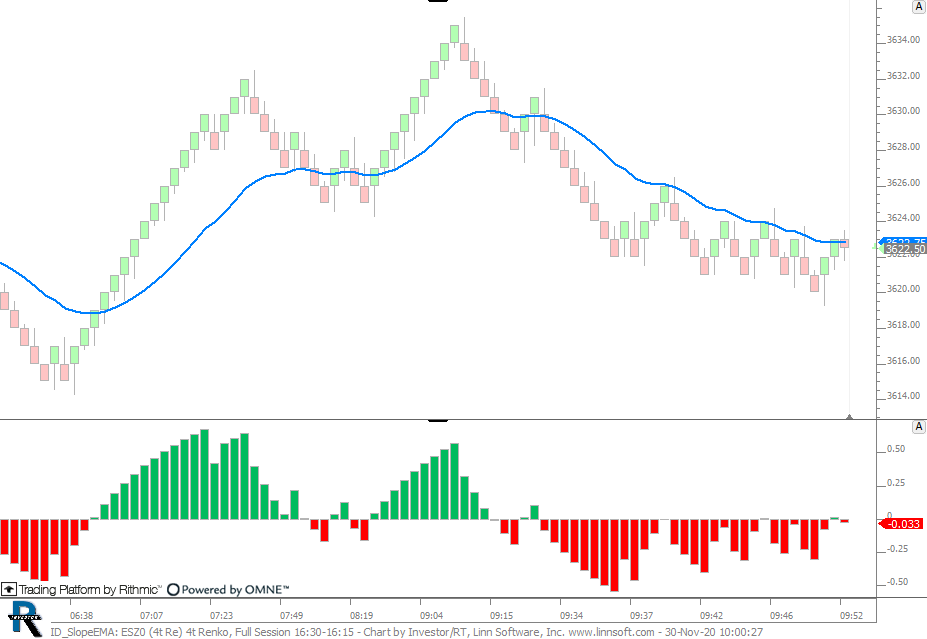 |
ID SlopeEMA (ESZ0) cpayne [totalcount]
4 years 4 months ago
This chart was uploaded by Investor/RT 14.2.5 showing symbol: ESZ0. |
View |
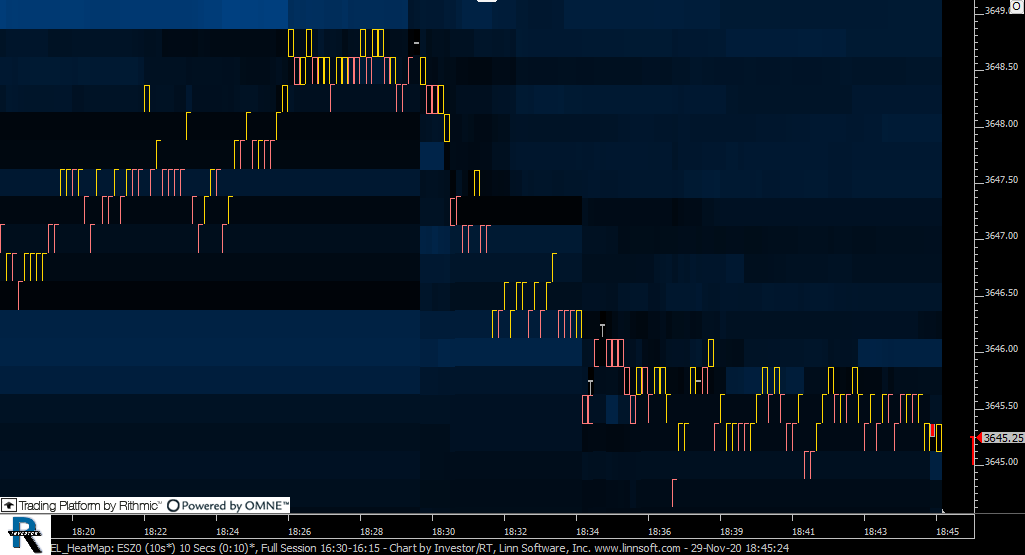 |
EL HeatMap (ESZ0) cpayne [totalcount]
4 years 4 months ago
This chart was uploaded by Investor/RT 14.2.5 showing symbol: ESZ0. |
View |
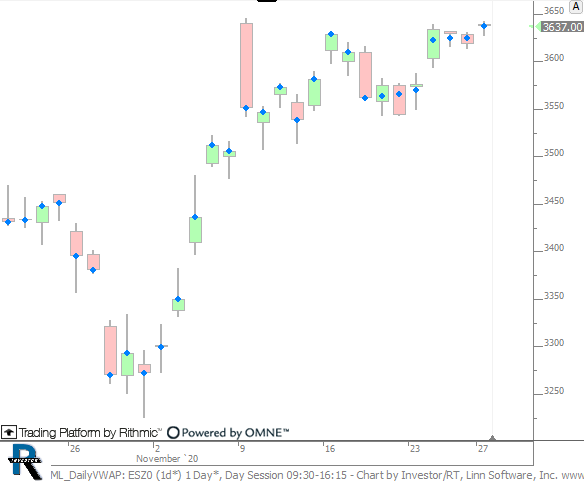 |
ML DailyVWAP (ESZ0) cpayne [totalcount]
4 years 4 months ago
This chart was uploaded by Investor/RT 14.2.5 showing symbol: ESZ0. |
View |