 |
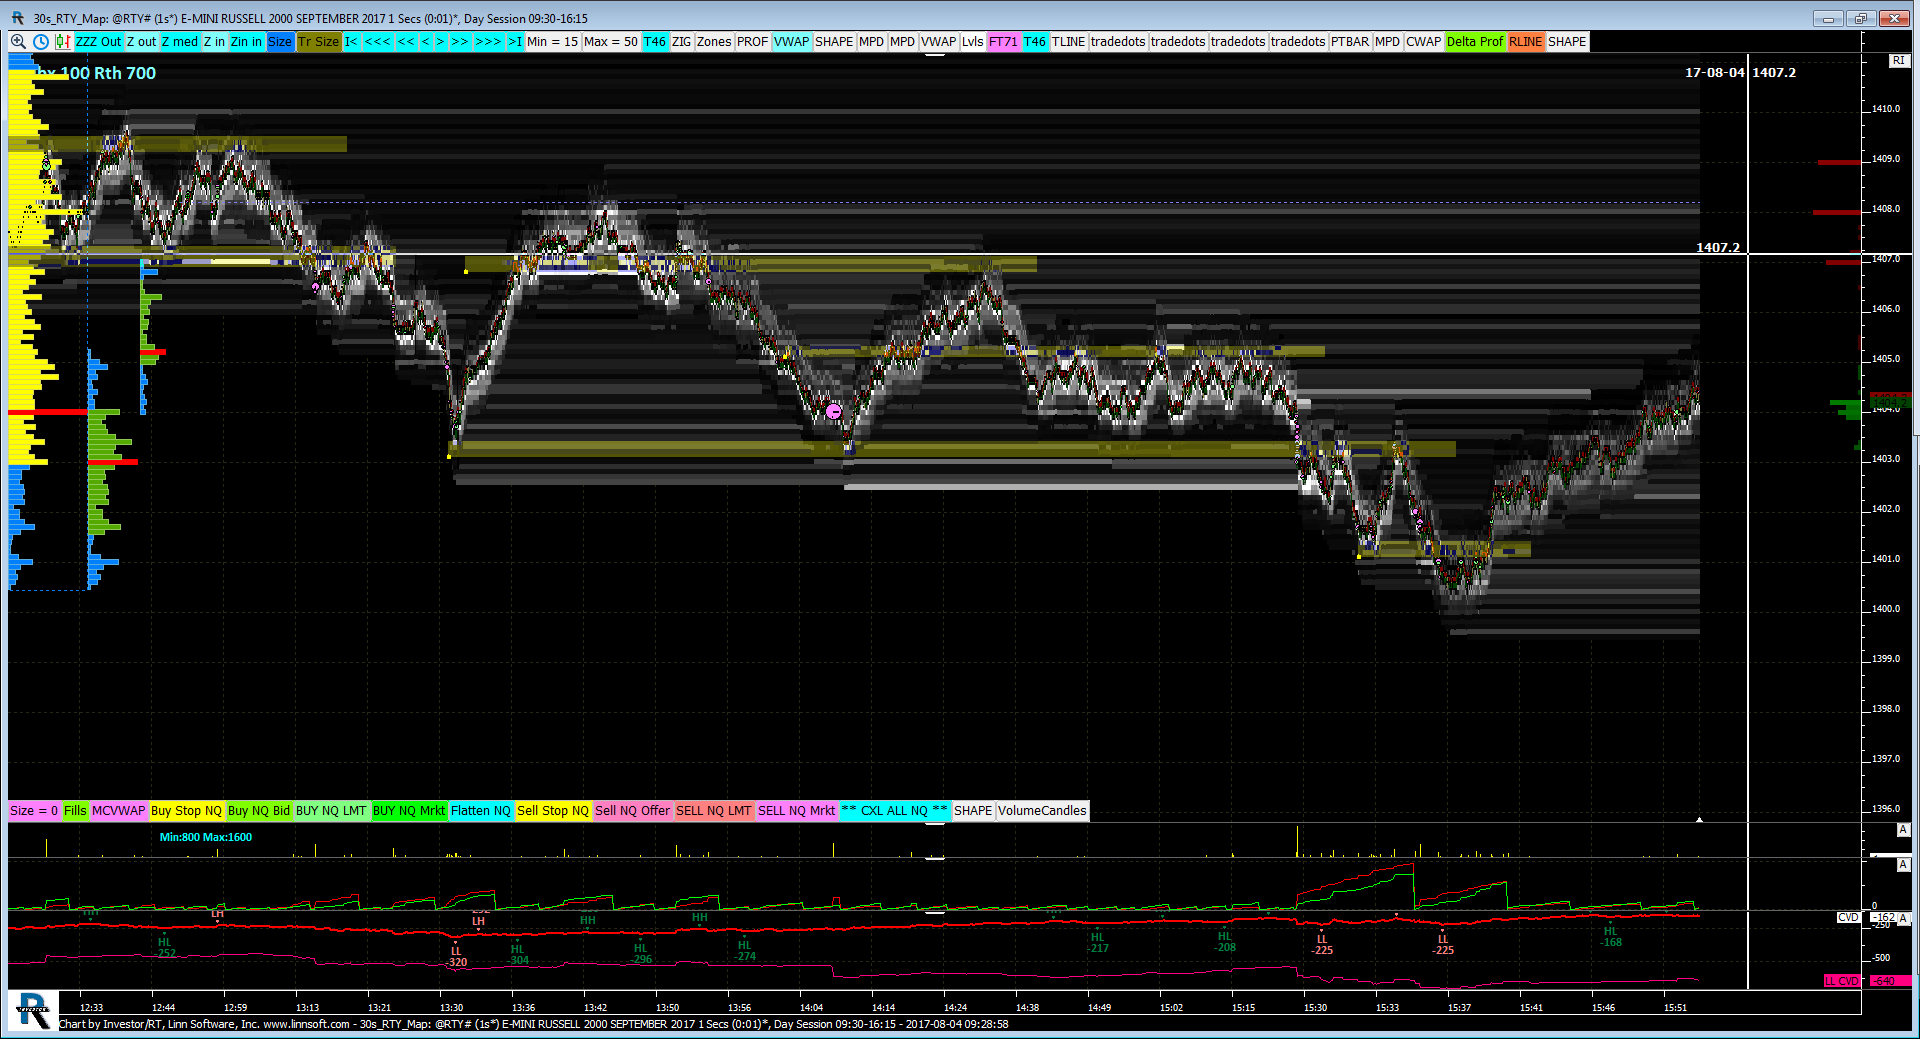
30s RTY Map (@RTY#) jayski51369 [totalcount]
7 years 8 months ago
This chart was uploaded by Investor/RT 12.7.6 showing symbol: @RTY#. |
View |
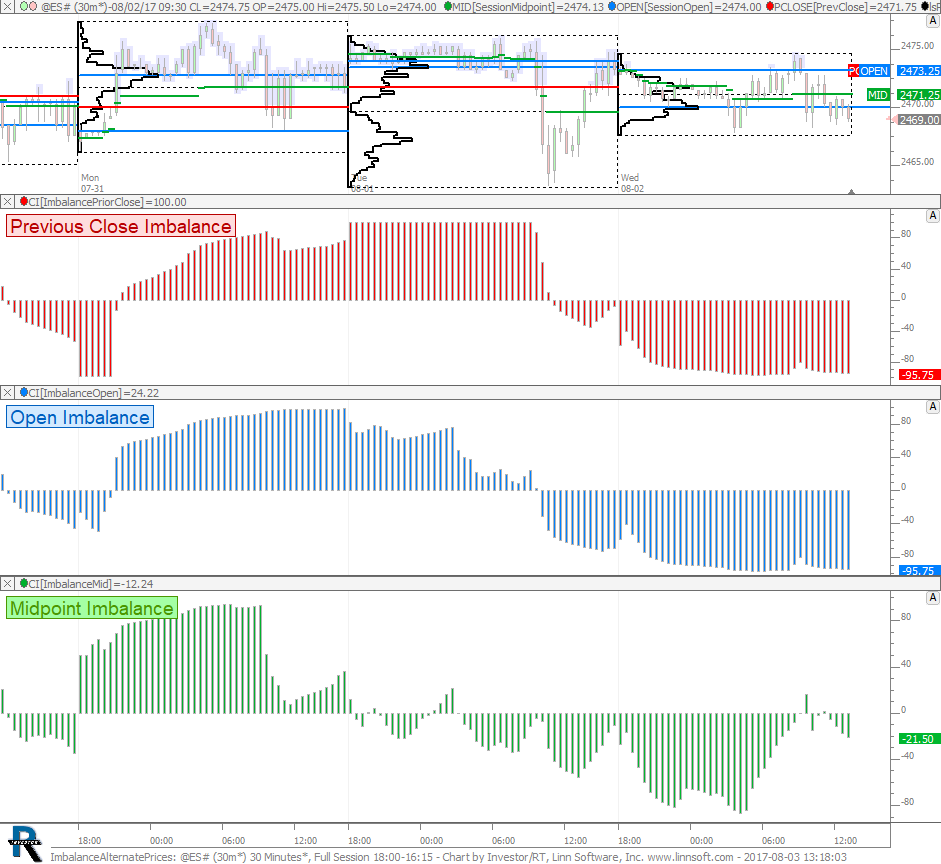 |
ImbalanceAlternatePrices (@ES#) cpayne [totalcount]
7 years 8 months ago
Alternate Price Imbalance. This chart was uploaded by Investor/RT 12.7.7 showing symbol: @ES#. |
View |
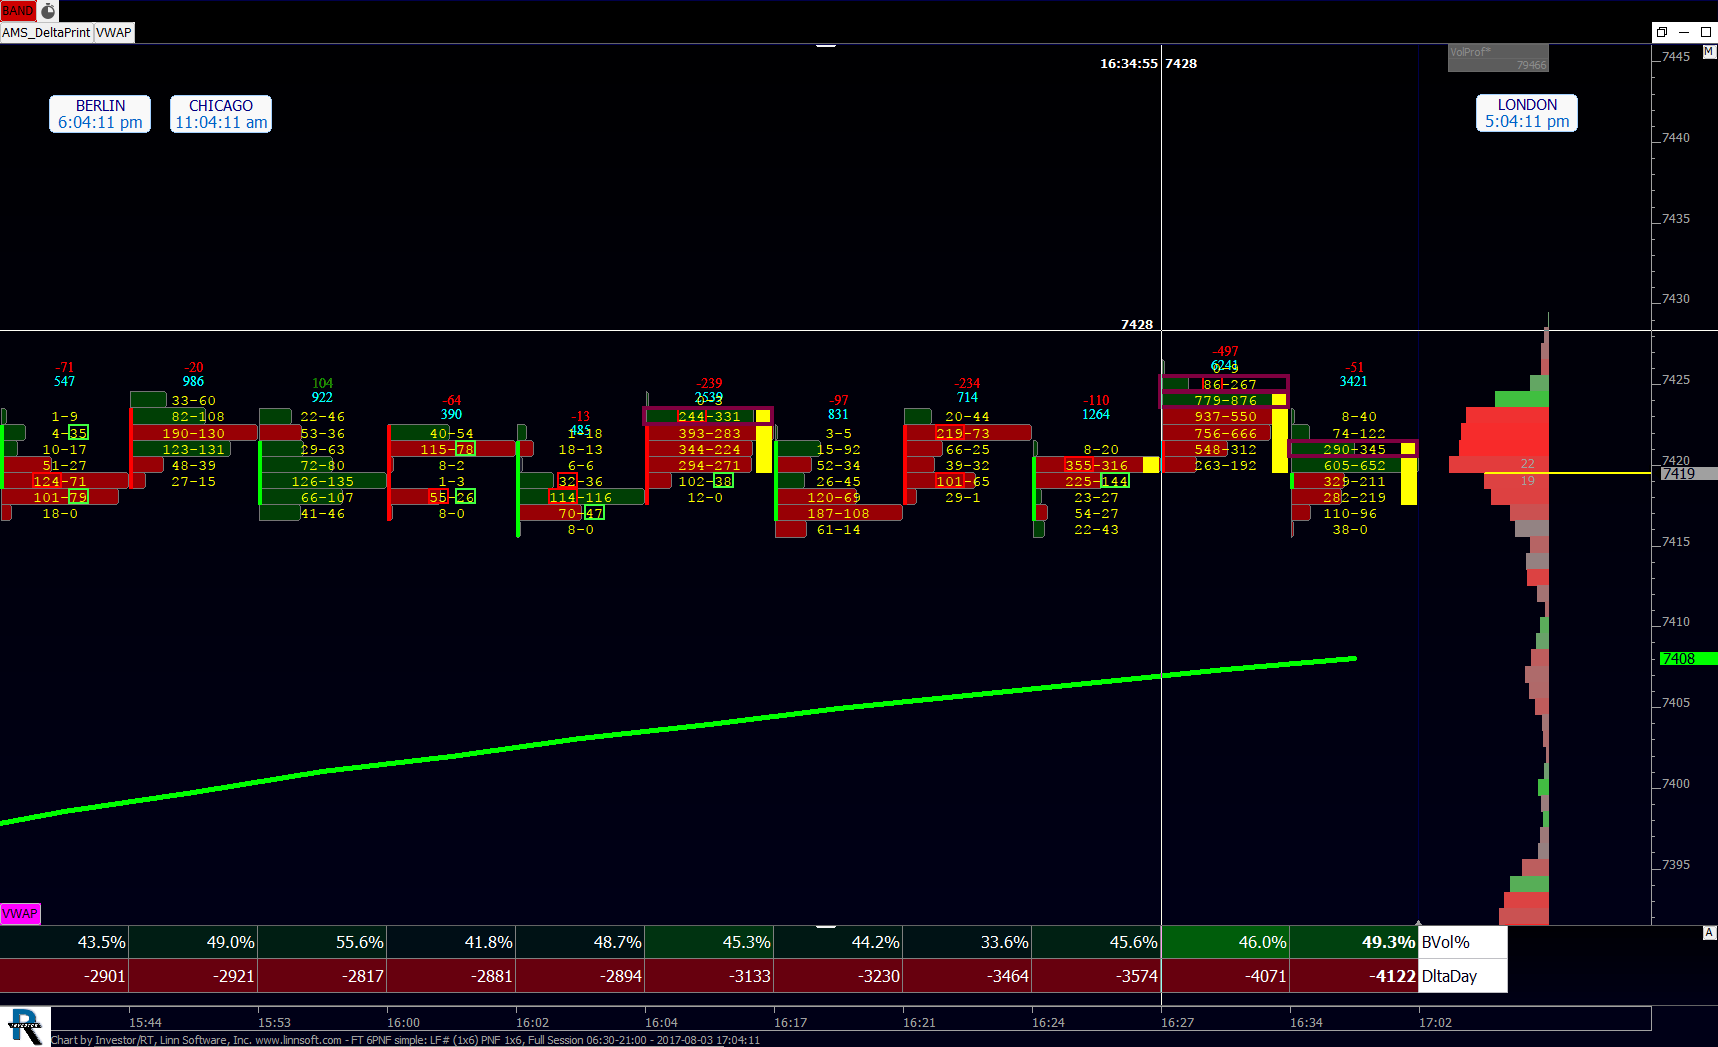 |
FT 6PNF simple (LF#) ken wills [totalcount]
7 years 8 months ago
chart for Shawn from Ken Wills...... pnf problem. This chart was uploaded by Investor/RT 12.7.6 showing symbol: LF#. |
View |
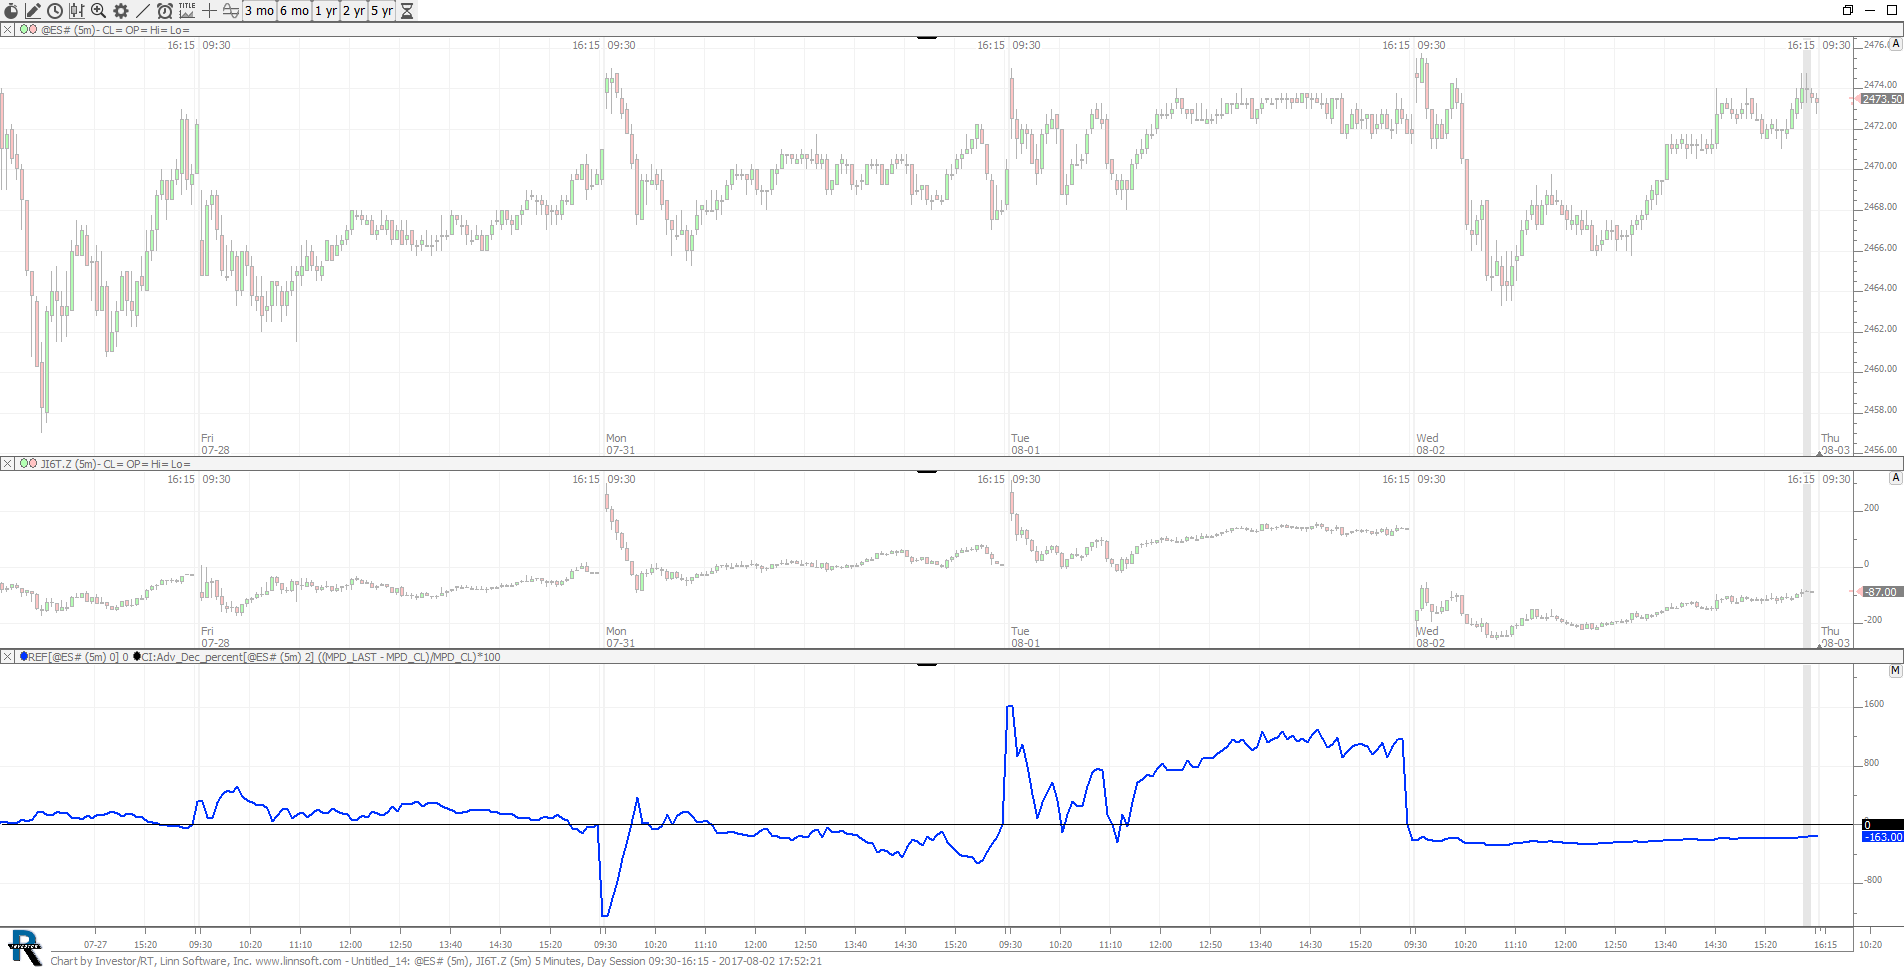 |
Untitled 14 (@ES#) scooke [totalcount]
7 years 8 months ago
This chart was uploaded by Investor/RT 12.6.1 showing symbol: @ES#. |
View |
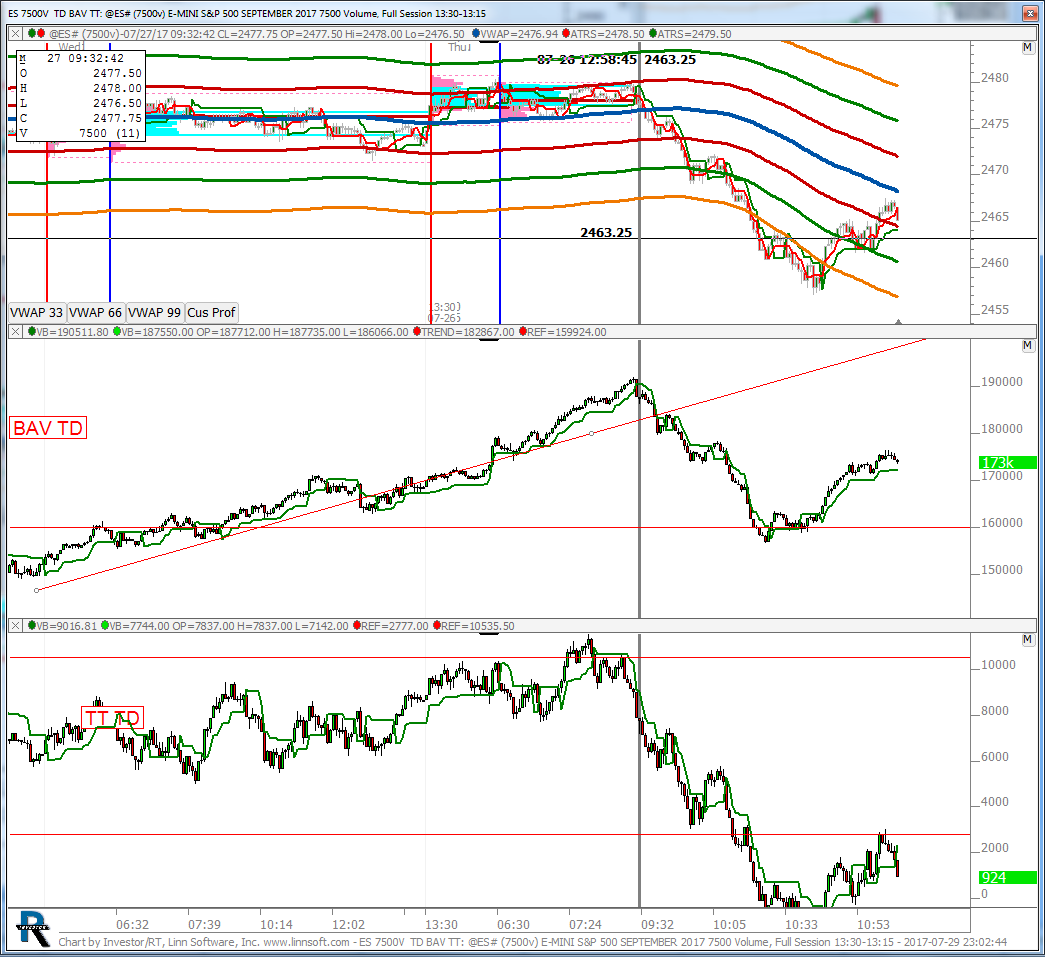 |
ES 7500V TD BAV TT (@ES#) kencassorla [totalcount]
7 years 8 months ago
7500V. This chart was uploaded by Investor/RT 12.7.6 showing symbol: @ES#. |
View |
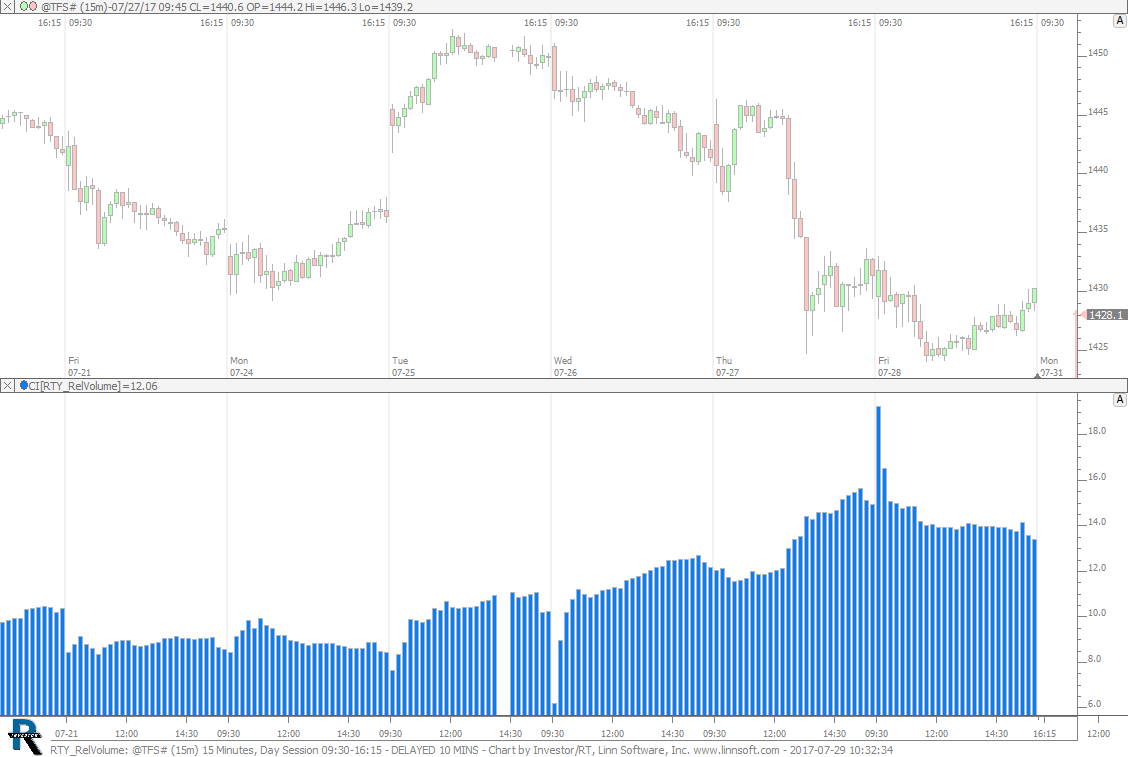 |
RTY RelVolume (@TFS#) cpayne [totalcount]
7 years 8 months ago
Relaive Voulme - 100 * RTY_VOL / (RTY_VOL + TFS_VOL). This chart was uploaded by Investor/RT 12.7.7 showing symbol: @TFS#. |
View |
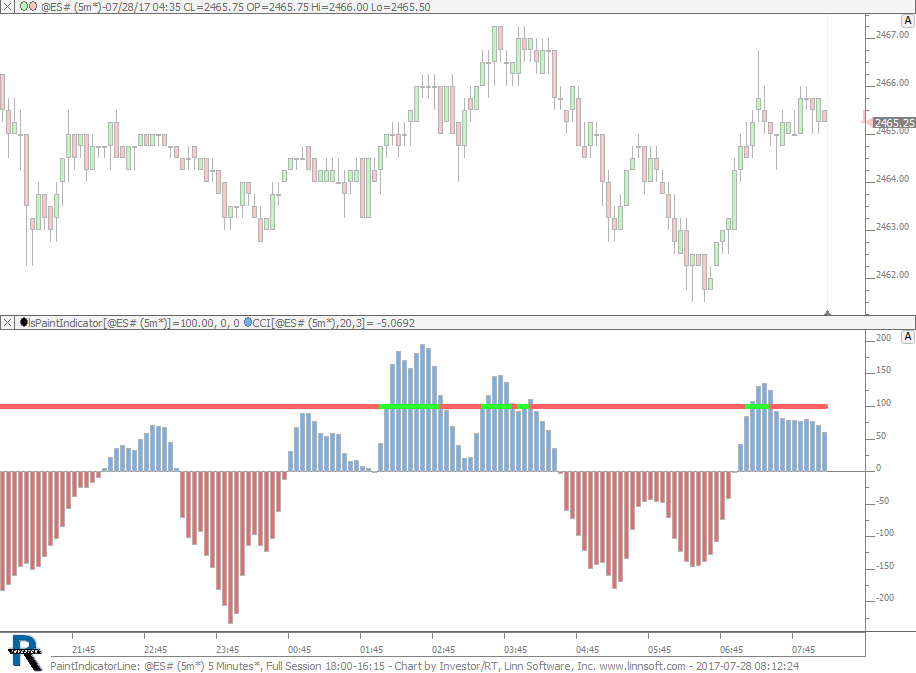 |
PaintIndicatorLine (@ES#) cpayne [totalcount]
7 years 8 months ago
Painted Reference Line. This chart was uploaded by Investor/RT 12.7.7 showing symbol: @ES#. |
View |
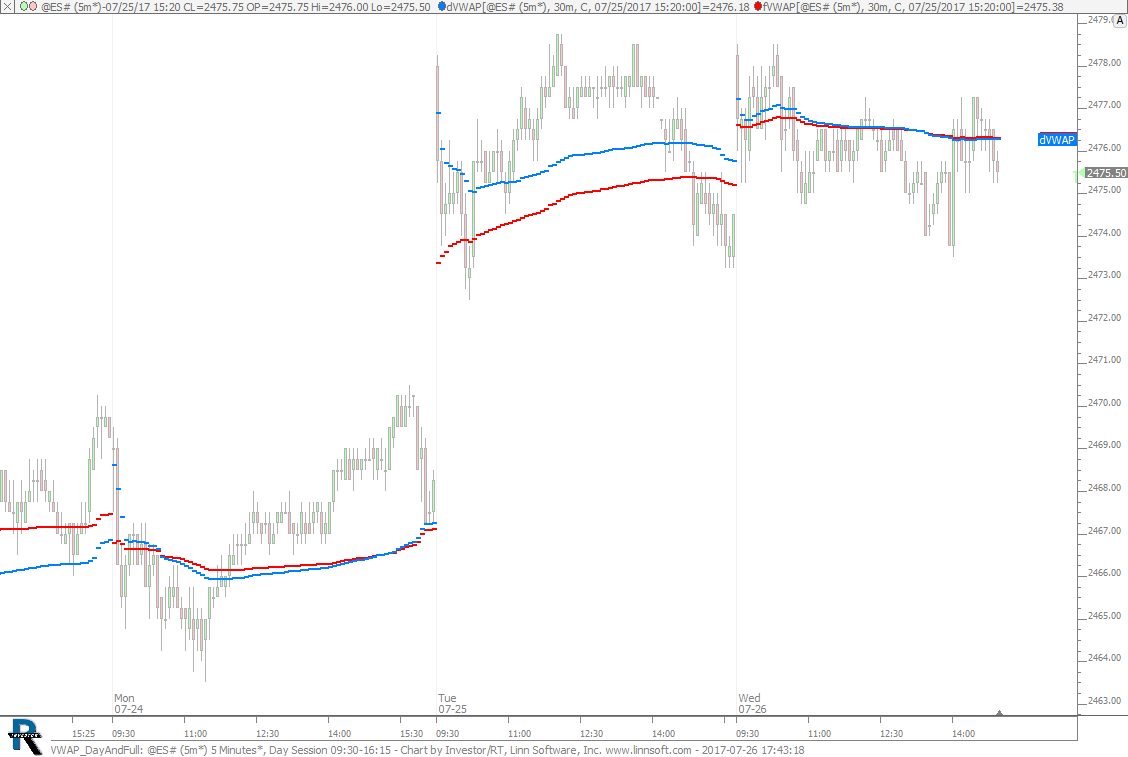 |
VWAP DayAndFull (@ES#) cpayne [totalcount]
7 years 9 months ago
Day (Blue) and Full (Red) Session VWAP. Both are independant of session of chart. This chart was uploaded by Investor/RT 12.7.7 showing symbol: @ES#. |
View |
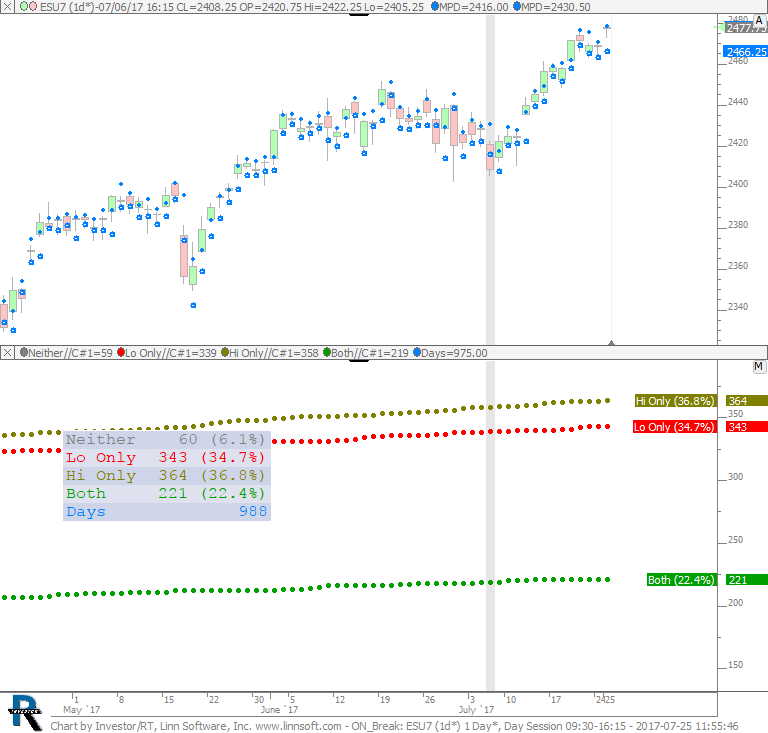 |
ON Break (ESU7) SPetkov [totalcount]
7 years 9 months ago
This chart was uploaded by Investor/RT 12.7.6 showing symbol: ESU7. |
View |
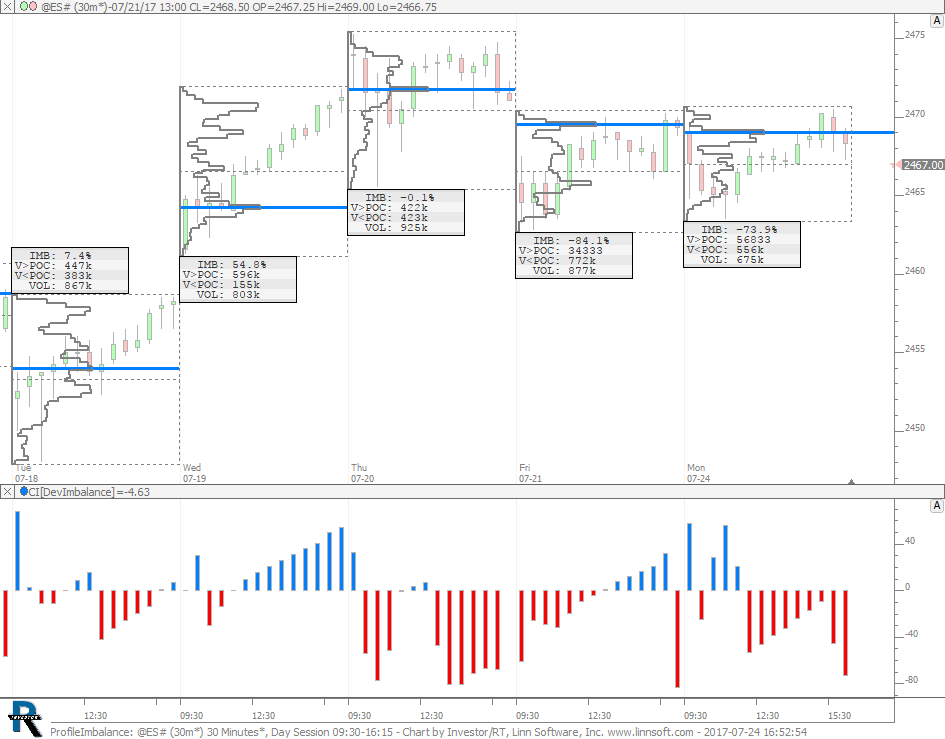 |
ProfileImbalance (@ES#) cpayne [totalcount]
7 years 9 months ago
Profile Imbalance. This chart was uploaded by Investor/RT 12.7.7 showing symbol: @ES#. |
View |
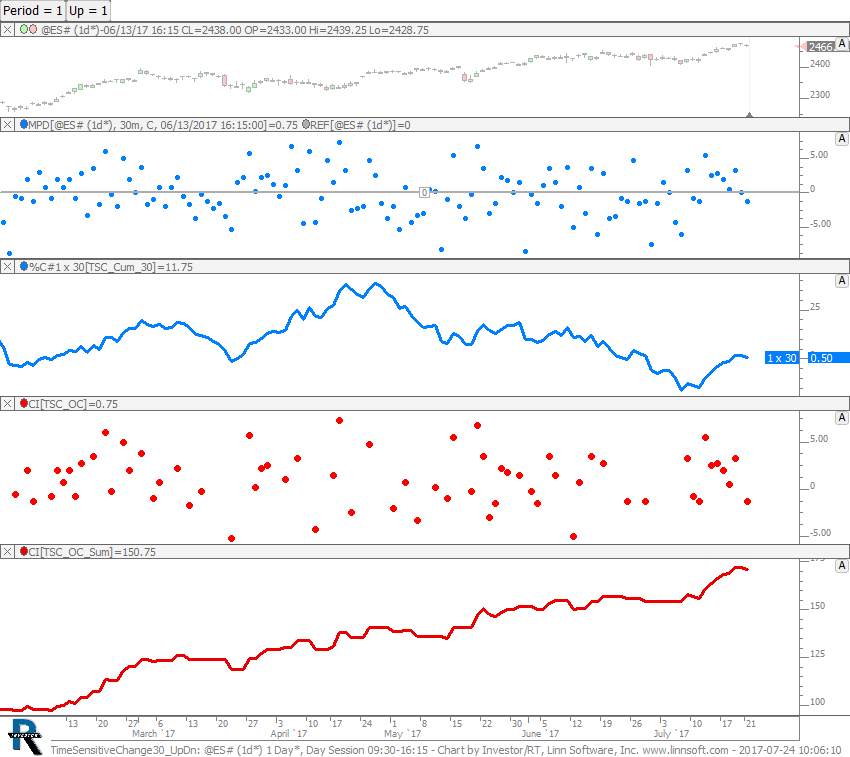 |
TimeSensitiveChange30 UpDn (@ES#) cpayne [totalcount]
7 years 9 months ago
Time Sensitive Change - Up or Down Days (Up = 1 for Up Days and Up = 0 for Down Days). This chart was uploaded by Investor/RT 12.7.7 showing symbol: @ES#. |
View |
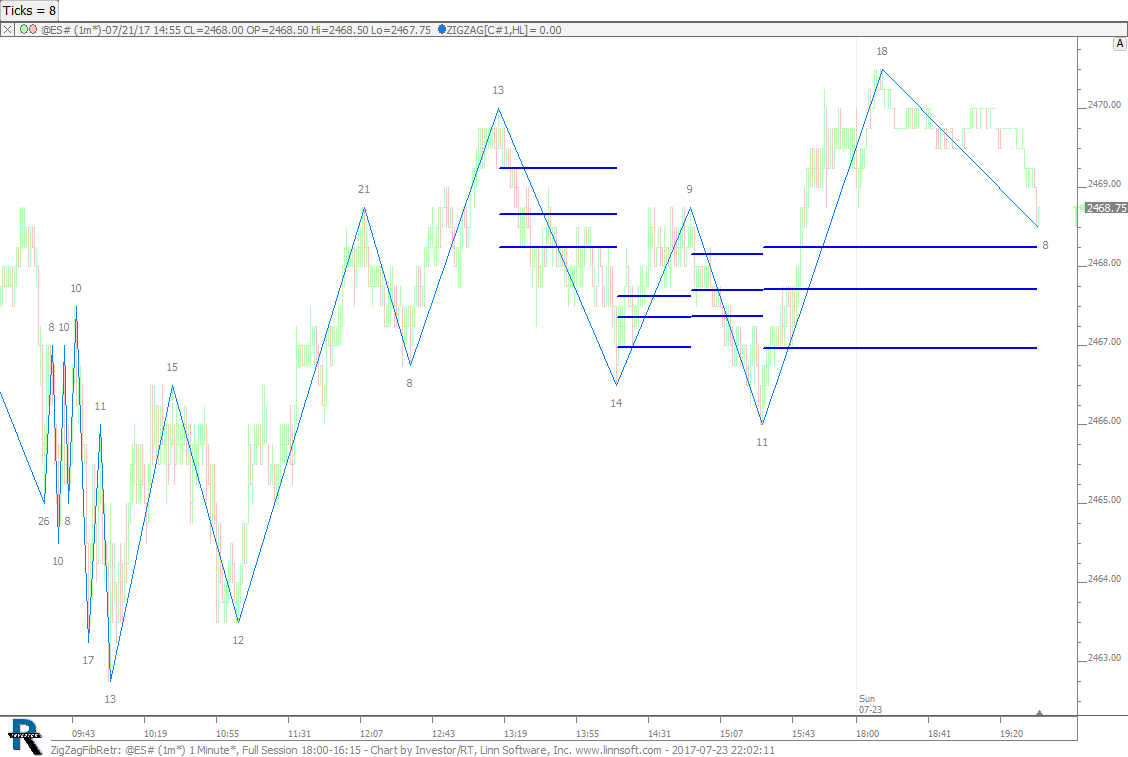 |
ZigZagFibRetr (@ES#) cpayne [totalcount]
7 years 9 months ago
This chart was uploaded by Investor/RT 12.7.7 showing symbol: @ES#. |
View |
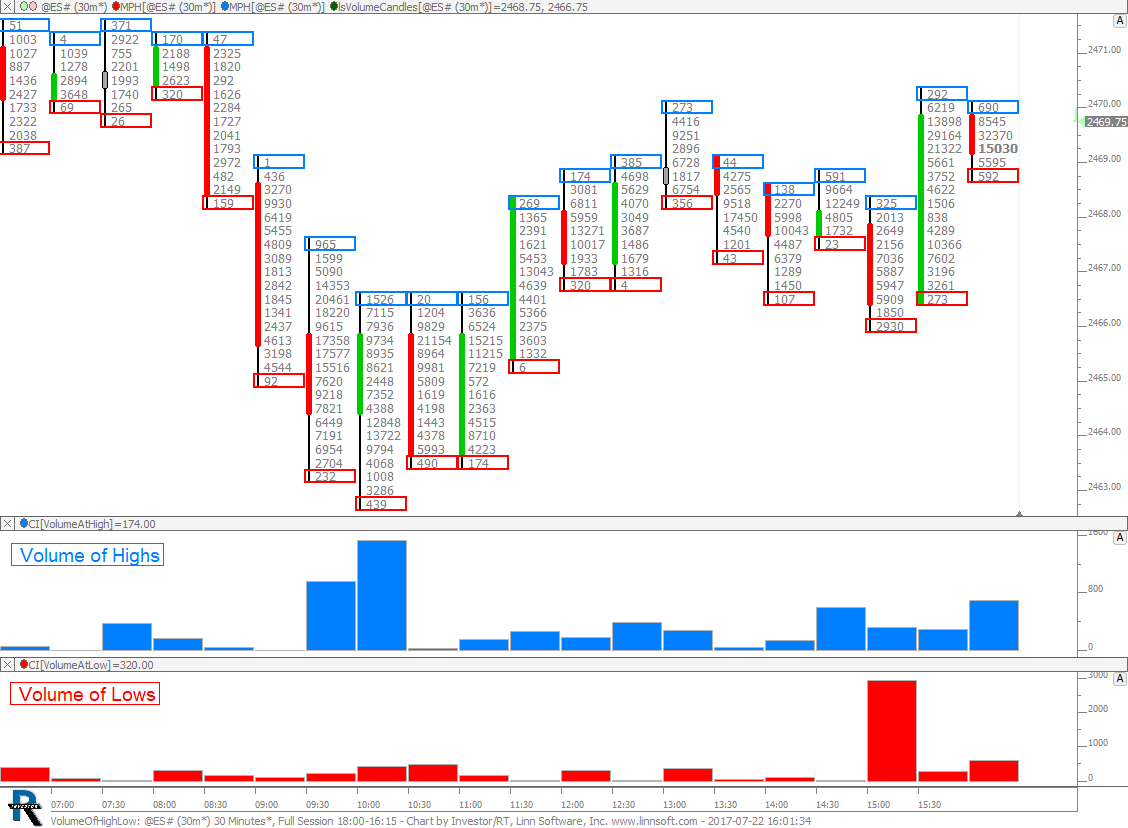 |
VolumeOfHighLow (@ES#) cpayne [totalcount]
7 years 9 months ago
Volume of High and Low Prices in RTL. This chart was uploaded by Investor/RT 12.7.7 showing symbol: @ES#. |
View |
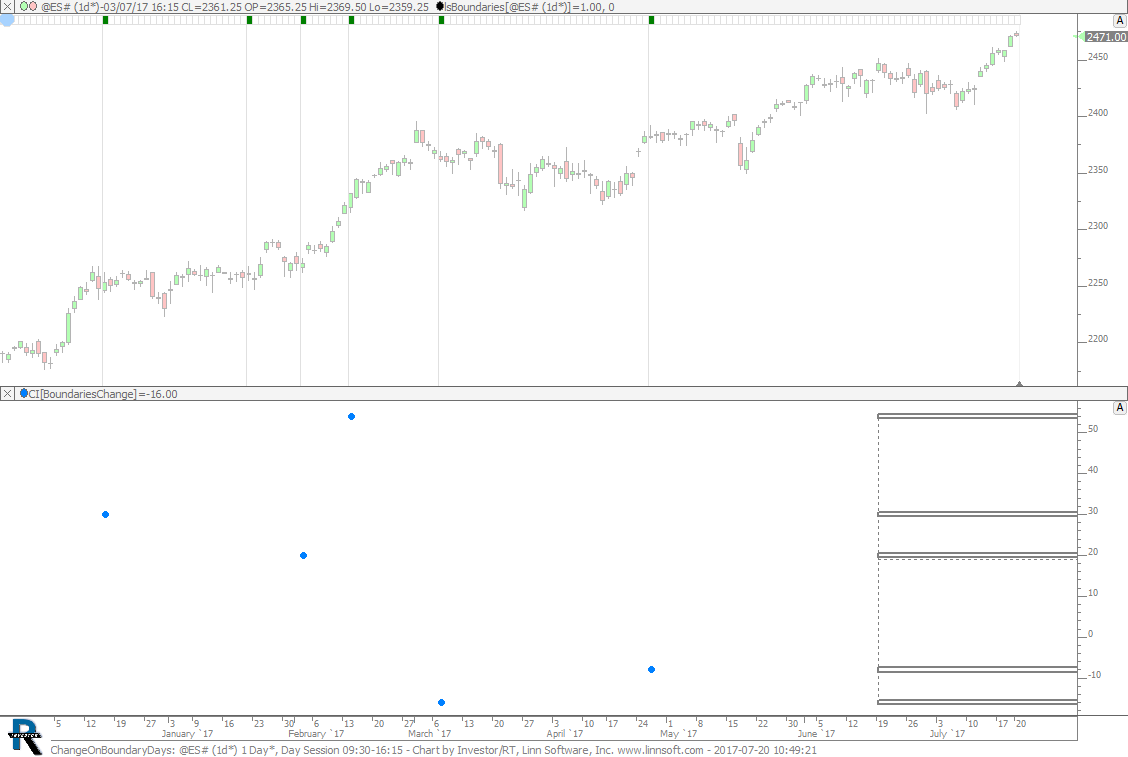 |
ChangeOnBoundaryDays (@ES#) cpayne [totalcount]
7 years 9 months ago
Change on Boundary Days Profiled. This chart was uploaded by Investor/RT 12.7.7 showing symbol: @ES#. |
View |
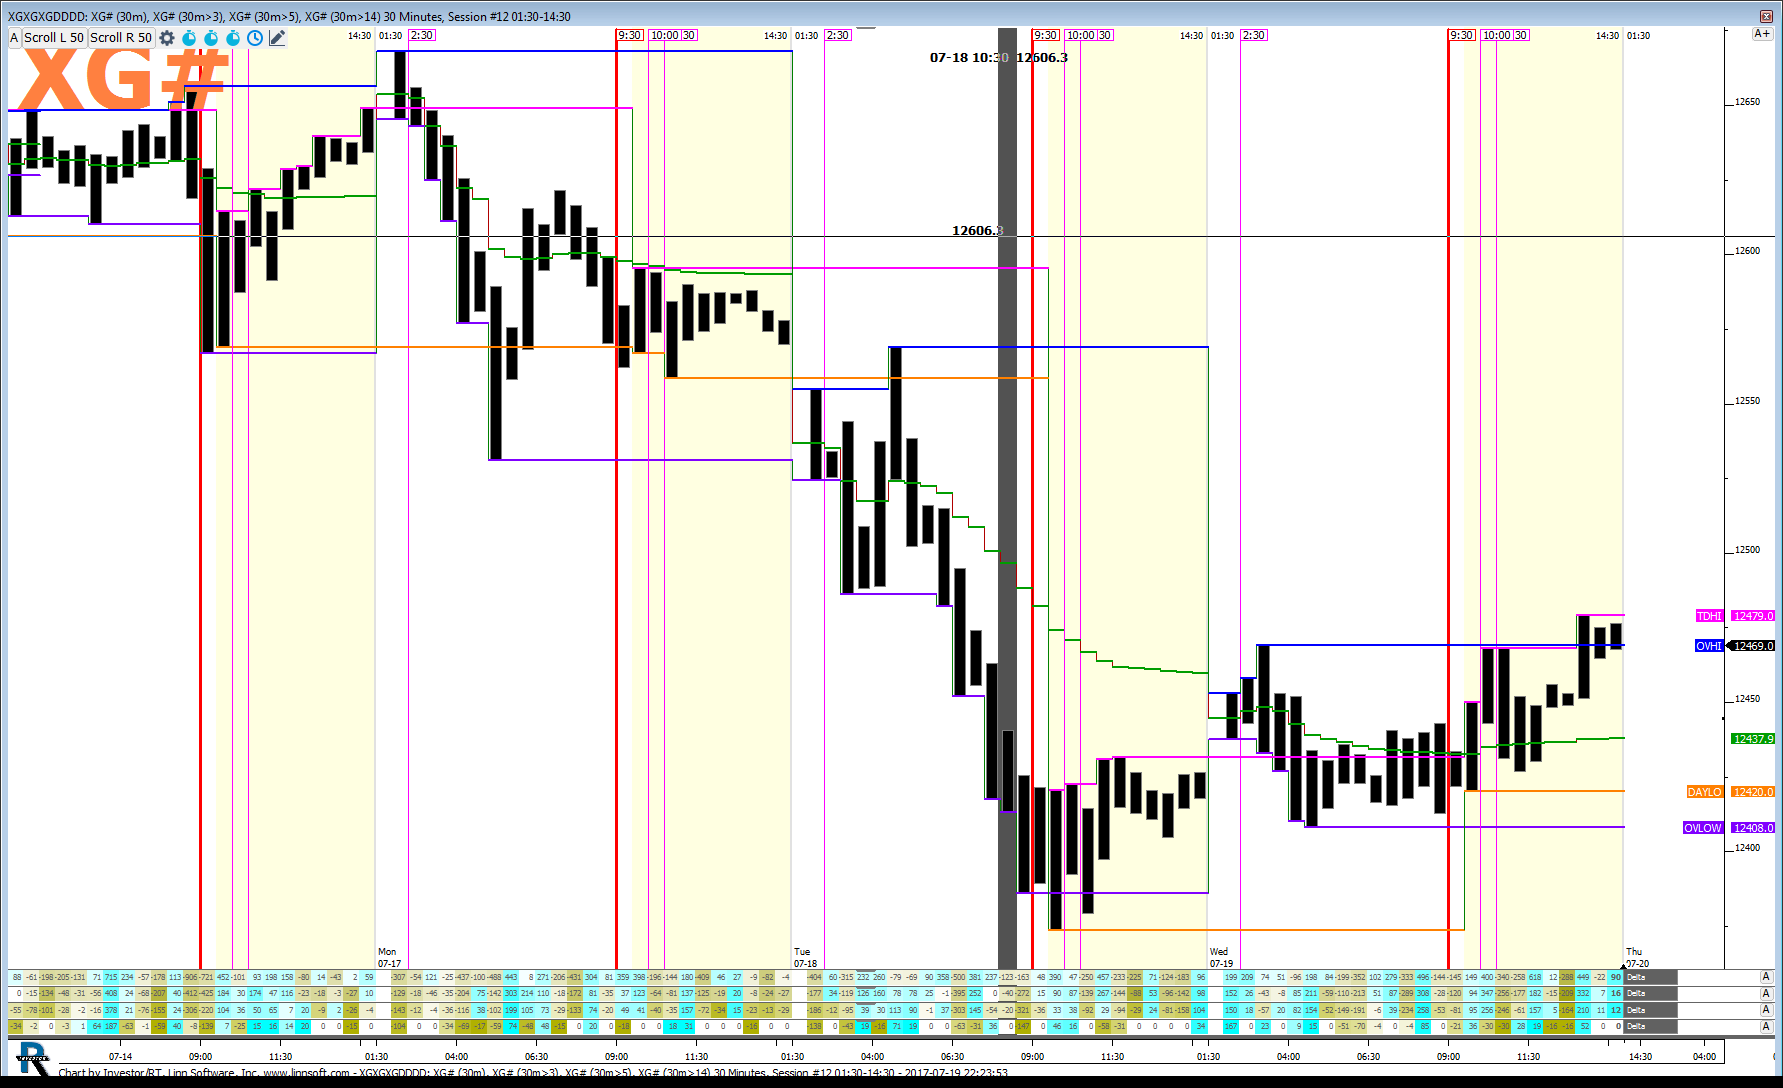 |
XGXGXGDDDD (XG#) hsams1 [totalcount]
7 years 9 months ago
CURTIS. This chart was uploaded by Investor/RT 12.7.6 showing symbol: XG#. |
View |
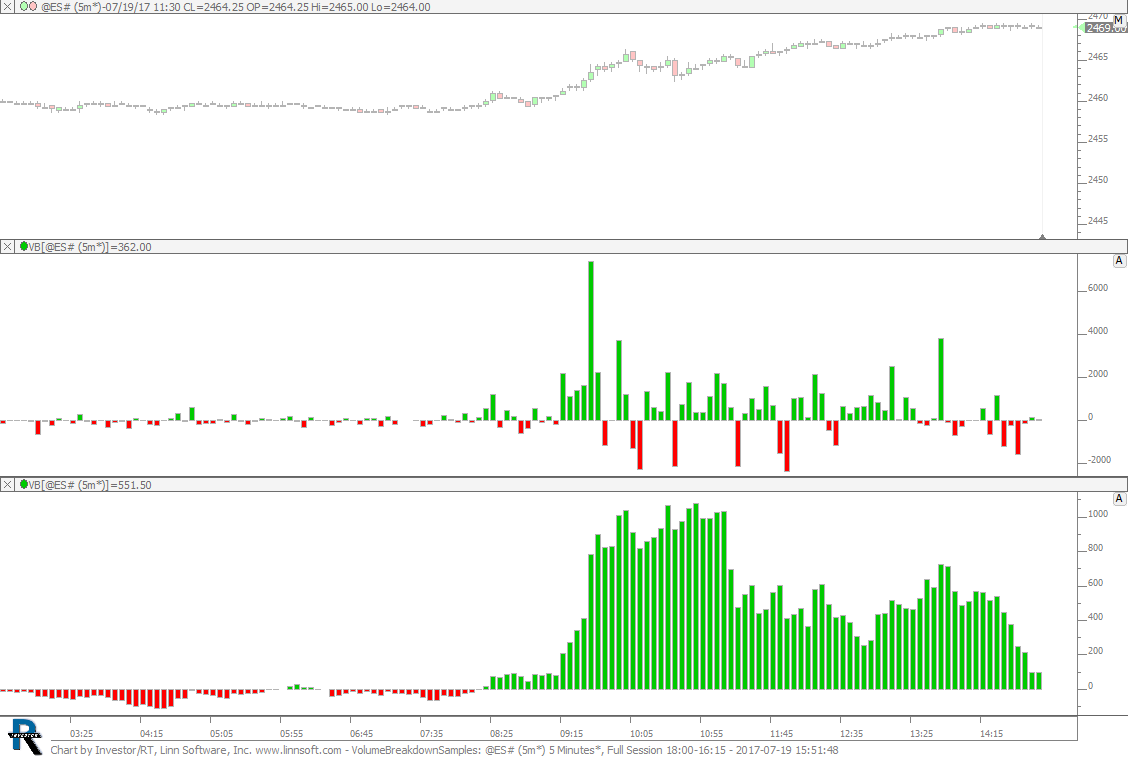 |
VolumeBreakdownSamples (@ES#) cpayne [totalcount]
7 years 9 months ago
Volume Breakdown Samples. This chart was uploaded by Investor/RT 12.7.6 showing symbol: @ES#. |
View |
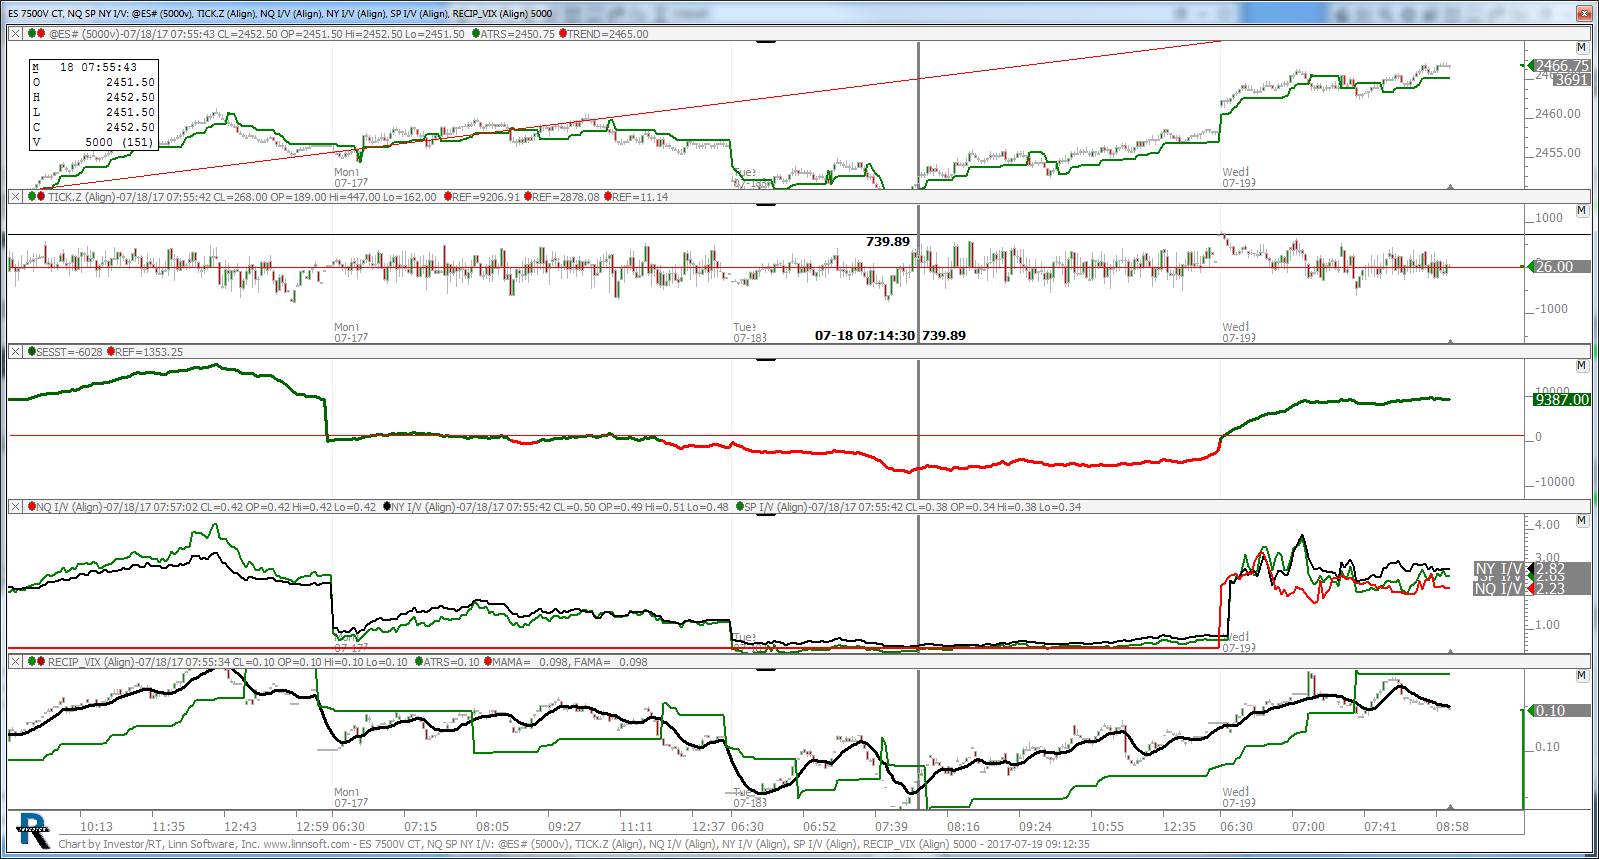 |
ES 7500V CT NQ SP NY I V (@ES#) kencassorla [totalcount]
7 years 9 months ago
7500v. This chart was uploaded by Investor/RT 12.7.6 showing symbol: @ES#. |
View |
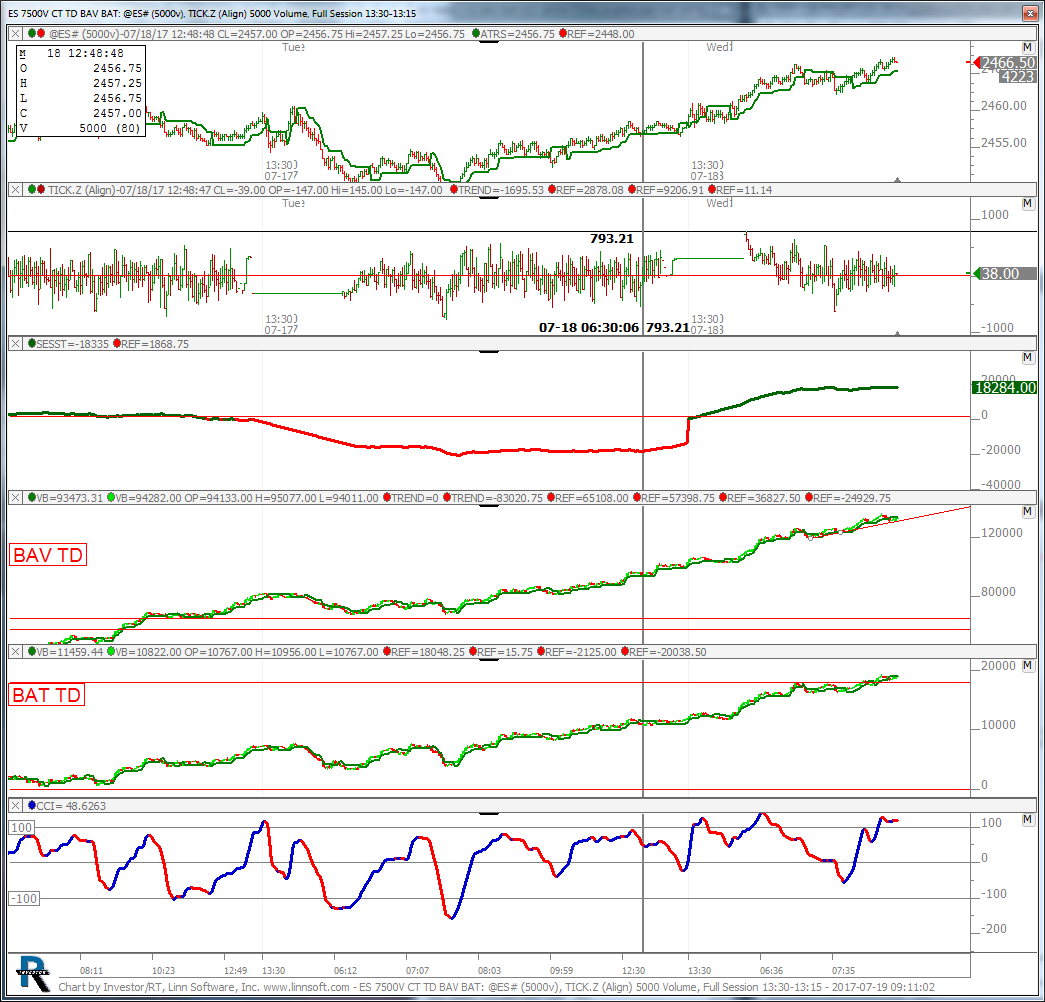 |
ES 7500V CT TD BAV BAT (@ES#) kencassorla [totalcount]
7 years 9 months ago
7500v. This chart was uploaded by Investor/RT 12.7.6 showing symbol: @ES#. |
View |
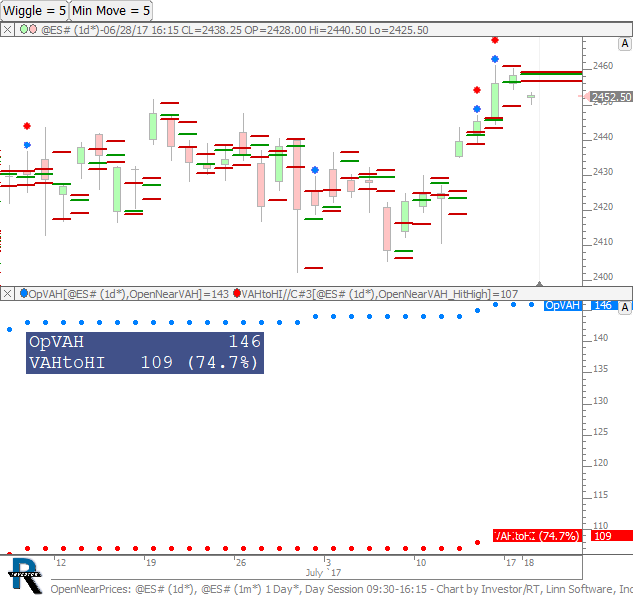 |
OpenNearPrices (@ES#) cpayne [totalcount]
7 years 9 months ago
Open Near Prev VAH and Move to Prev High. This chart was uploaded by Investor/RT 12.7.7 showing symbol: @ES#. |
View |
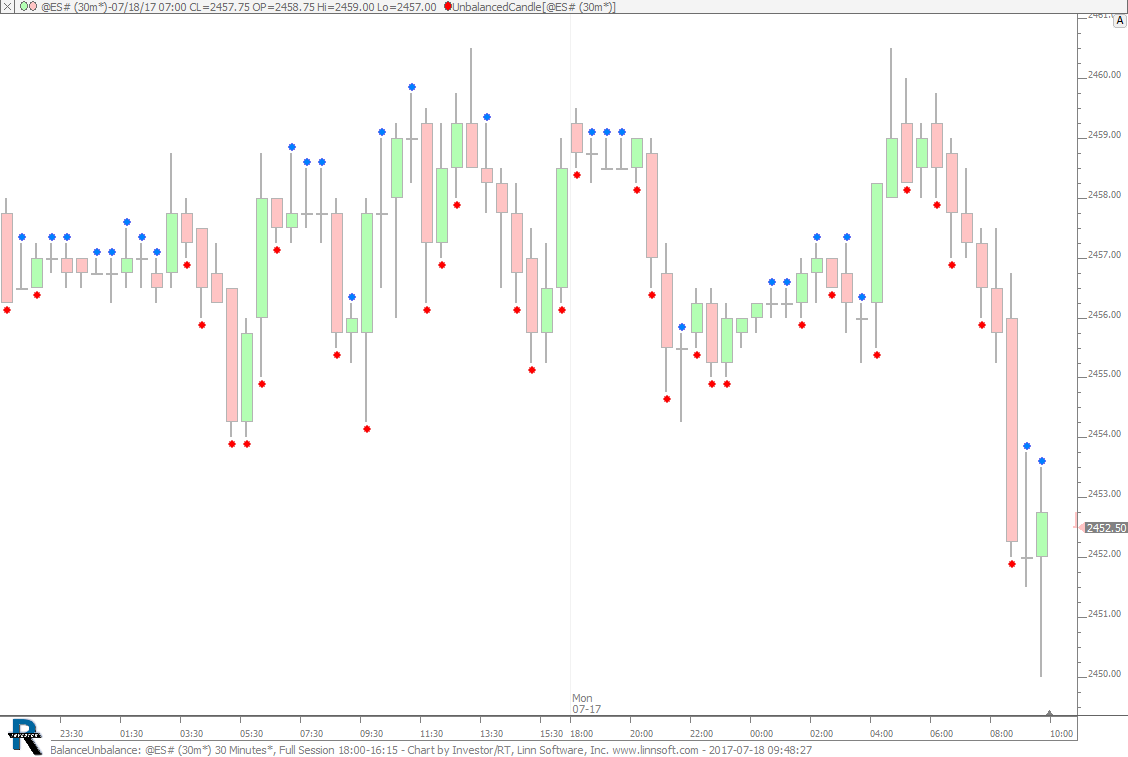 |
BalanceUnbalance (@ES#) cpayne [totalcount]
7 years 9 months ago
Balanced and Unbalanced Candles. This chart was uploaded by Investor/RT 12.7.7 showing symbol: @ES#. |
View |
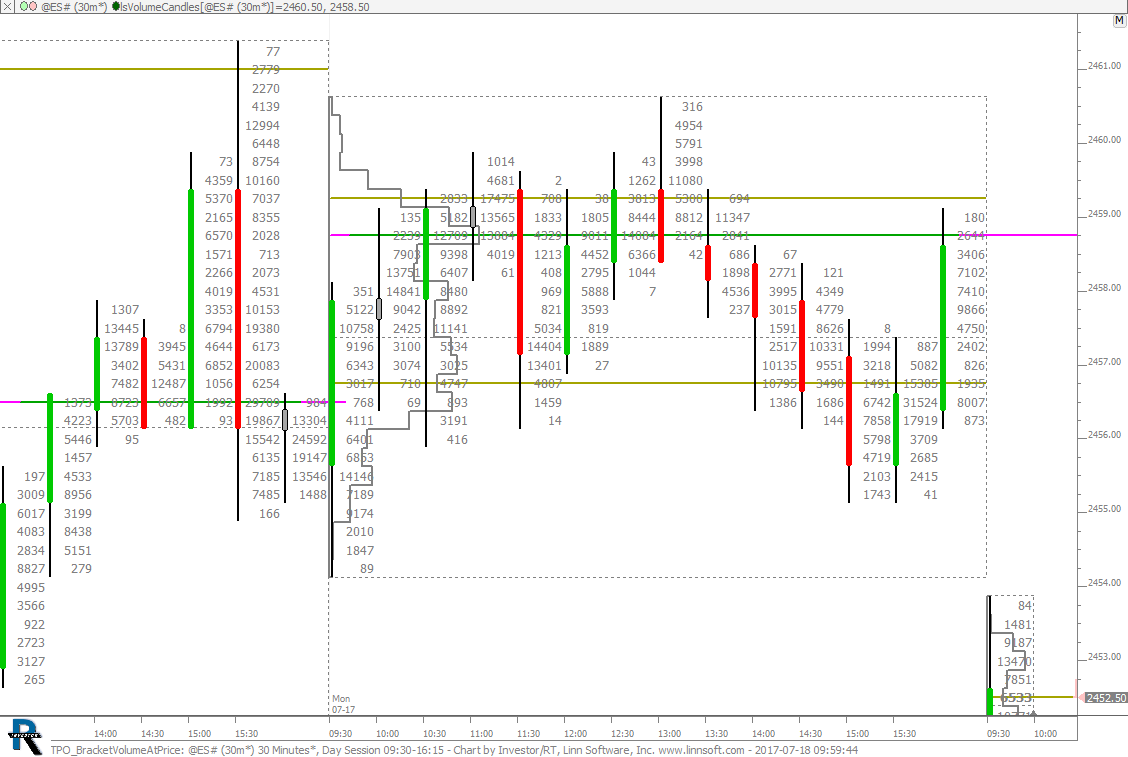 |
TPO BracketVolumeAtPrice (@ES#) cpayne [totalcount]
7 years 9 months ago
This chart was uploaded by Investor/RT 12.7.7 showing symbol: @ES#. |
View |
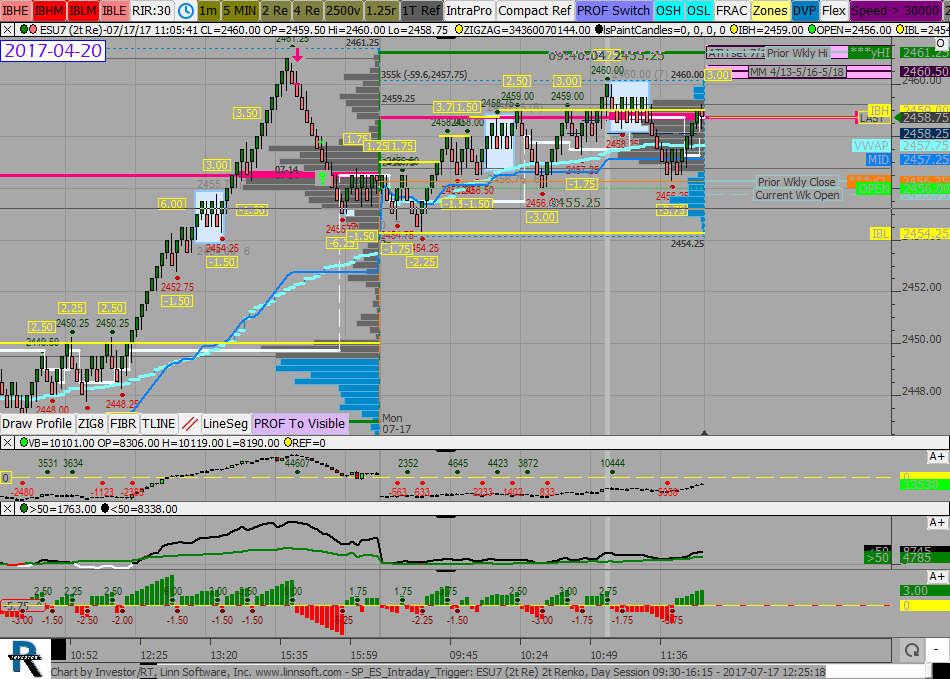 |
SP ES Intraday Trigger (ESU7) SPetkov [totalcount]
7 years 9 months ago
This chart was uploaded by Investor/RT 12.7.6 showing symbol: ESU7. |
View |
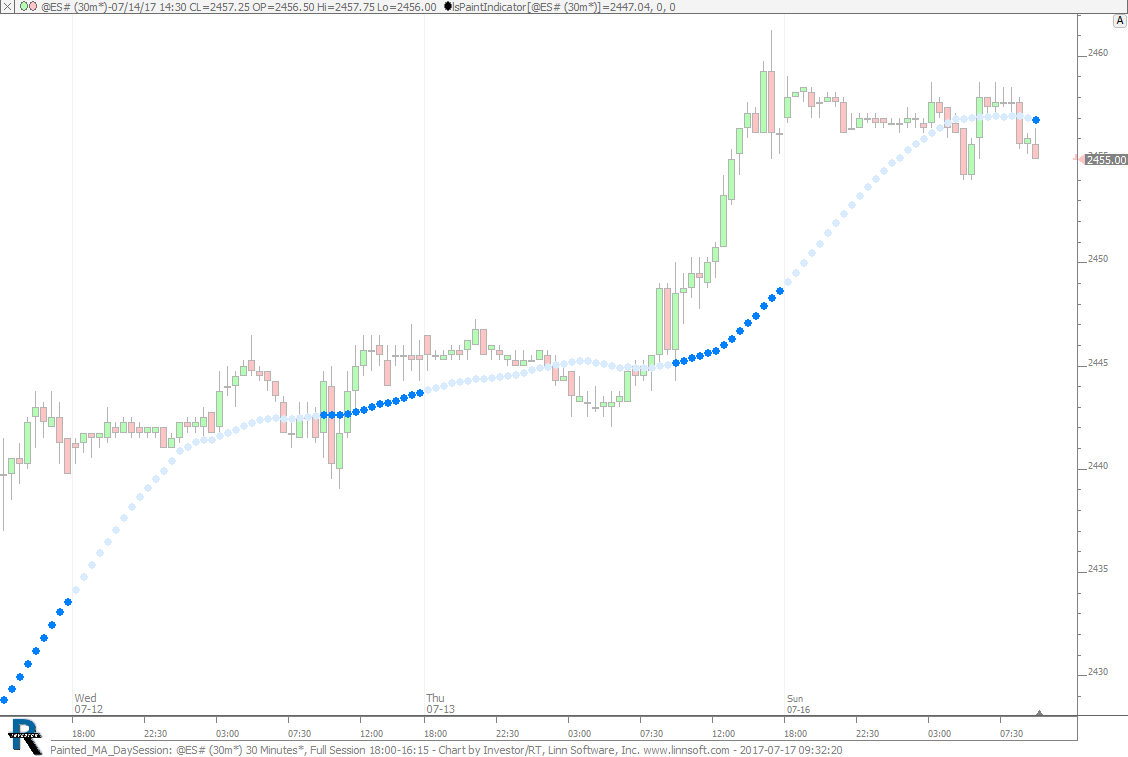 |
Painted MA DaySession (@ES#) cpayne [totalcount]
7 years 9 months ago
Moving Average Painted During Day Session. This chart was uploaded by Investor/RT 12.7.7 showing symbol: @ES#. |
View |
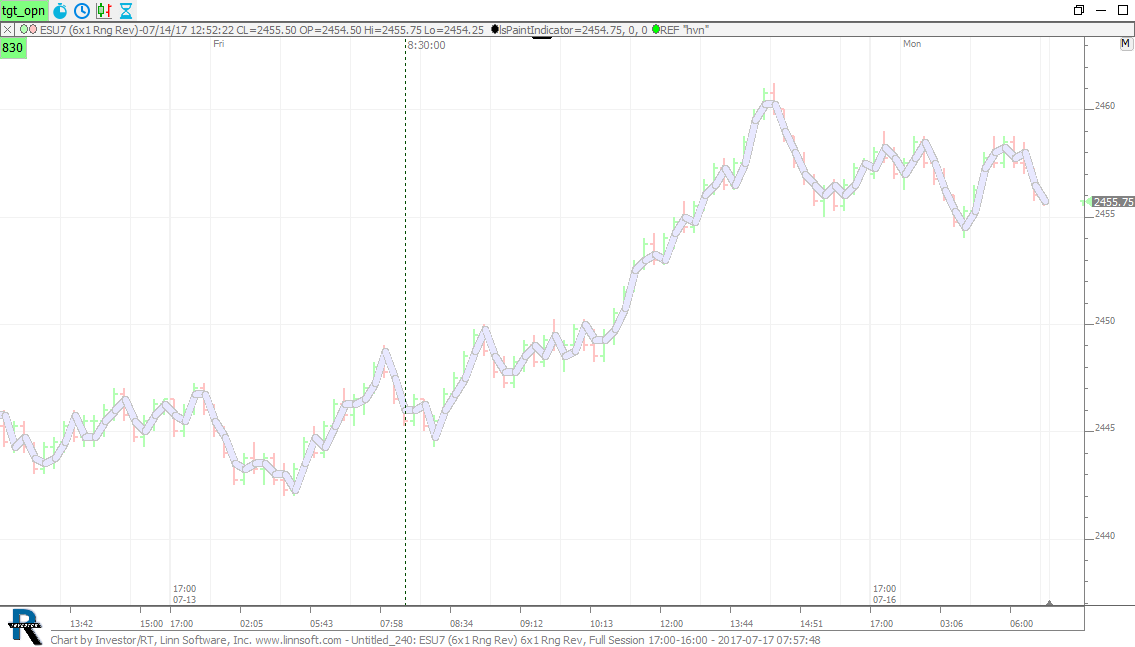 |
Untitled (ESU7) ctj0601 [totalcount]
7 years 9 months ago
IsPaintIndicator - how to color by session?. This chart was uploaded by Investor/RT 12.7.6 showing symbol: ESU7. |
View |
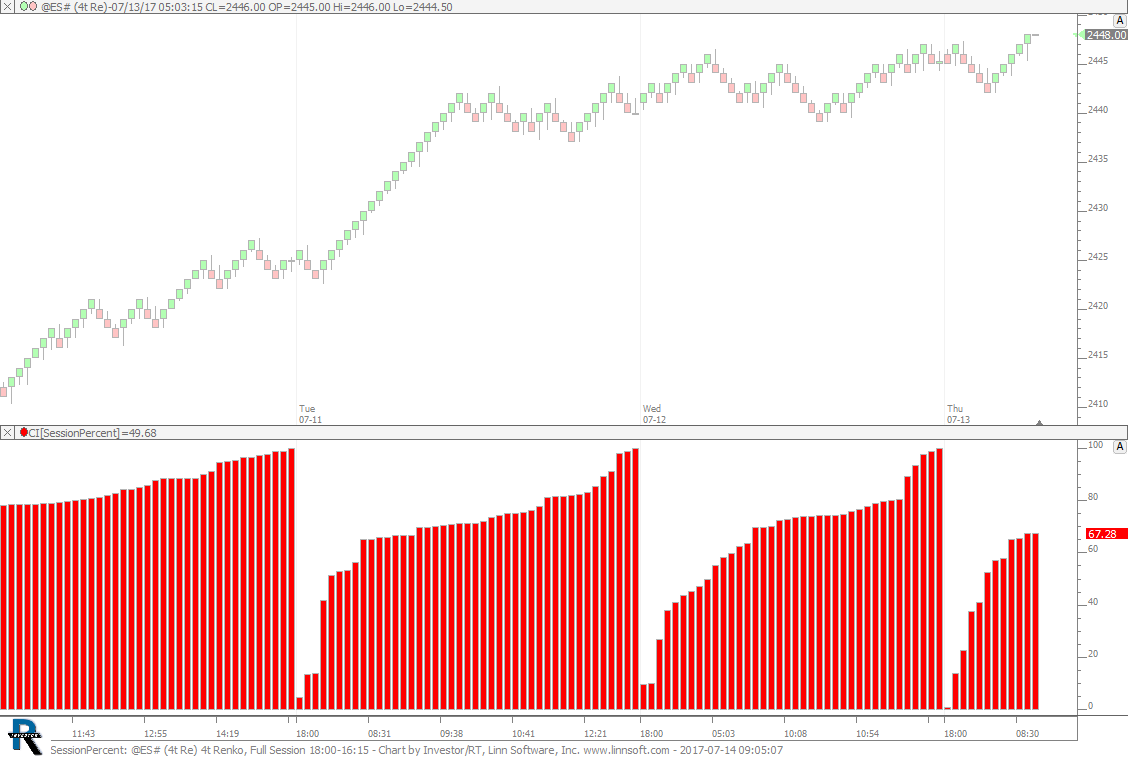 |
SessionPercent (@ES#) cpayne [totalcount]
7 years 9 months ago
Day Percent Historically. This chart was uploaded by Investor/RT 12.7.7 showing symbol: @ES#. |
View |