 |
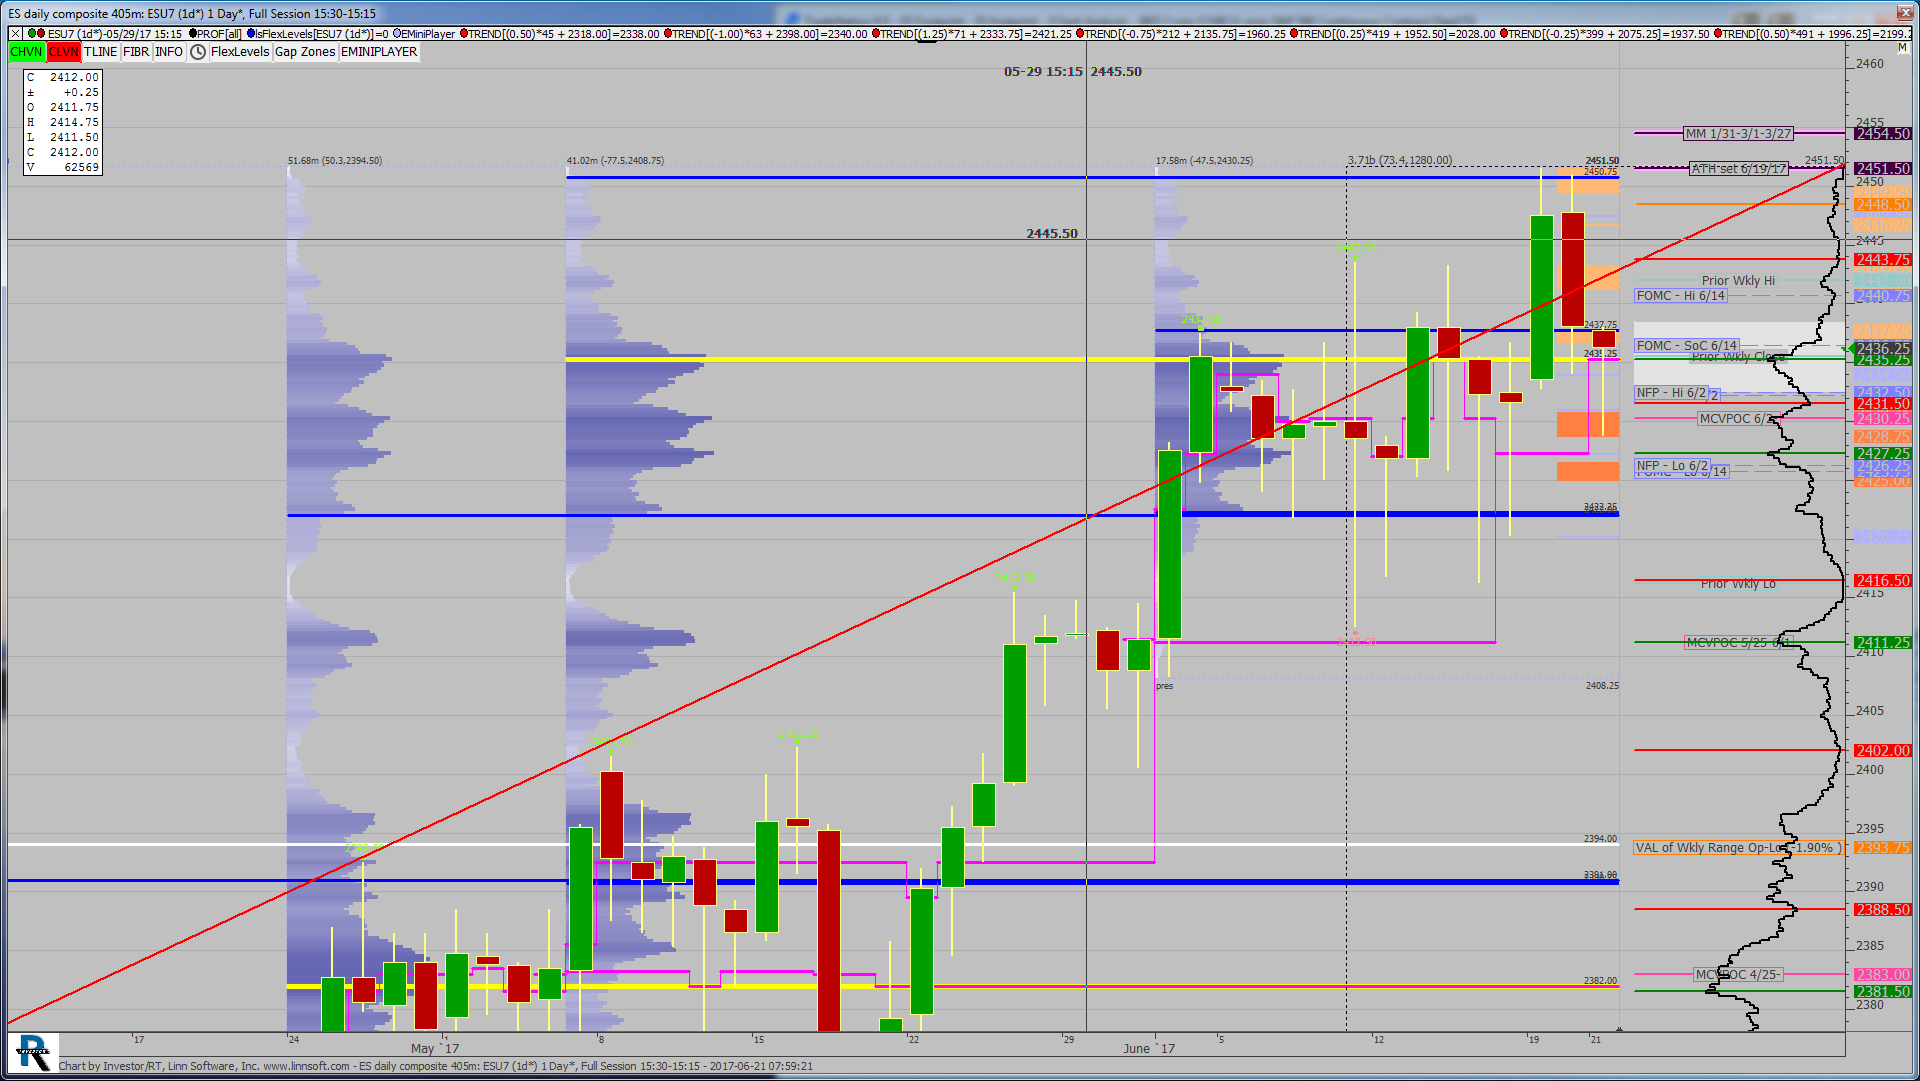
ES daily composite 405m (ESU7) scottz46 [totalcount]
7 years 10 months ago
This chart was uploaded by Investor/RT 12.7.1 showing symbol: ESU7. |
View |
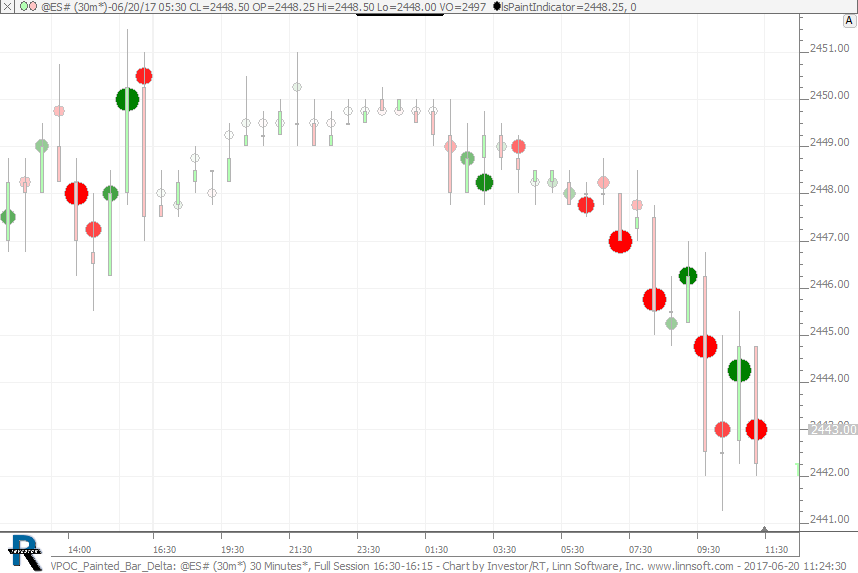 |
VPOC Painted Bar Delta (@ES#) cpayne [totalcount]
7 years 10 months ago
VPOC Painted with size and color relative to delta of bar. This chart was uploaded by Investor/RT 12.7.6 showing symbol: @ES#. |
View |
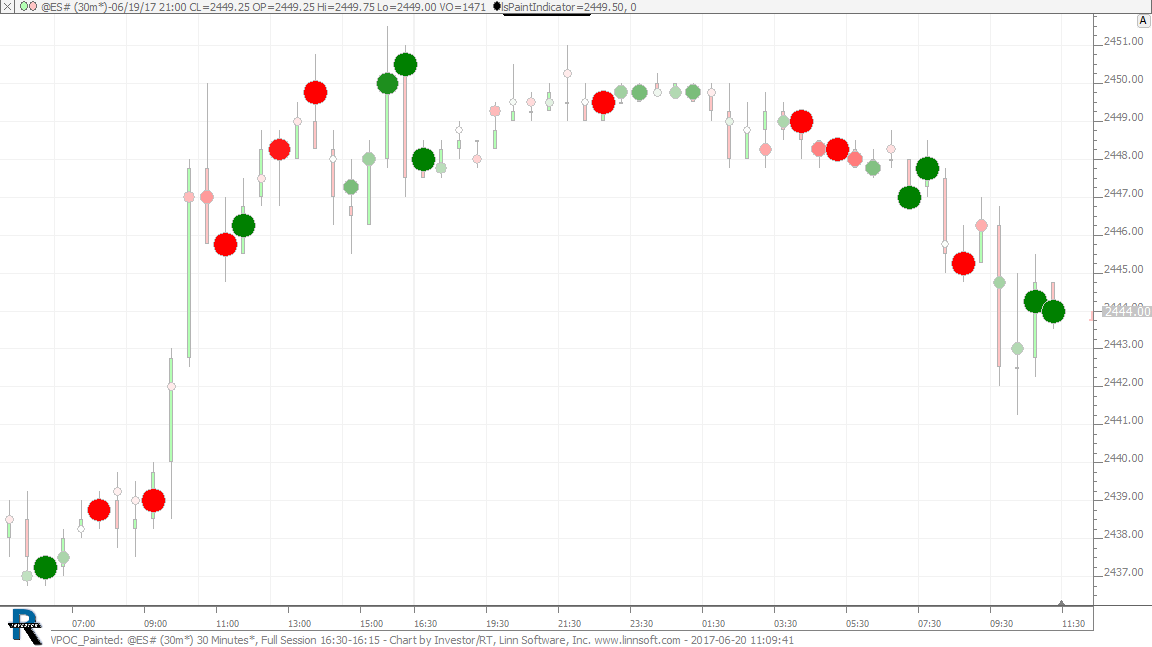 |
VPOC Painted (@ES#) cpayne [totalcount]
7 years 10 months ago
VPOC Painted with size and color relative to Delta of VPOC. This chart was uploaded by Investor/RT 12.7.6 showing symbol: @ES#. |
View |
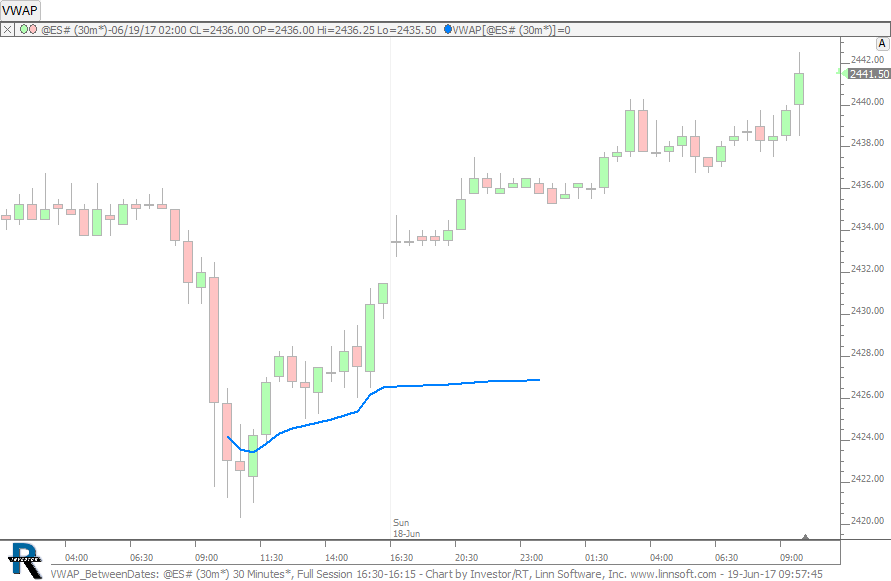 |
VWAP BetweenDates (@ES#) cpayne [totalcount]
7 years 10 months ago
VWAP Between Date/Times. This chart was uploaded by Investor/RT 12.7.6 showing symbol: @ES#. |
View |
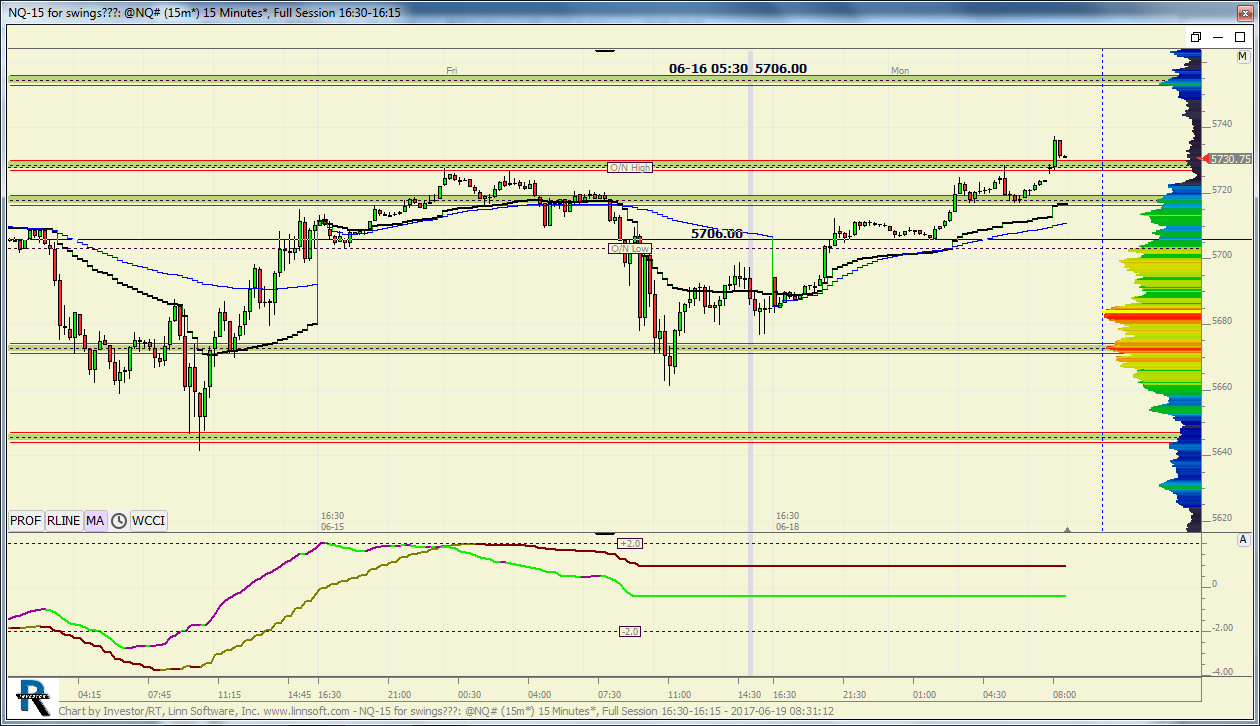 |
NQ 15 for swings (@NQ#) jfrey3rd [totalcount]
7 years 10 months ago
MPD flat line-what happened?. This chart was uploaded by Investor/RT 12.7.6 showing symbol: @NQ#. |
View |
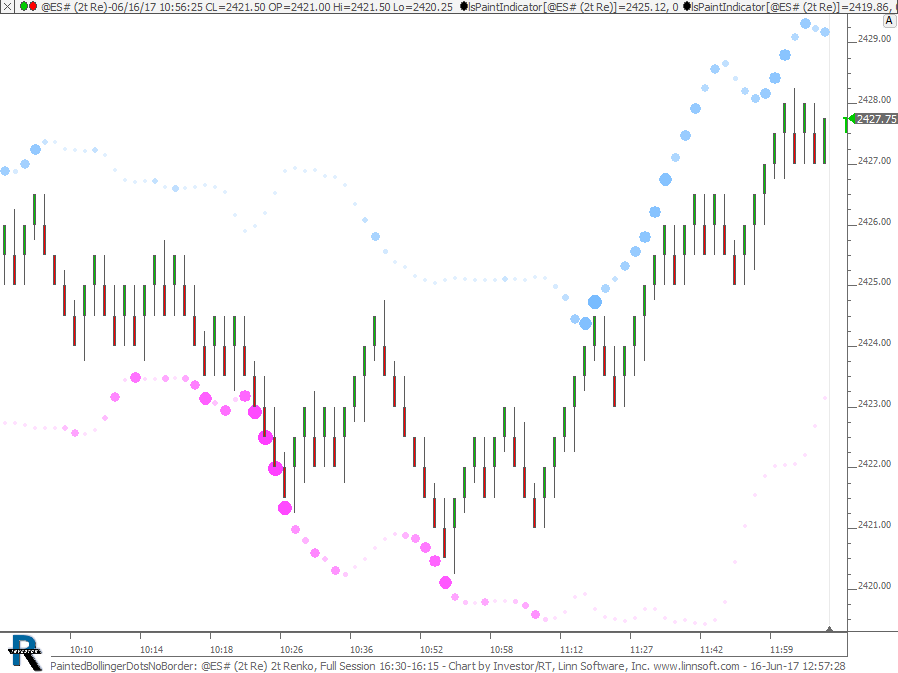 |
PaintedBollingerDotsNoBorder (@ES#) cpayne [totalcount]
7 years 10 months ago
Painted Bollinger Dots - No Borders. This chart was uploaded by Investor/RT 12.7.6 showing symbol: @ES#. |
View |
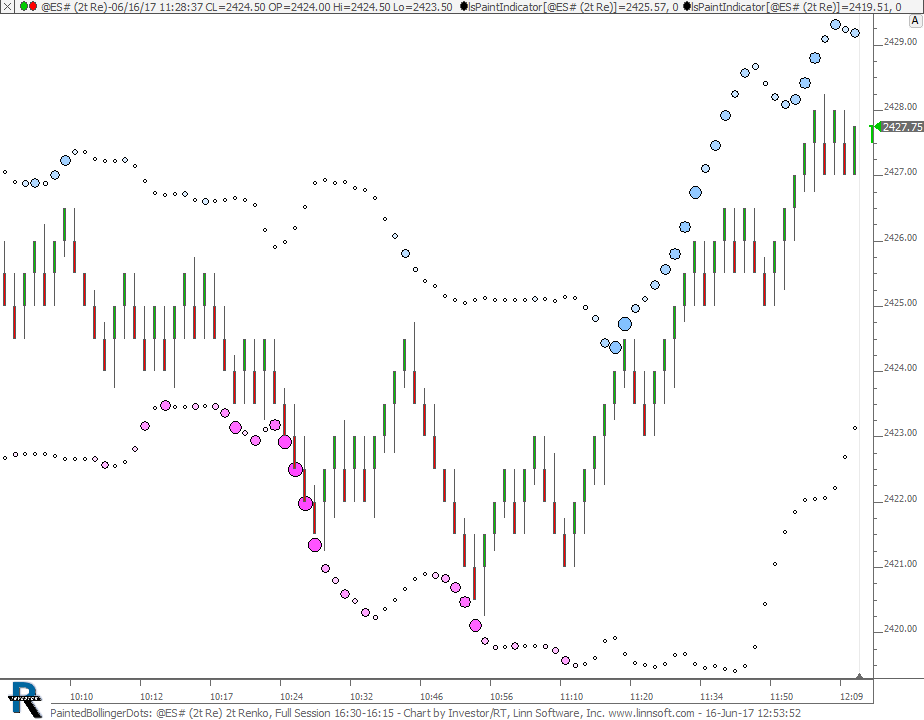 |
PaintedBollingerDots (@ES#) cpayne [totalcount]
7 years 10 months ago
Painted Bollinger Dots. This chart was uploaded by Investor/RT 12.7.6 showing symbol: @ES#. |
View |
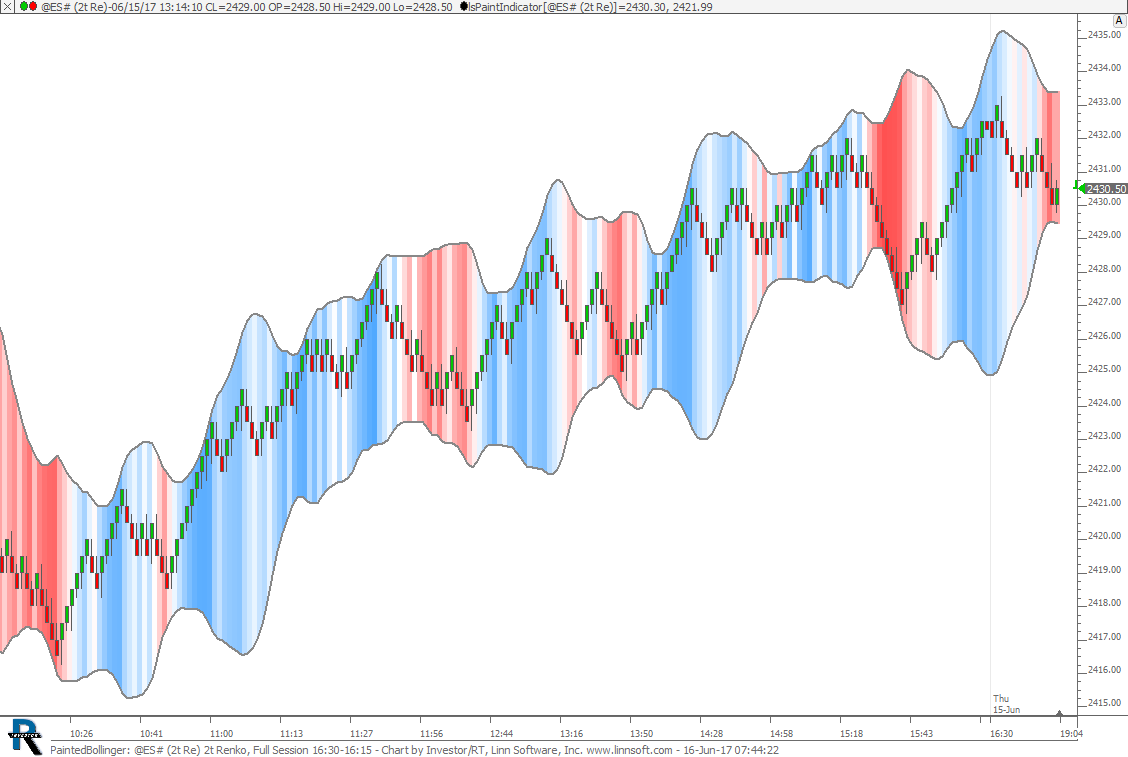 |
PaintedBollinger (@ES#) cpayne [totalcount]
7 years 10 months ago
Painted Bollinger. This chart was uploaded by Investor/RT 12.7.6 showing symbol: @ES#. |
View |
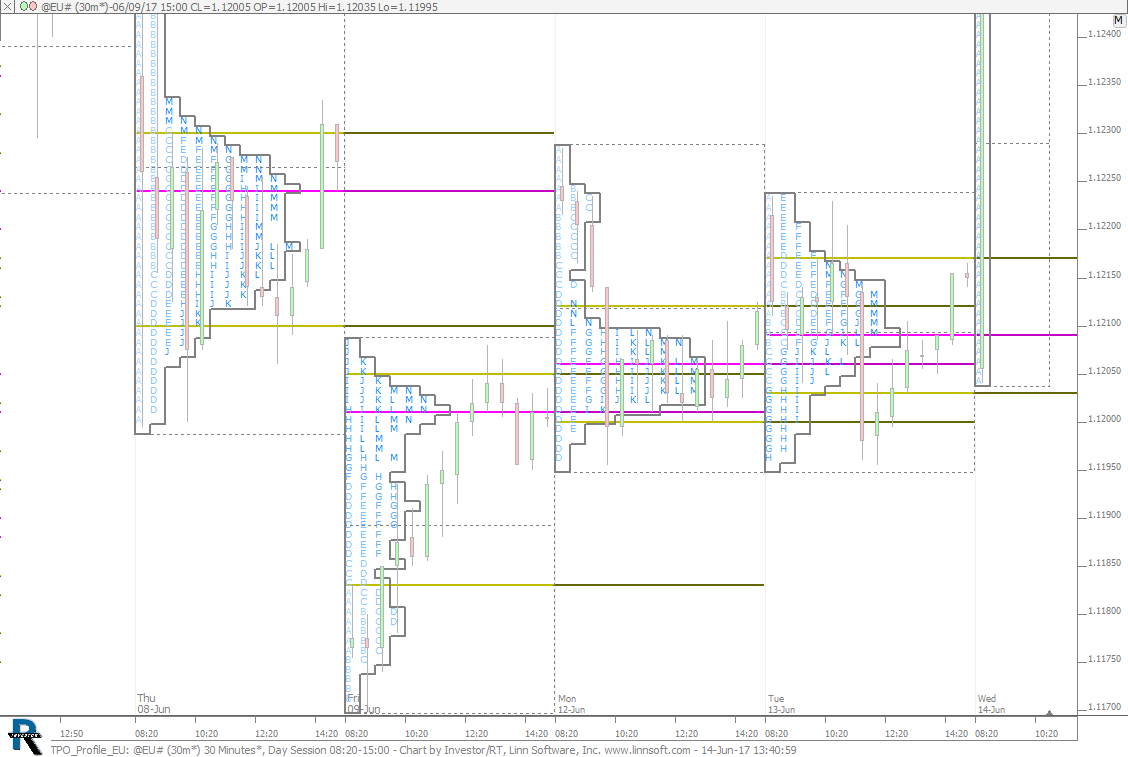 |
TPO Profile EU (@EU#) cpayne [totalcount]
7 years 10 months ago
TPO Profile EU. This chart was uploaded by Investor/RT 12.7.6 showing symbol: @EU#. |
View |
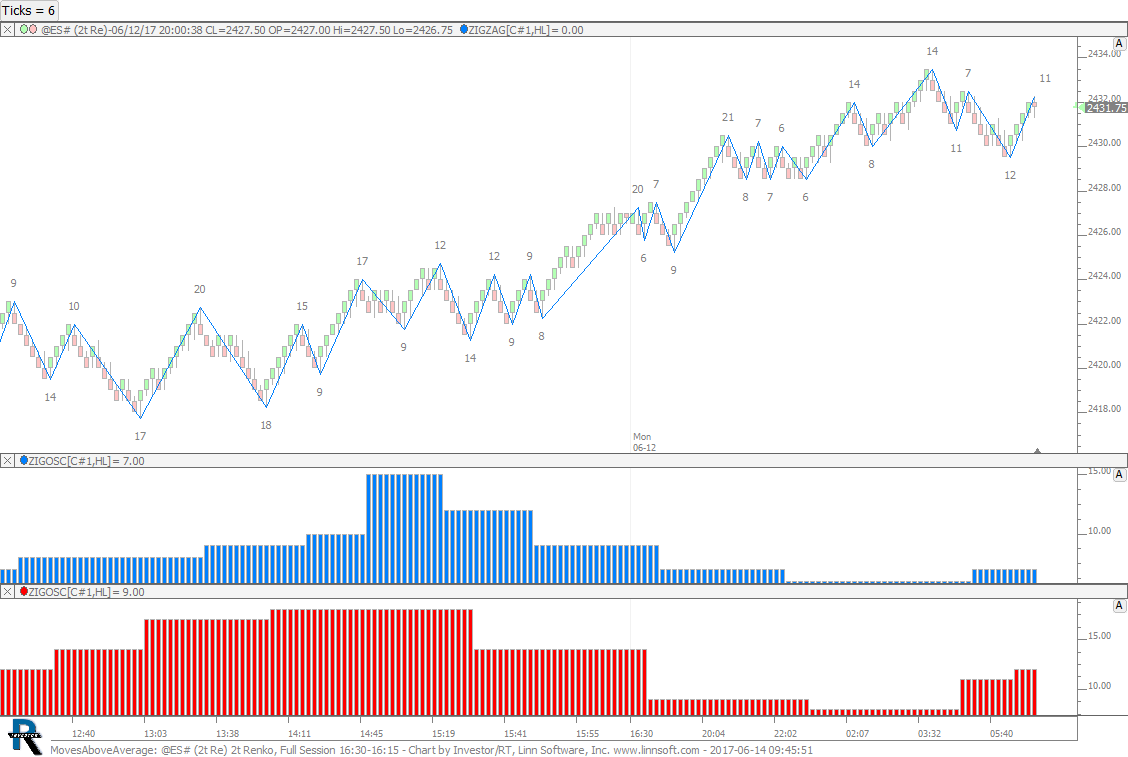 |
MovesAboveAverage (@ES#) cpayne [totalcount]
7 years 10 months ago
Zig Zag Moves Above/Below Average. This chart was uploaded by Investor/RT 12.7.5 showing symbol: @ES#. |
View |
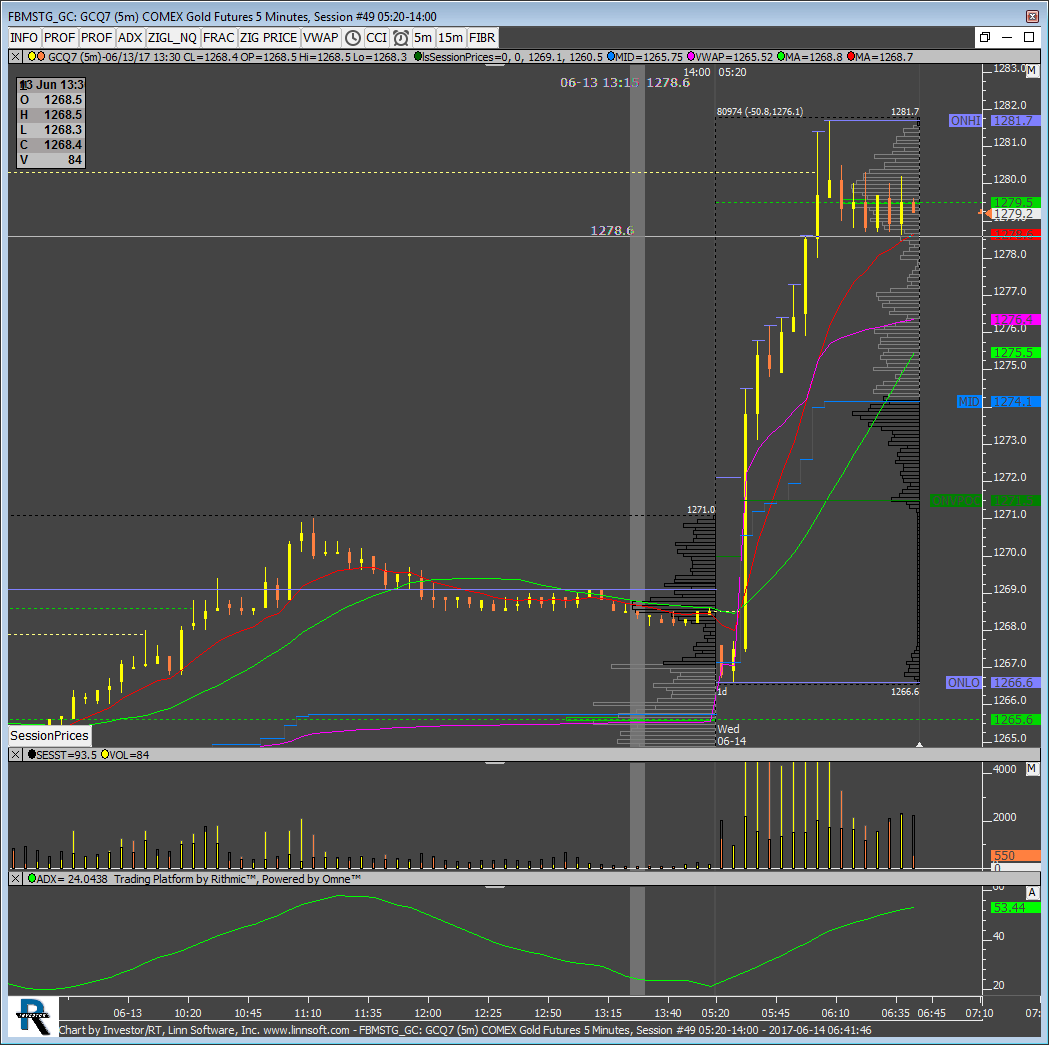 |
FBMSTG GC (GCQ7) MPTrader [totalcount]
7 years 10 months ago
Session Prices - ONHI, ONLO and ONVPOC are incorrect. They should be1272.1, 1266.6 and 1270 repsectively. This chart was uploaded by Investor/RT 12.7.1 showing symbol: GCQ7. |
View |
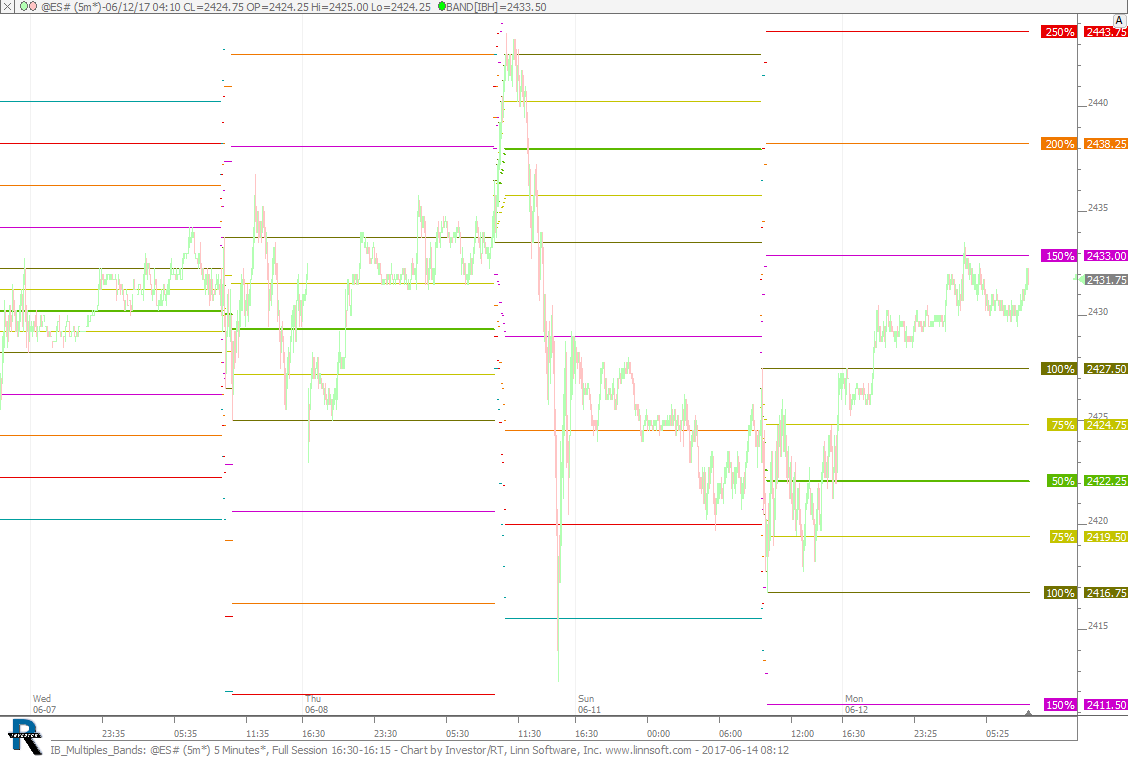 |
IB Multiples Bands (@ES#) cpayne [totalcount]
7 years 10 months ago
Initial Balance Multiples Using Bands Indicator. This chart was uploaded by Investor/RT 12.7.4 showing symbol: @ES#. |
View |
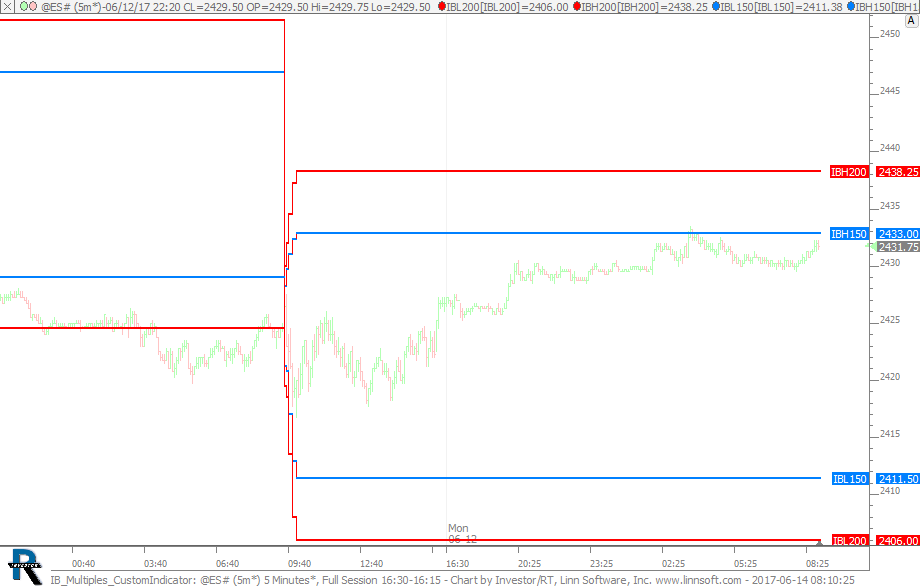 |
IB Multiples CustomIndicator (@ES#) cpayne [totalcount]
7 years 10 months ago
Initial Balance Multiples Using Custom Indicators. This chart was uploaded by Investor/RT 12.7.4 showing symbol: @ES#. |
View |
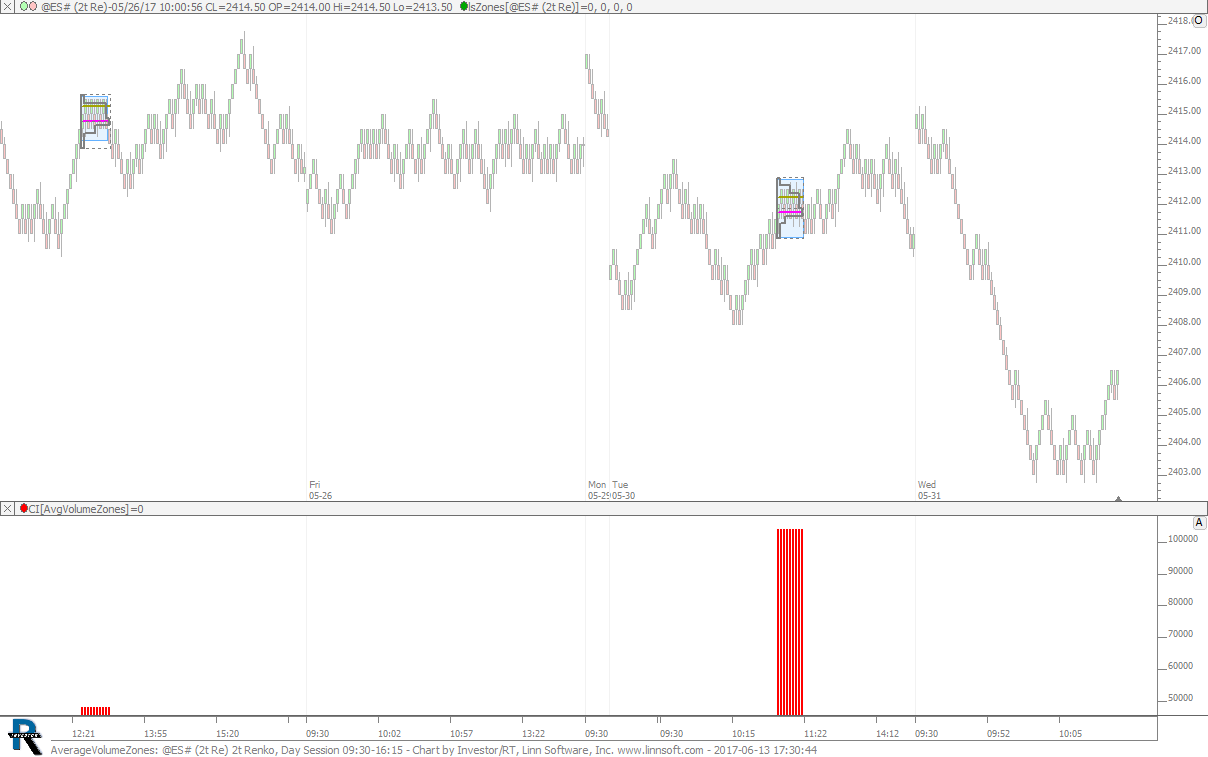 |
AverageVolumeZones (@ES#) cpayne [totalcount]
7 years 10 months ago
Average Volume Zones. This chart was uploaded by Investor/RT 12.7.5 showing symbol: @ES#. |
View |
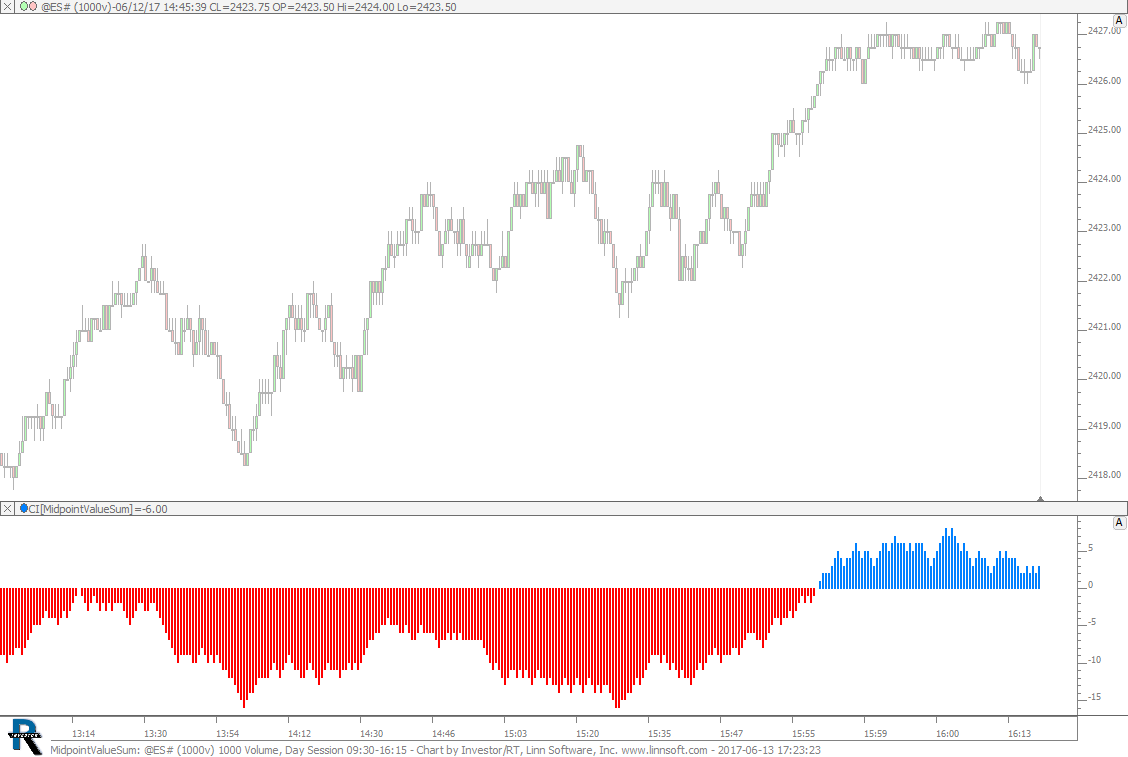 |
MidpointValueSum (@ES#) cpayne [totalcount]
7 years 10 months ago
Midpoint Value Summation. This chart was uploaded by Investor/RT 12.7.5 showing symbol: @ES#. |
View |
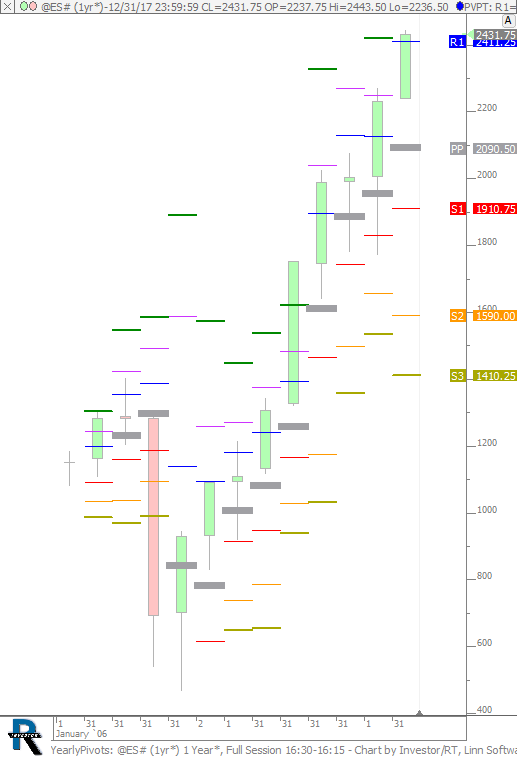 |
YearlyPivots (@ES#) cpayne [totalcount]
7 years 10 months ago
Yearly Pivots. This chart was uploaded by Investor/RT 12.7.5 showing symbol: @ES#. |
View |
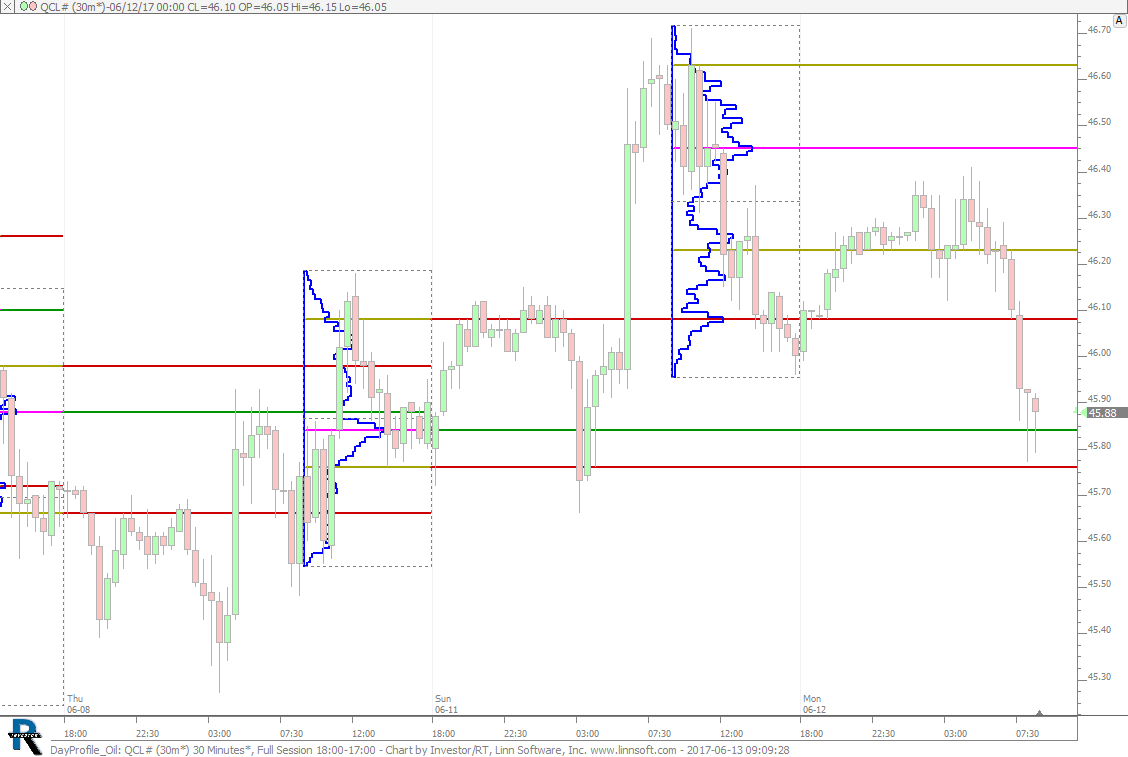 |
DayProfile Oil (QCL#) cpayne [totalcount]
7 years 10 months ago
Day Session Profiles - Oil. This chart was uploaded by Investor/RT 12.7.5 showing symbol: QCL#. |
View |
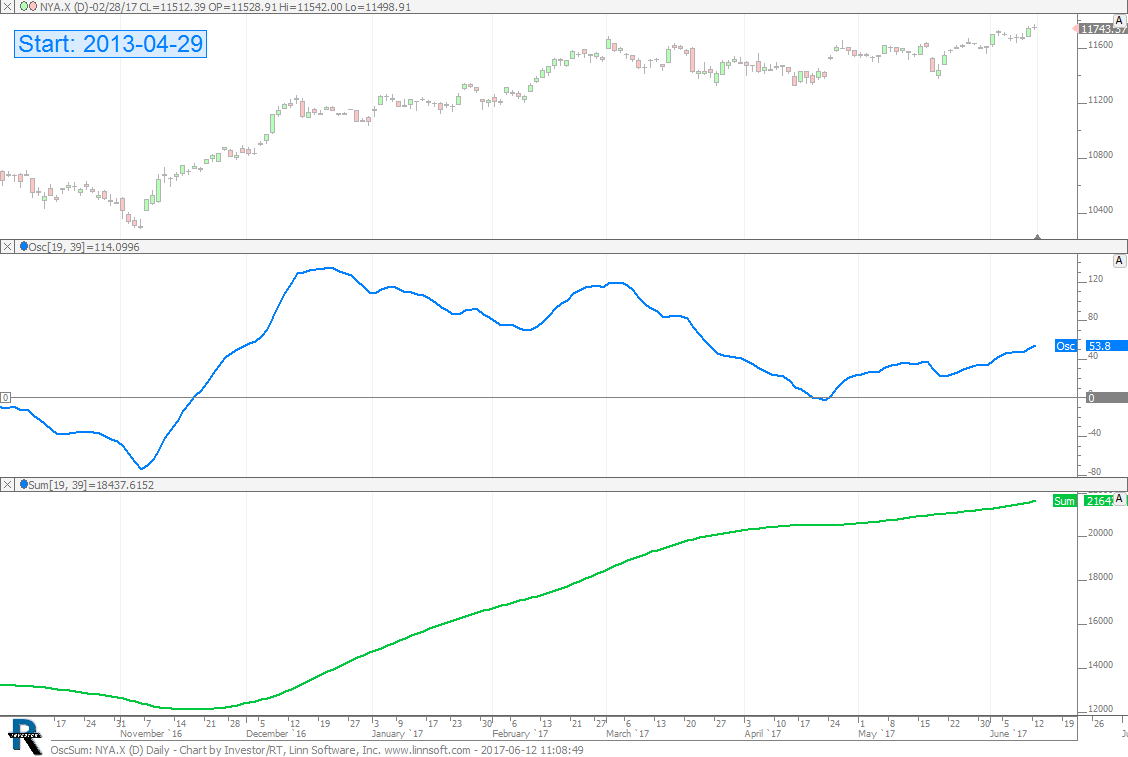 |
OscSum (NYA.X) cpayne [totalcount]
7 years 10 months ago
McClellan Oscillator/Summation on NYSE Composite. This chart was uploaded by Investor/RT 12.7.5 showing symbol: NYA.X. |
View |
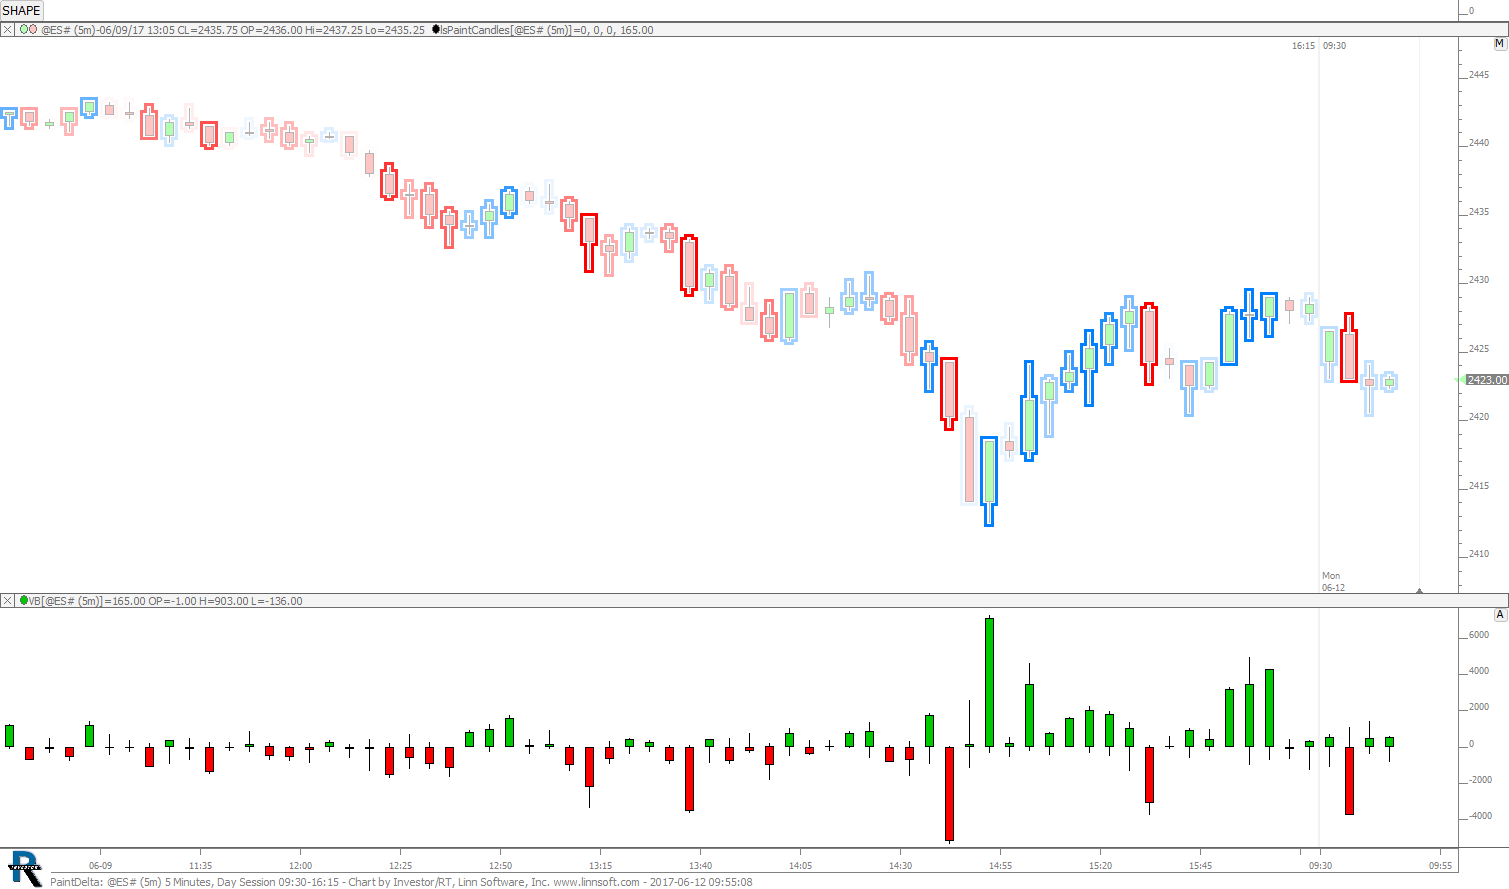 |
PaintDelta (@ES#) cpayne [totalcount]
7 years 10 months ago
Painting Candles based on Delta. This chart was uploaded by Investor/RT 12.7.5 showing symbol: @ES#. |
View |
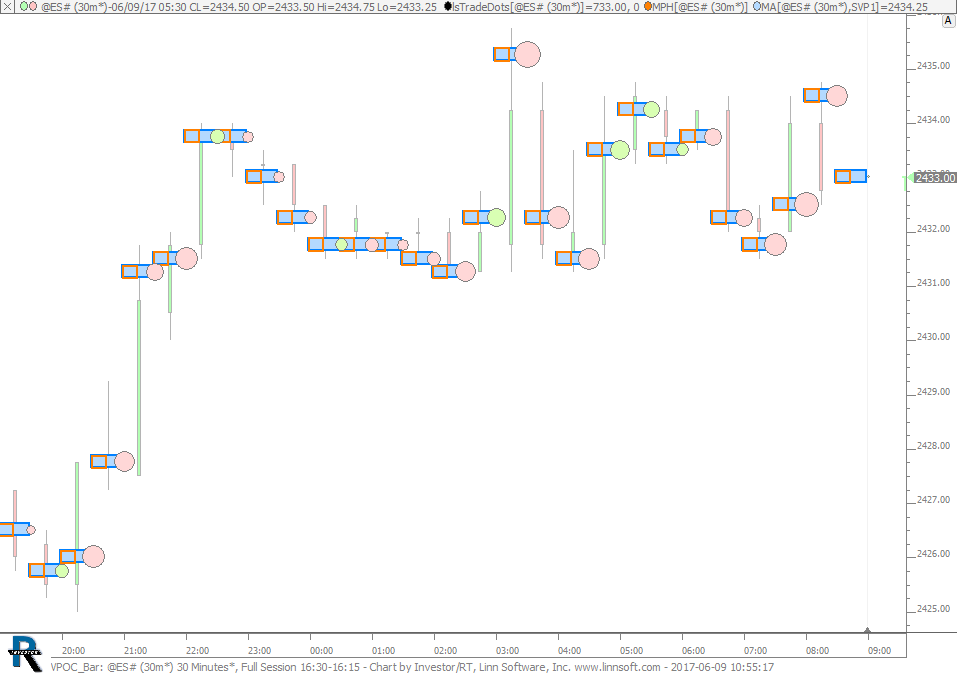 |
VPOC Bar (@ES#) cpayne [totalcount]
7 years 10 months ago
VPOC Bar - 3 Ways. This chart was uploaded by Investor/RT 12.7.5 showing symbol: @ES#. |
View |
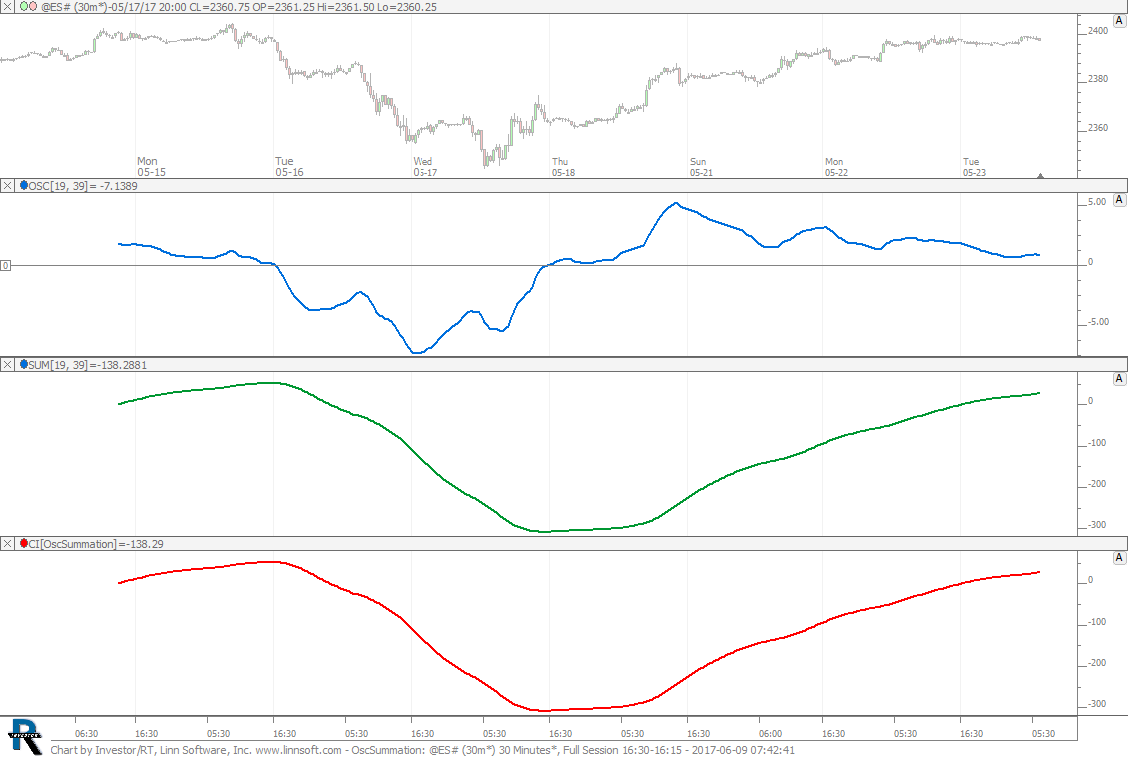 |
OscSummation (@ES#) cpayne [totalcount]
7 years 10 months ago
Oscillator / Summation. This chart was uploaded by Investor/RT 12.7.6 showing symbol: @ES#. |
View |
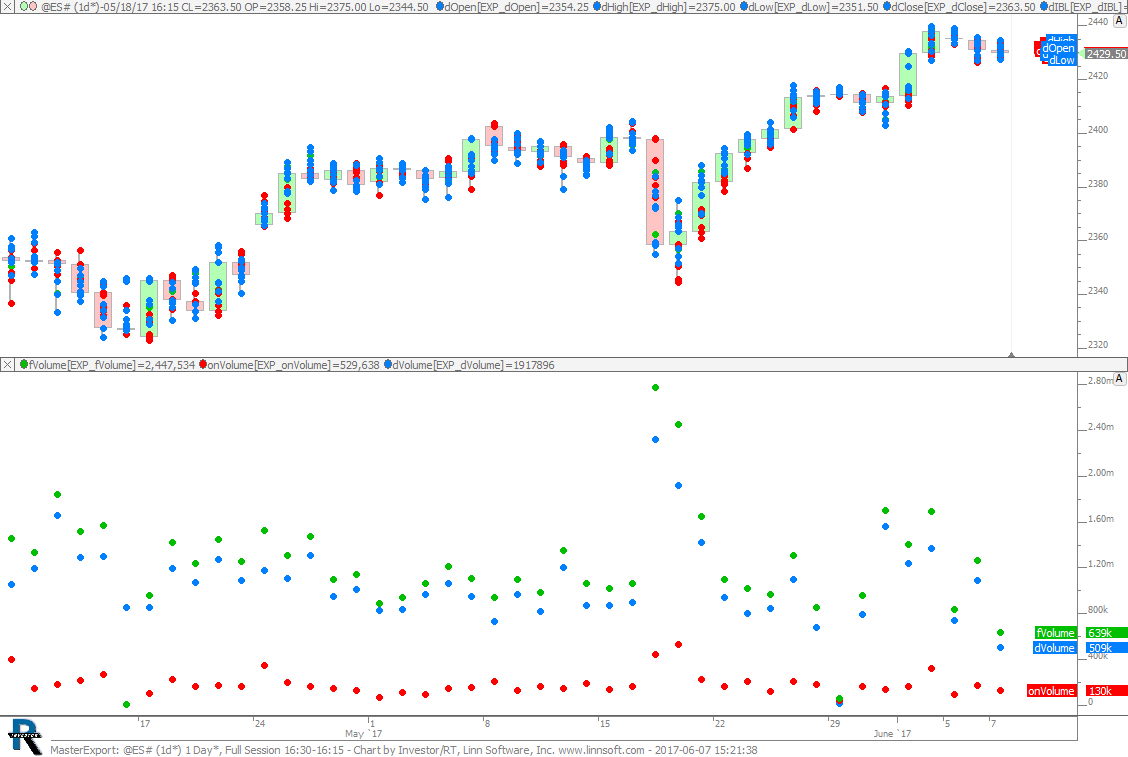 |
MasterExport (@ES#) cpayne [totalcount]
7 years 10 months ago
Master Export of Day, Overnight, Full Prices. This chart was uploaded by Investor/RT 12.7.5 showing symbol: @ES#. |
View |
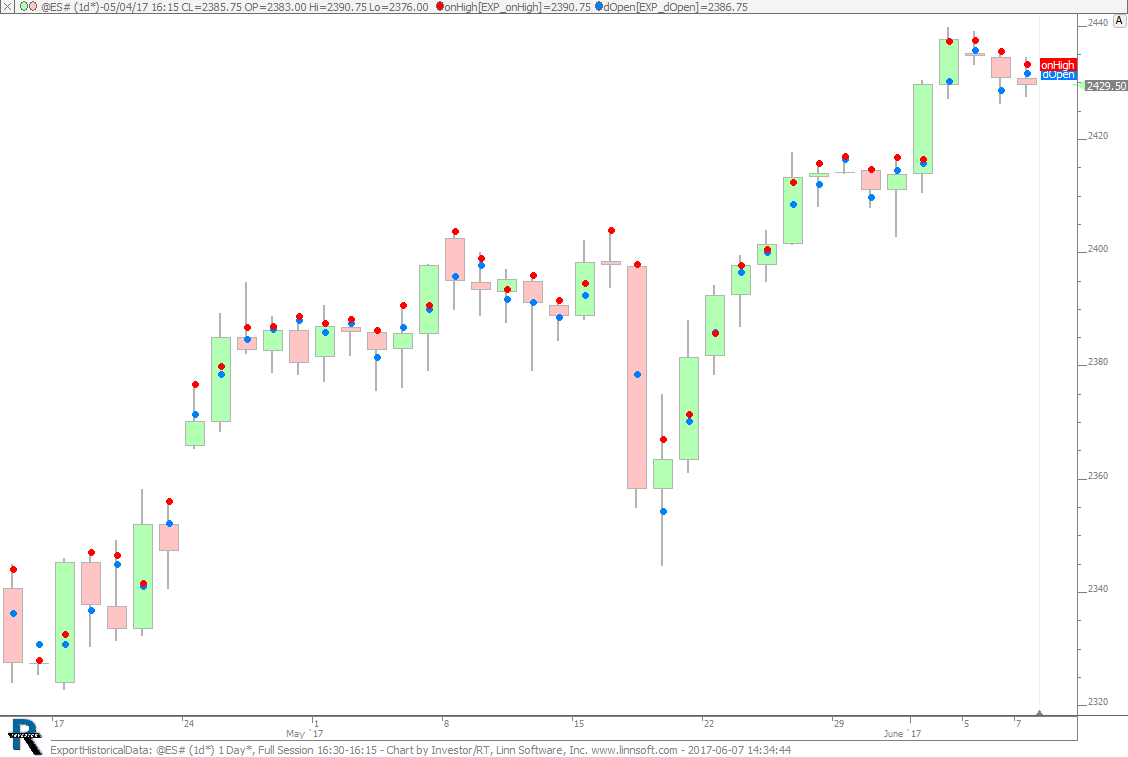 |
ExportHistoricalData (@ES#) cpayne [totalcount]
7 years 10 months ago
Export All Price Data. This chart was uploaded by Investor/RT 12.7.5 showing symbol: @ES#. |
View |
 |
FT71 ExportData cpayne [totalcount]
7 years 10 months ago
Export Data Quotepage used in FuturesTrader71 Webinar on June 6, 2017. This chart was uploaded by Investor/RT 12.7.5. |
View |
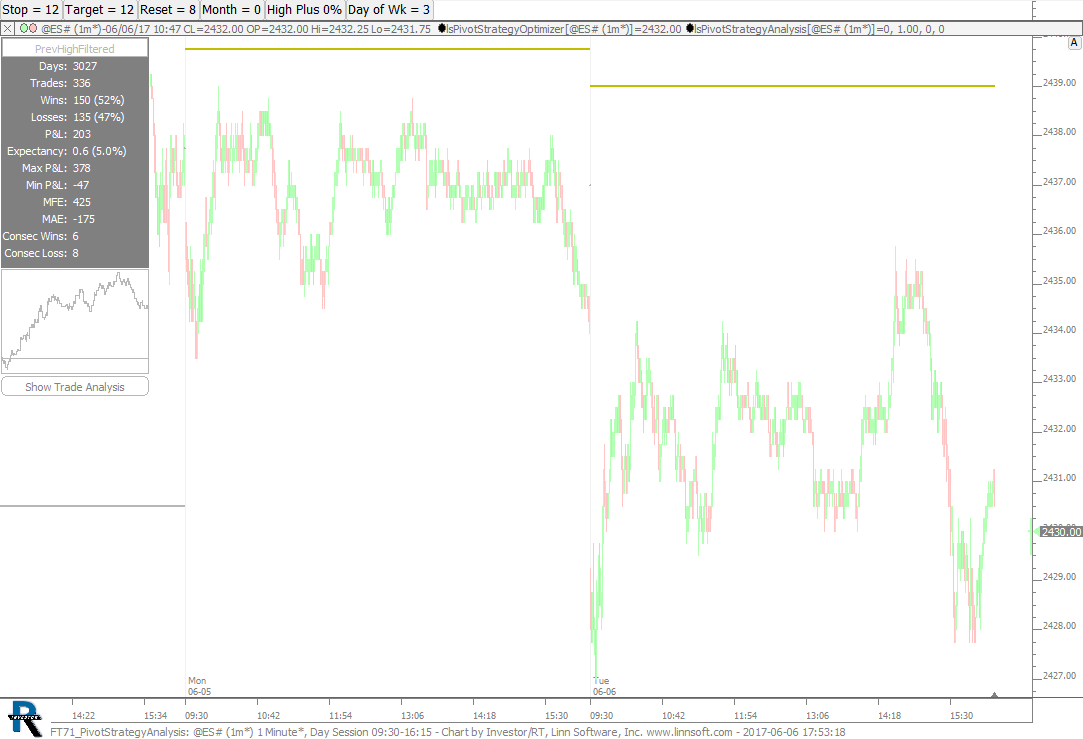 |
FT71 PivotStrategyAnalysis (@ES#) cpayne [totalcount]
7 years 10 months ago
PivotStrategyAnalysis and PivotStrategyOptimizer chart used in FuturesTrader71 Webinar on June 6, 2017. This chart was uploaded by Investor/RT 12.7.5 showing symbol: @ES#. |
View |