 |
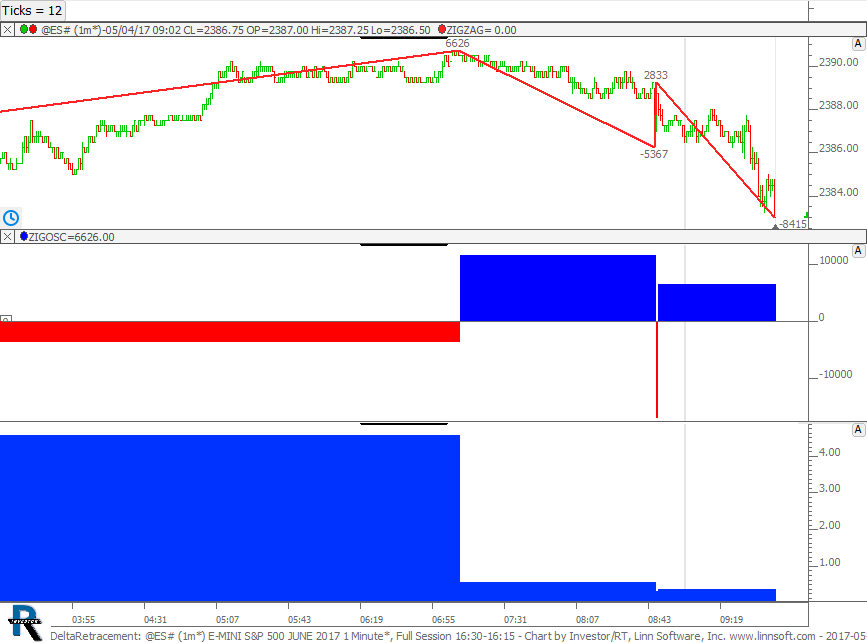
DeltaRetracement (@ES#) cpayne [totalcount]
7 years 11 months ago
Delta Retracement. This chart was uploaded by Investor/RT 12.7.2 showing symbol: @ES#. |
View |
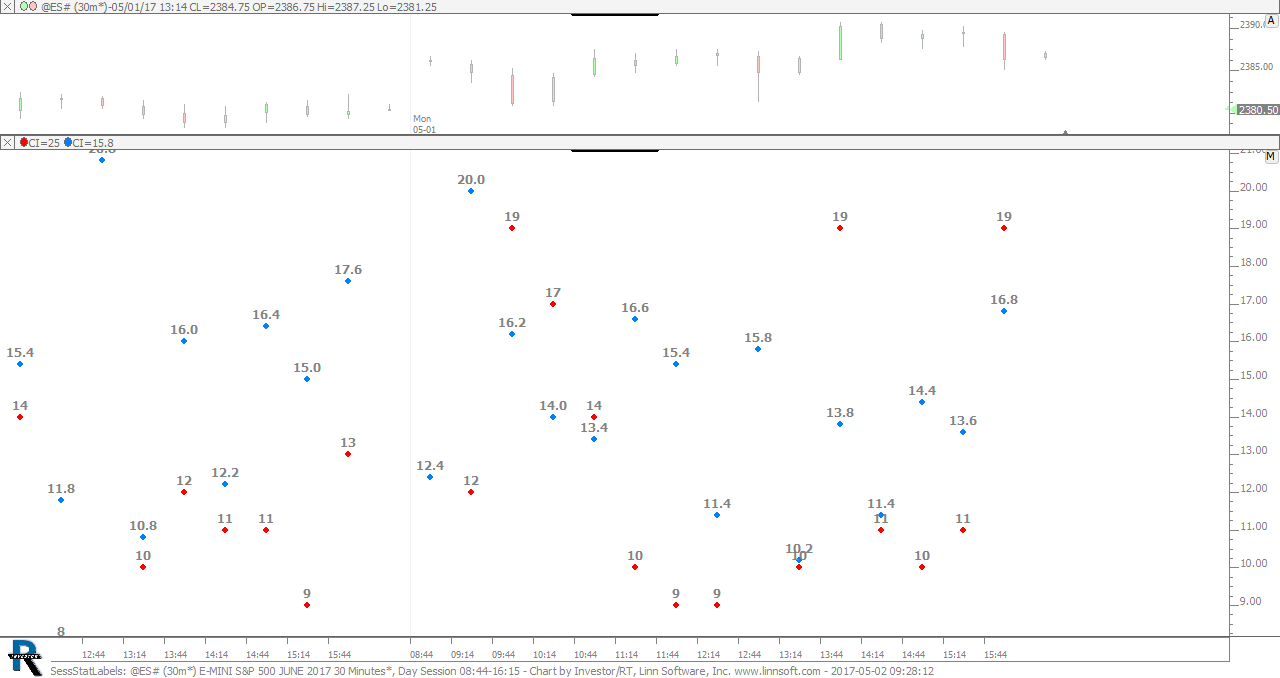 |
SessStatLabels (@ES#) cpayne [totalcount]
7 years 11 months ago
Average Range at Time of Day - Labeled with Text. This chart was uploaded by Investor/RT 12.7.2 showing symbol: @ES#. |
View |
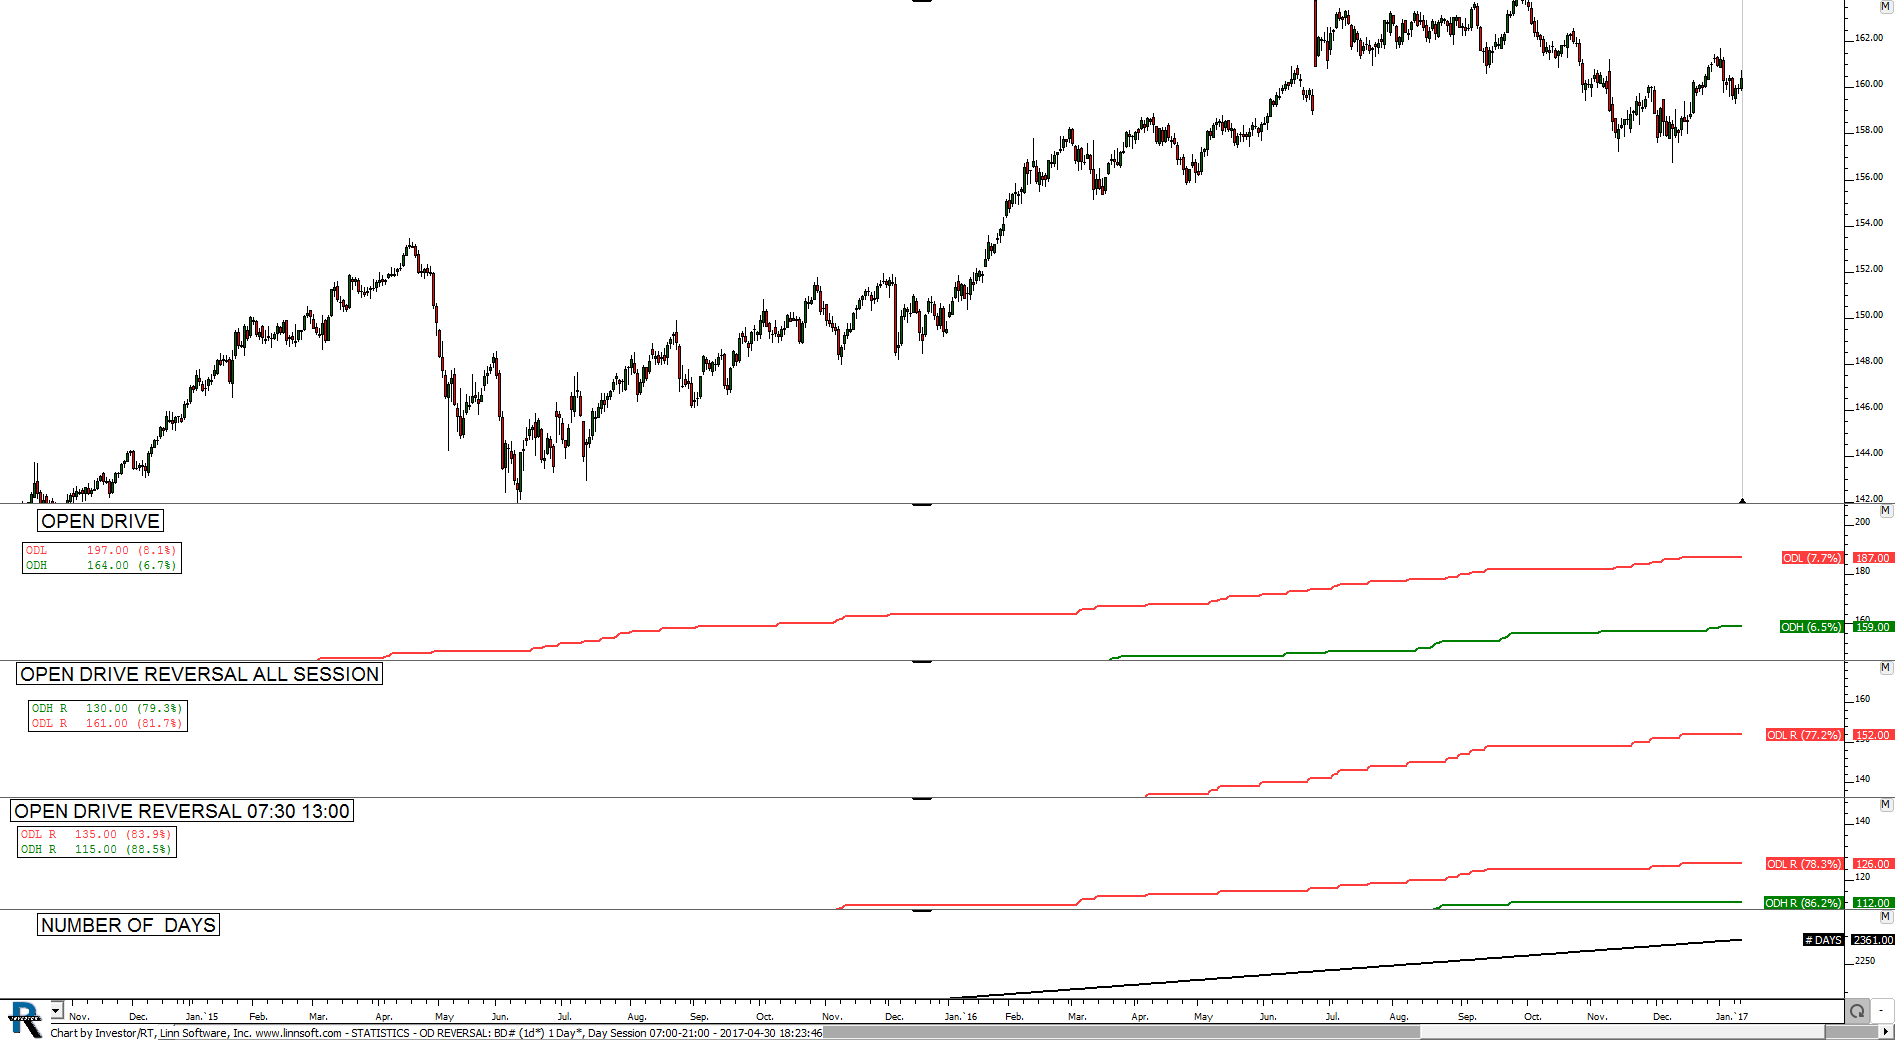 |
STATISTICS OD REVERSAL (BD#) bbtrading [totalcount]
7 years 11 months ago
Bund Open Drive Reversal Stats. This chart was uploaded by Investor/RT 12.7.2 showing symbol: BD#. |
View |
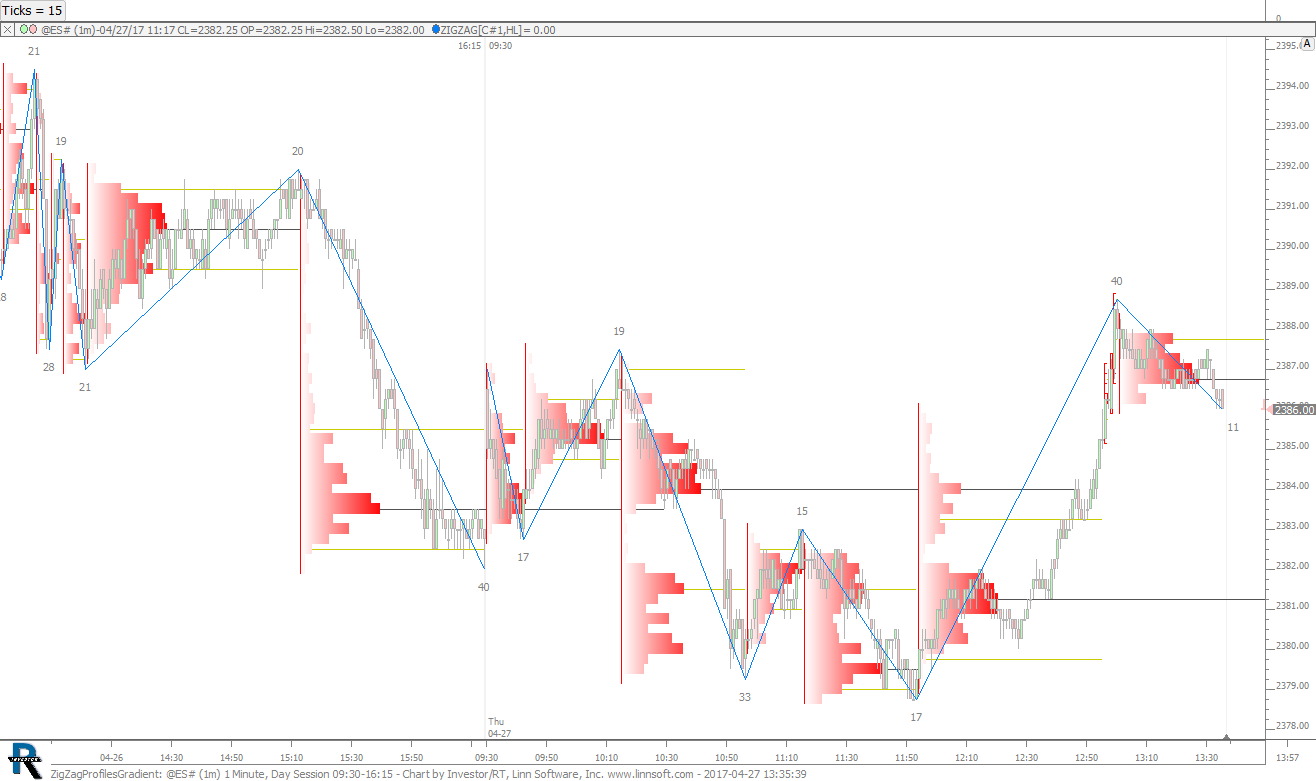 |
ZigZagProfilesGradient (@ES#) cpayne [totalcount]
7 years 11 months ago
Profiles of each move using the Zig Zag indicator to identify moves. This chart was uploaded by Investor/RT 12.7.2 showing symbol: @ES#. |
View |
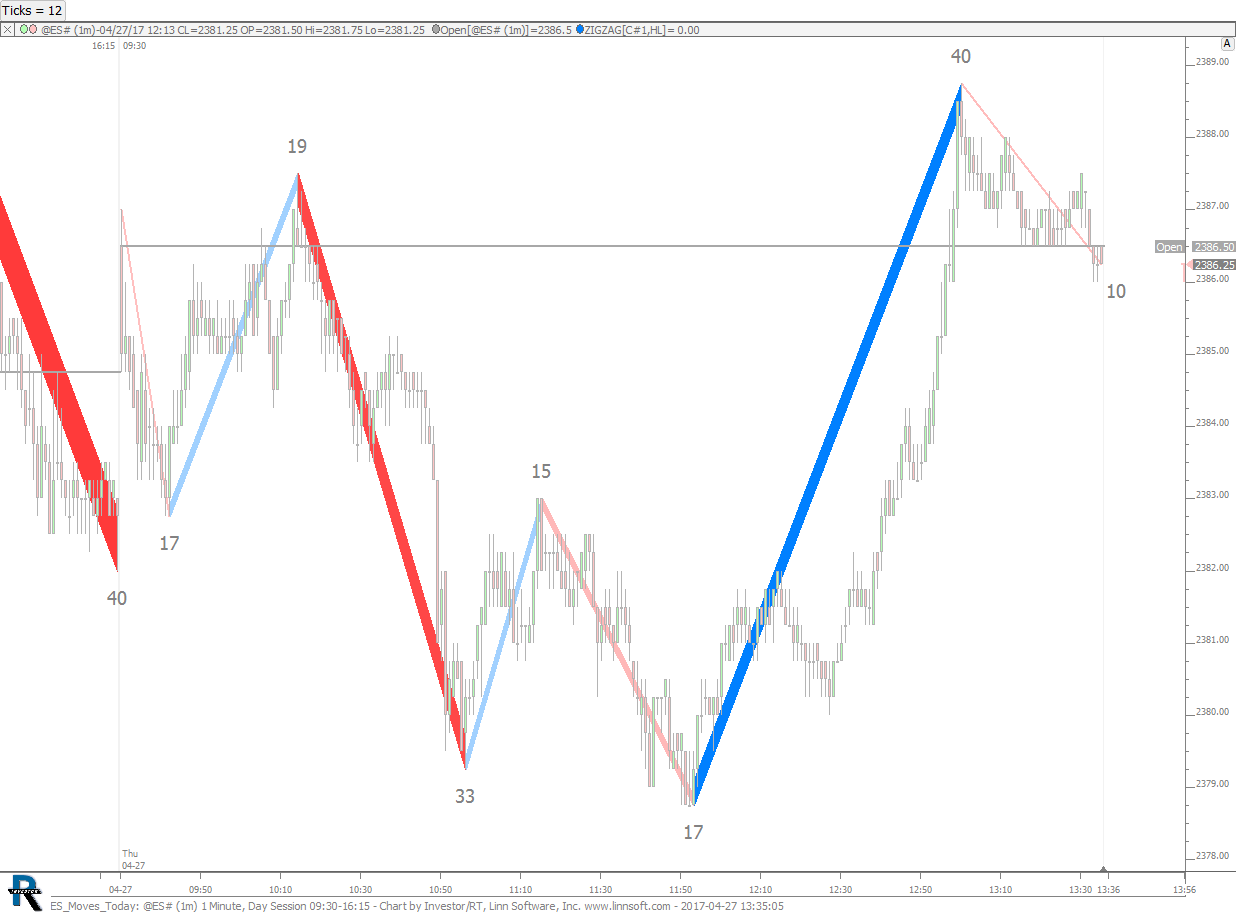 |
ES Moves Today (@ES#) cpayne [totalcount]
7 years 11 months ago
Chart identifies daily moves with width relative to volume of move and color relative to delta of move. This chart was uploaded by Investor/RT 12.7.2 showing symbol: @ES#. |
View |
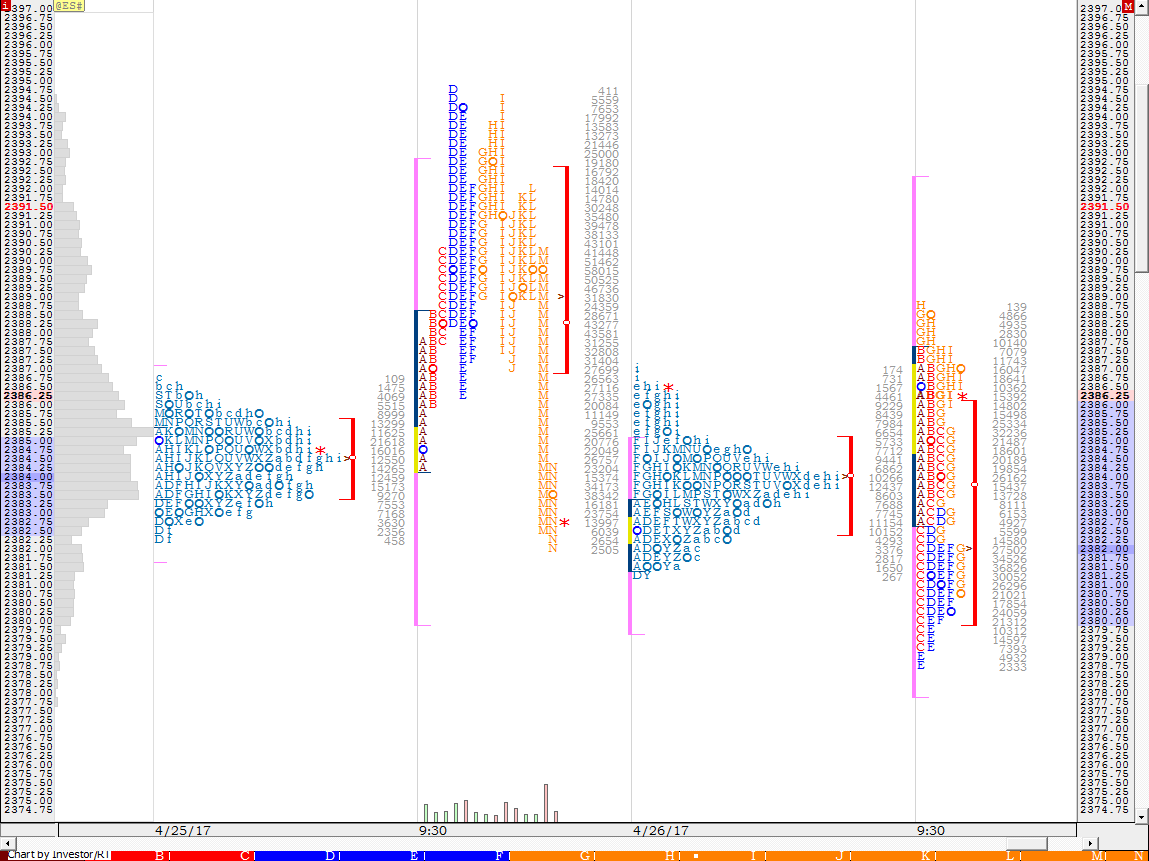 |
TPO Profile Chart (@ES#) cpayne [totalcount]
7 years 11 months ago
TPO Profile Chart that splits overnight and day session and custom color for each bracket during day session. |
View |
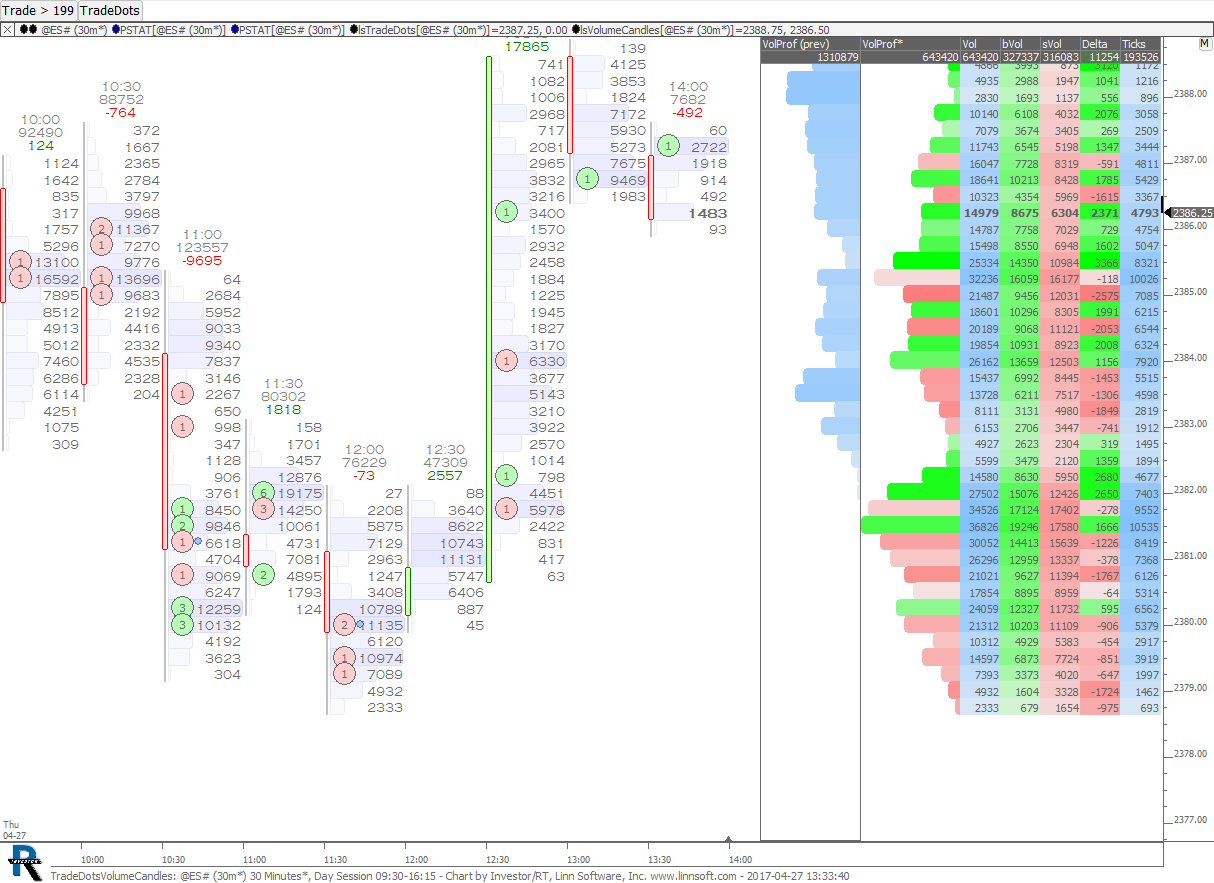 |
TradeDotsVolumeCandles (@ES#) cpayne [totalcount]
7 years 11 months ago
Trade Dots Volume Candles. This chart was uploaded by Investor/RT 12.6.6 showing symbol: @ES#. |
View |
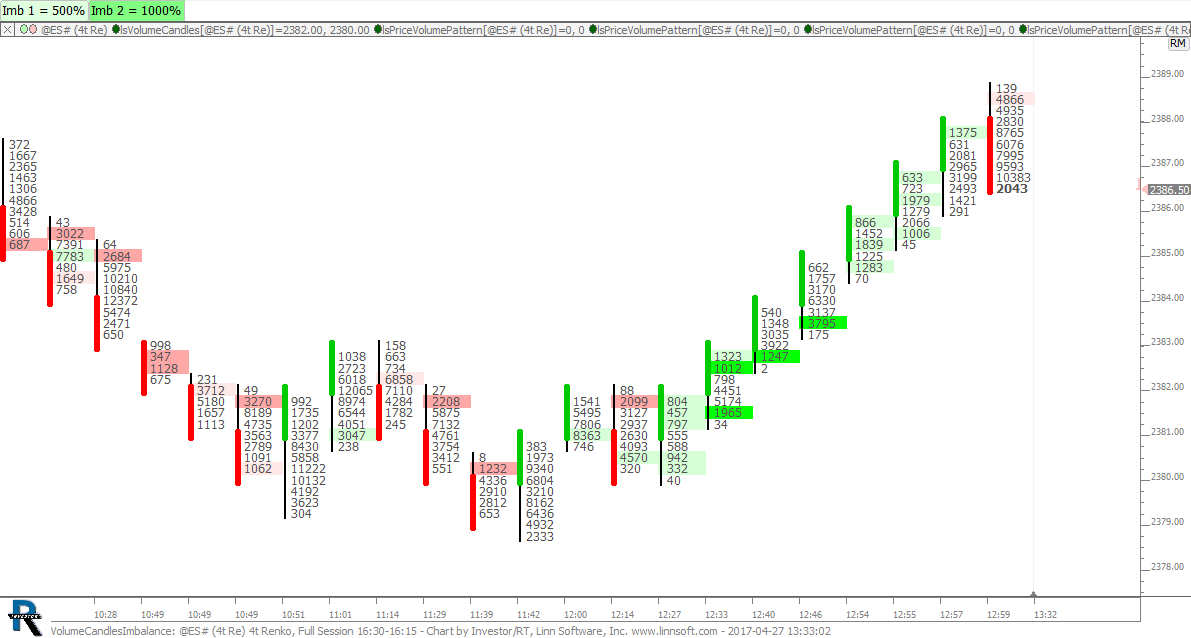 |
VolumeCandlesImbalance (@ES#) cpayne [totalcount]
7 years 11 months ago
Volume Candles with Extreme Imbalance (Controlled by Button at Top). This chart was uploaded by Investor/RT 12.7.1 showing symbol: @ES#. |
View |
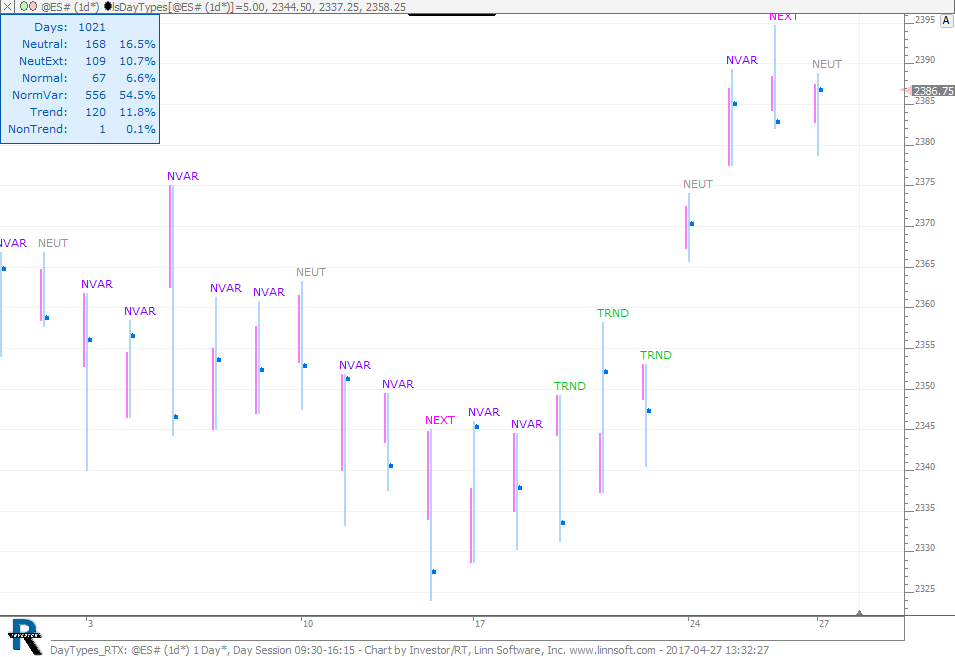 |
DayTypes RTX (@ES#) cpayne [totalcount]
7 years 11 months ago
Day Types - Neutral Extreme, Normal Variation, Trend. This chart was uploaded by Investor/RT 12.7.2 showing symbol: @ES#. |
View |
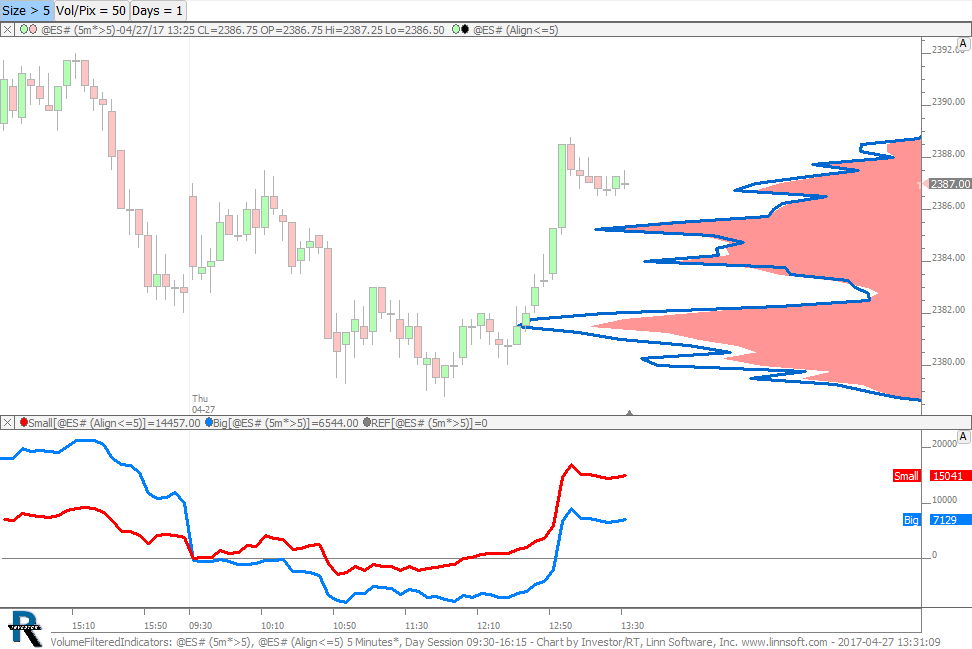 |
VolumeFilteredIndicators (@ES#) cpayne [totalcount]
7 years 11 months ago
Volume Filtered Profiles and Cumulative Delta. This chart was uploaded by Investor/RT 12.7.2 showing symbol: @ES#. |
View |
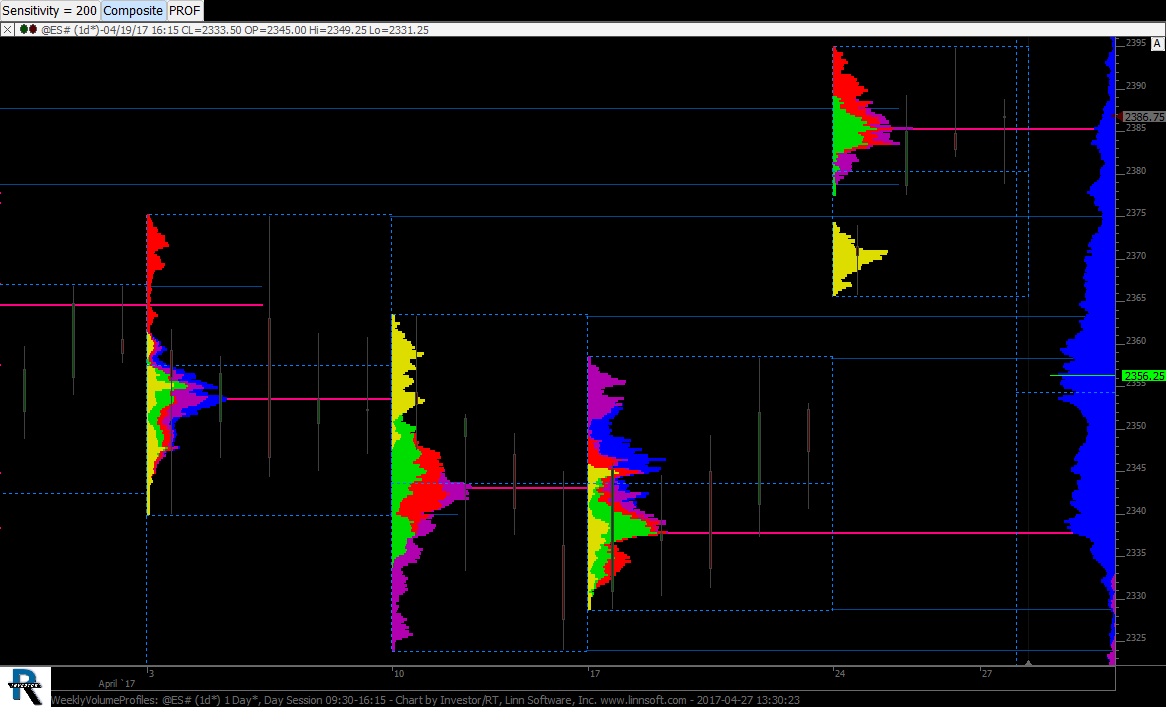 |
WeeklyVolumeProfiles (@ES#) cpayne [totalcount]
7 years 11 months ago
Weekly Profiles with each day different color - composite profile on right. This chart was uploaded by Investor/RT 12.7.2 showing symbol: @ES#. |
View |
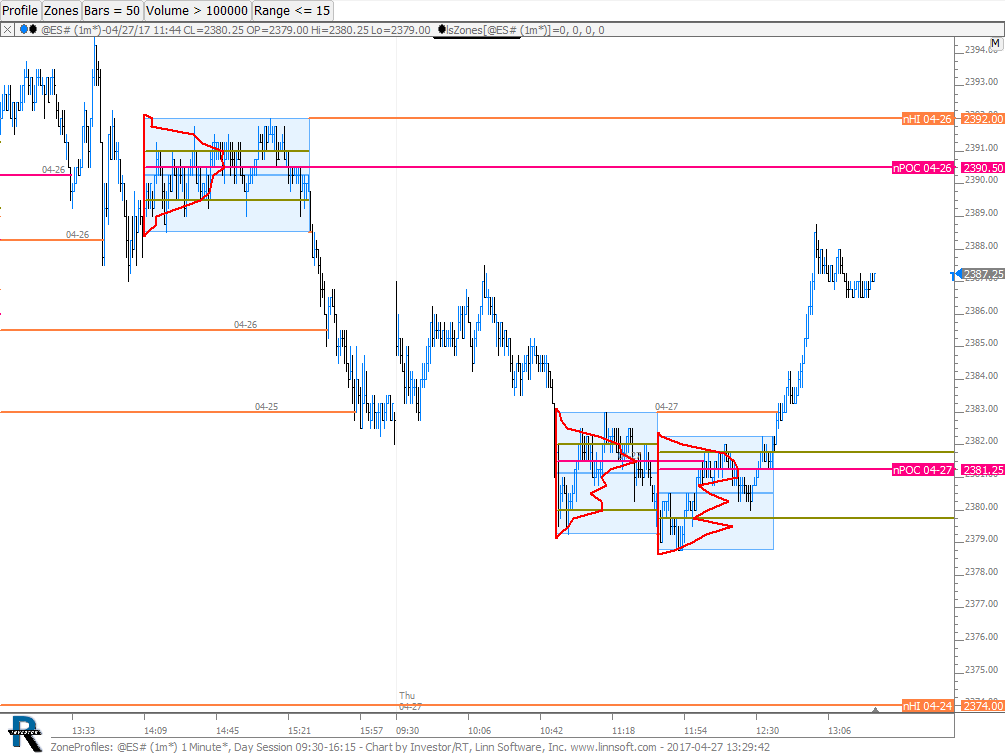 |
ZoneProfiles (@ES#) cpayne [totalcount]
7 years 11 months ago
Zones auto-idenfies areas of consolidation and Profile Indicator profiles these areas. This chart was uploaded by Investor/RT 12.7.2 showing symbol: @ES#. |
View |
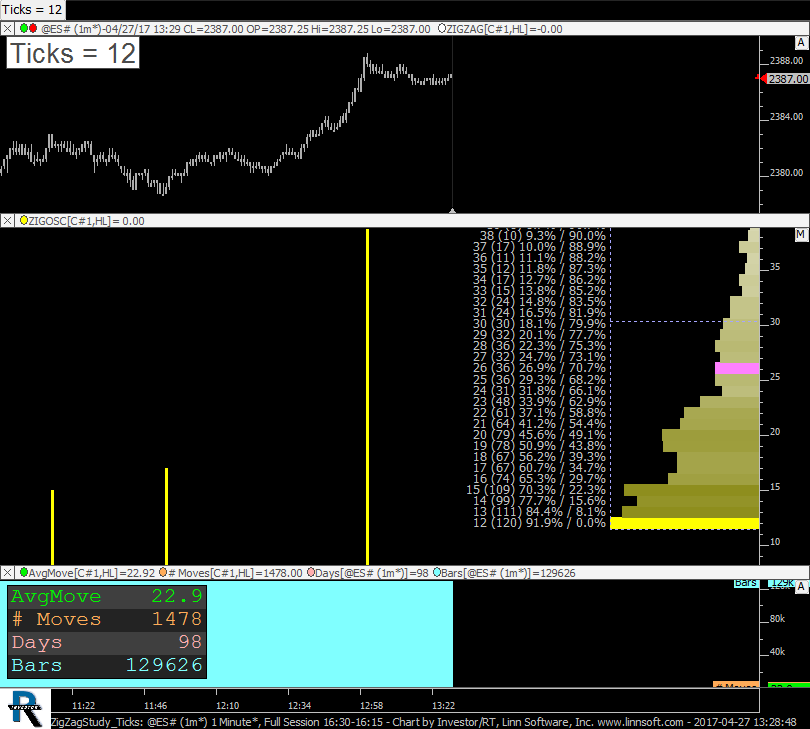 |
ZigZagStudy Ticks (@ES#) cpayne [totalcount]
7 years 11 months ago
Average Rotation Size, Number of Moves. This chart was uploaded by Investor/RT 12.7.1 showing symbol: @ES#. |
View |
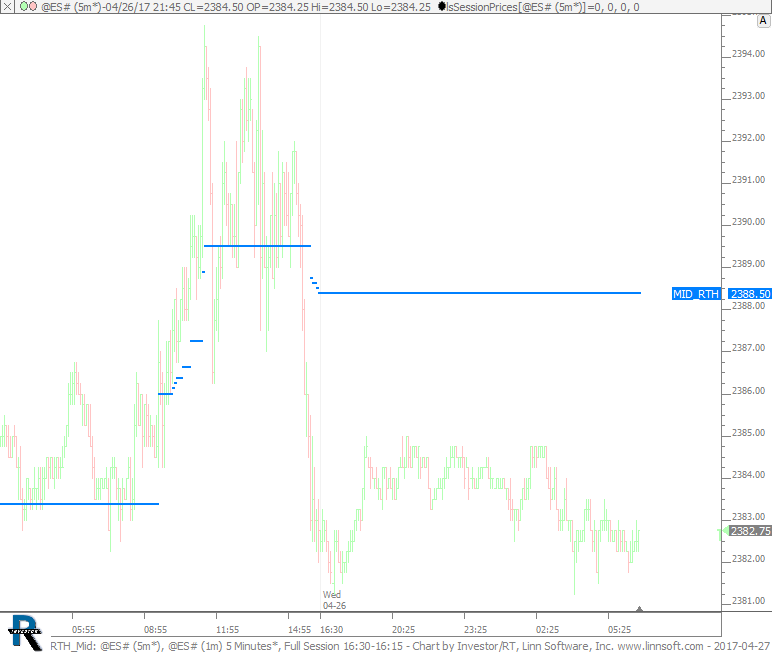 |
RTH Mid (@ES#) cpayne [totalcount]
7 years 12 months ago
SessionPrices - RTH Mid. This chart was uploaded by Investor/RT 12.7.2 showing symbol: @ES#. |
View |
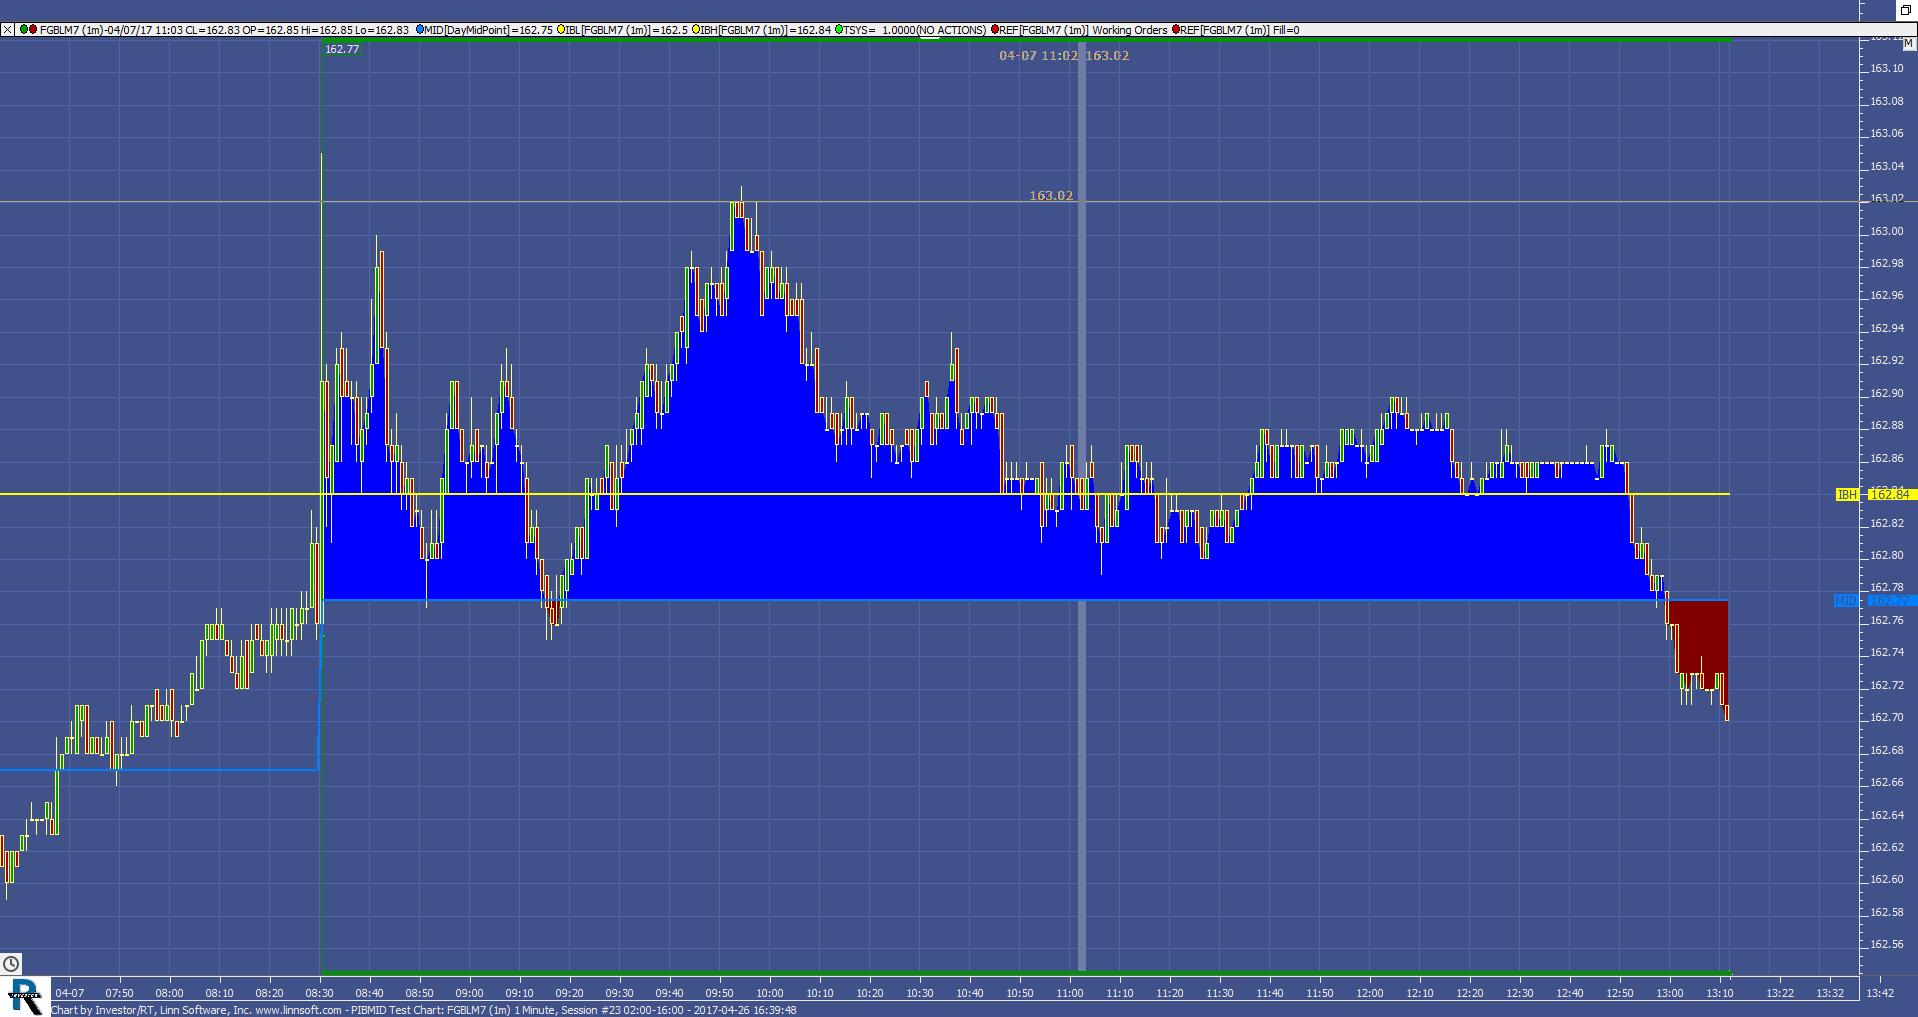 |
PIBMID Test Chart (FGBLM7) Food4Monkeys [totalcount]
7 years 12 months ago
Mids. This chart was uploaded by Investor/RT 12.7.2 showing symbol: FGBLM7. |
View |
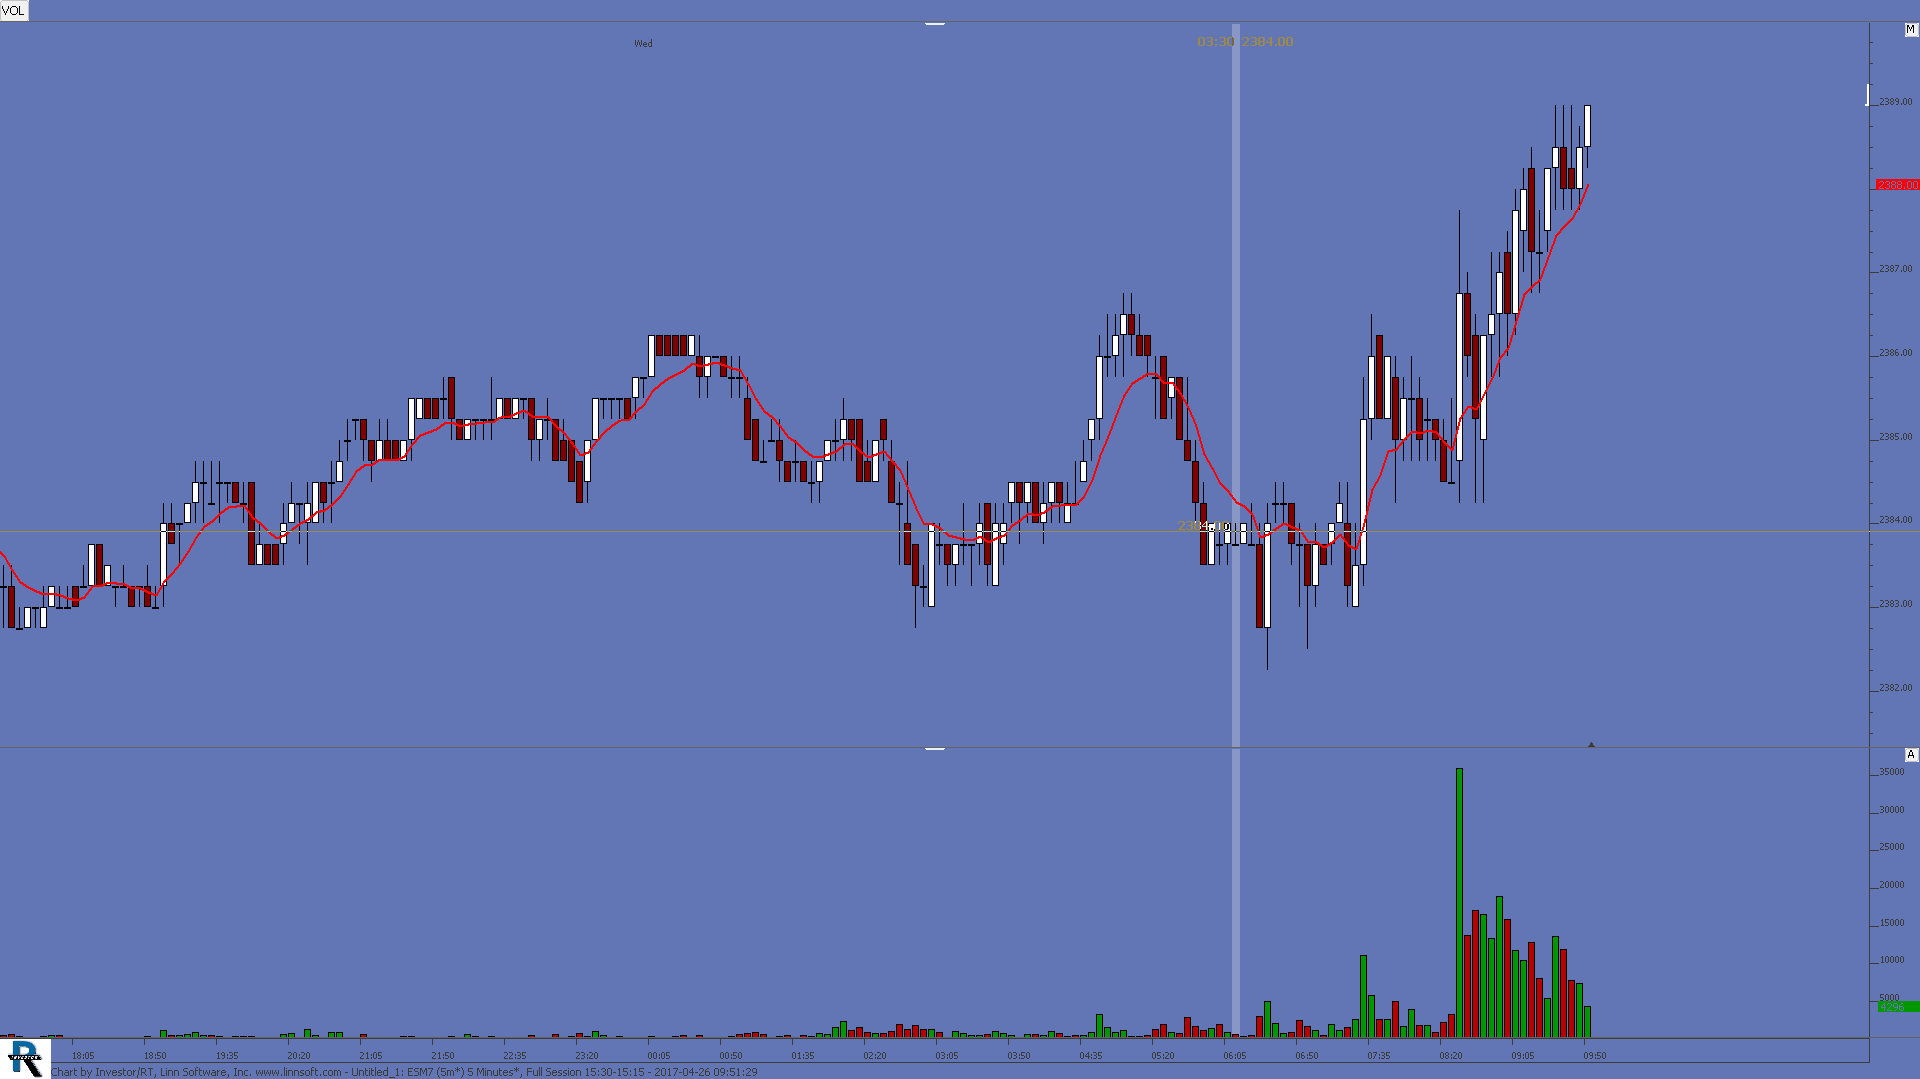 |
Untitled (ESM7) joe.uelk [totalcount]
7 years 12 months ago
This chart was uploaded by Investor/RT 12.7.2 showing symbol: ESM7. |
View |
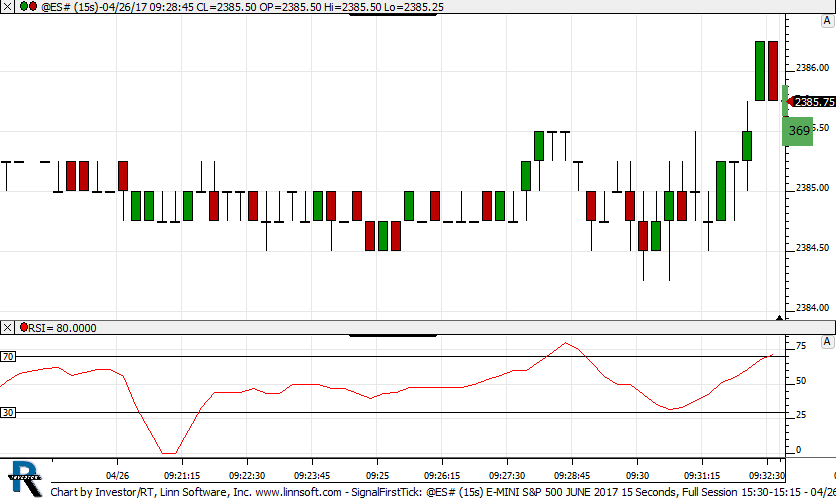 |
SignalFirstTick (@ES#) cpayne [totalcount]
7 years 12 months ago
Signal First Tick of each Bar. This chart was uploaded by Investor/RT 12.6.9 showing symbol: @ES#. |
View |
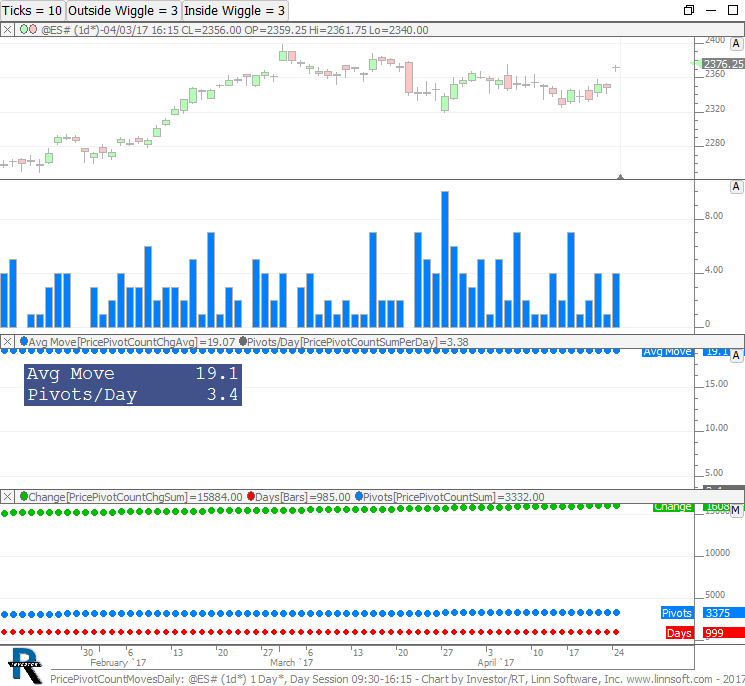 |
PricePivotCountMovesDaily (@ES#) cpayne [totalcount]
7 years 12 months ago
Avg move after pivoting off key price levels. Number of pivots off key price level per day. This chart was uploaded by Investor/RT 12.7.2 showing symbol: @ES#. |
View |
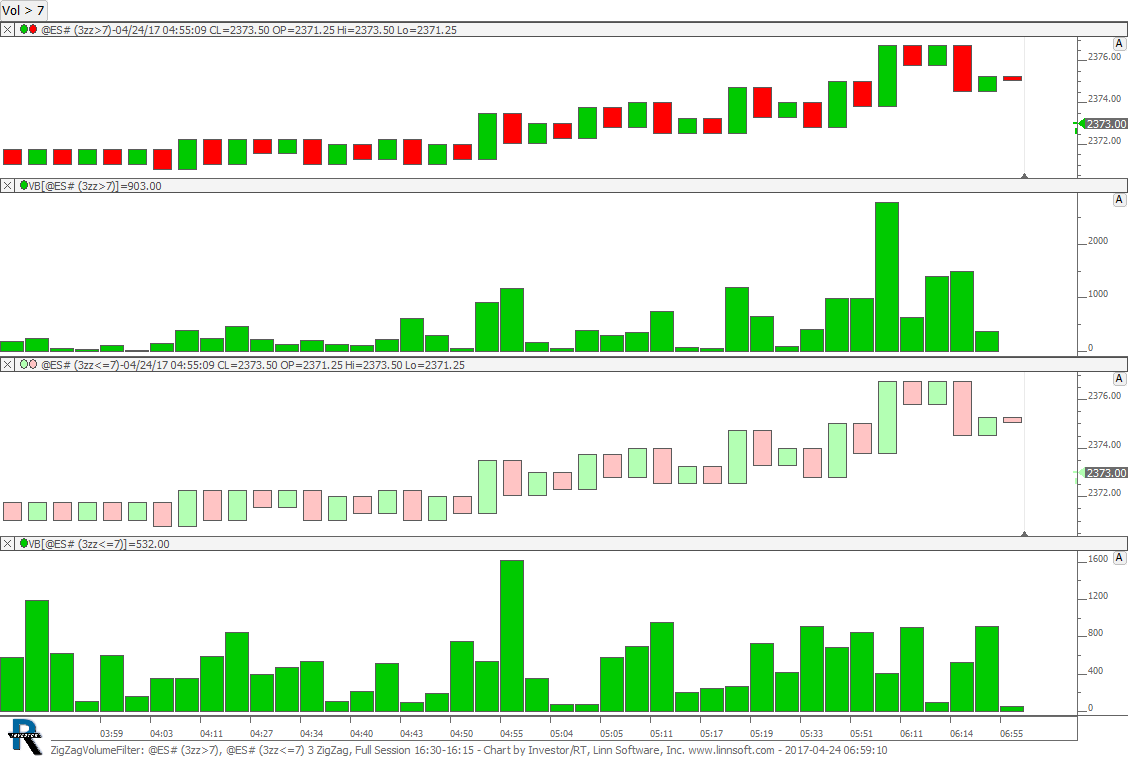 |
ZigZagVolumeFilter (@ES#) cpayne [totalcount]
7 years 12 months ago
Zig Zag Periodicity with Volume Filter. This chart was uploaded by Investor/RT 12.7.1 showing symbol: @ES#. |
View |
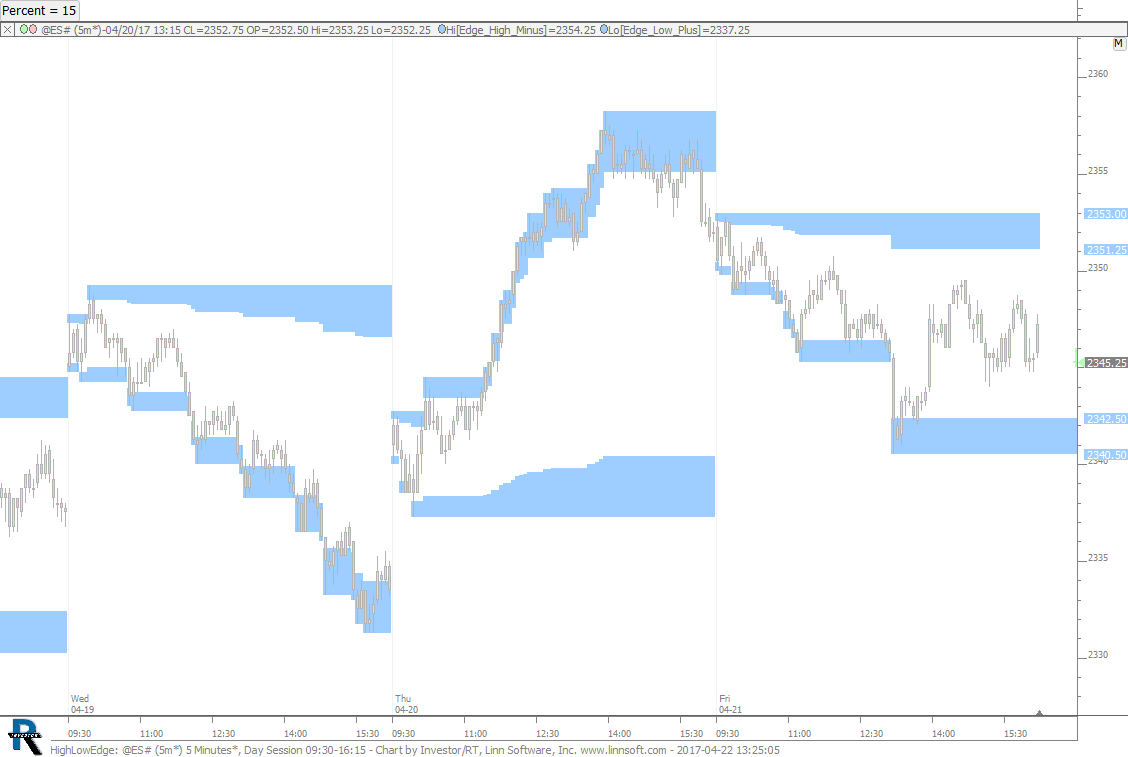 |
HighLowEdge (@ES#) cpayne [totalcount]
7 years 12 months ago
High Low 15% Edge. This chart was uploaded by Investor/RT 12.7.1 showing symbol: @ES#. |
View |
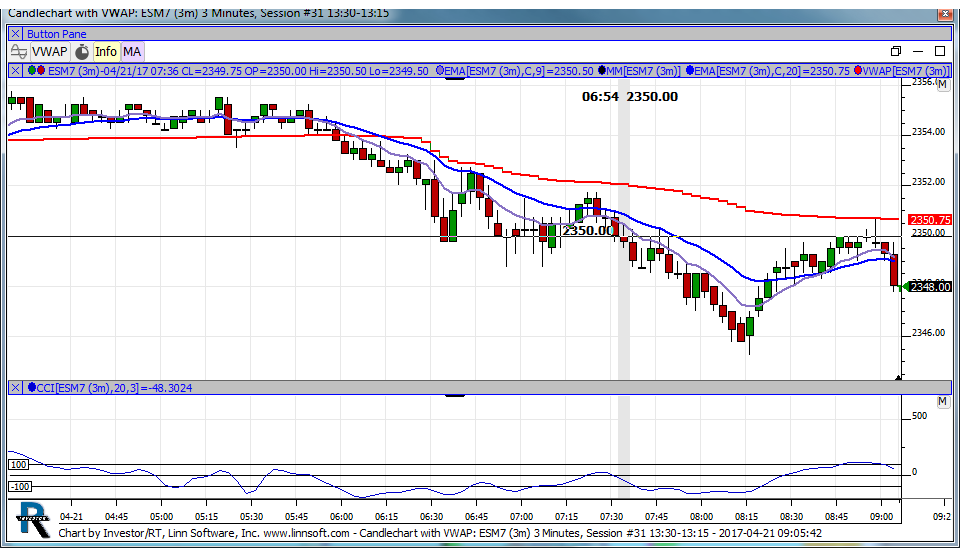 |
Candlechart with VWAP (ESM7) ouci333 [totalcount]
8 years 20 hours ago
ES_F MARKET PROFILE RTH. This chart was uploaded by Investor/RT 12.7.1 showing symbol: ESM7. |
View |
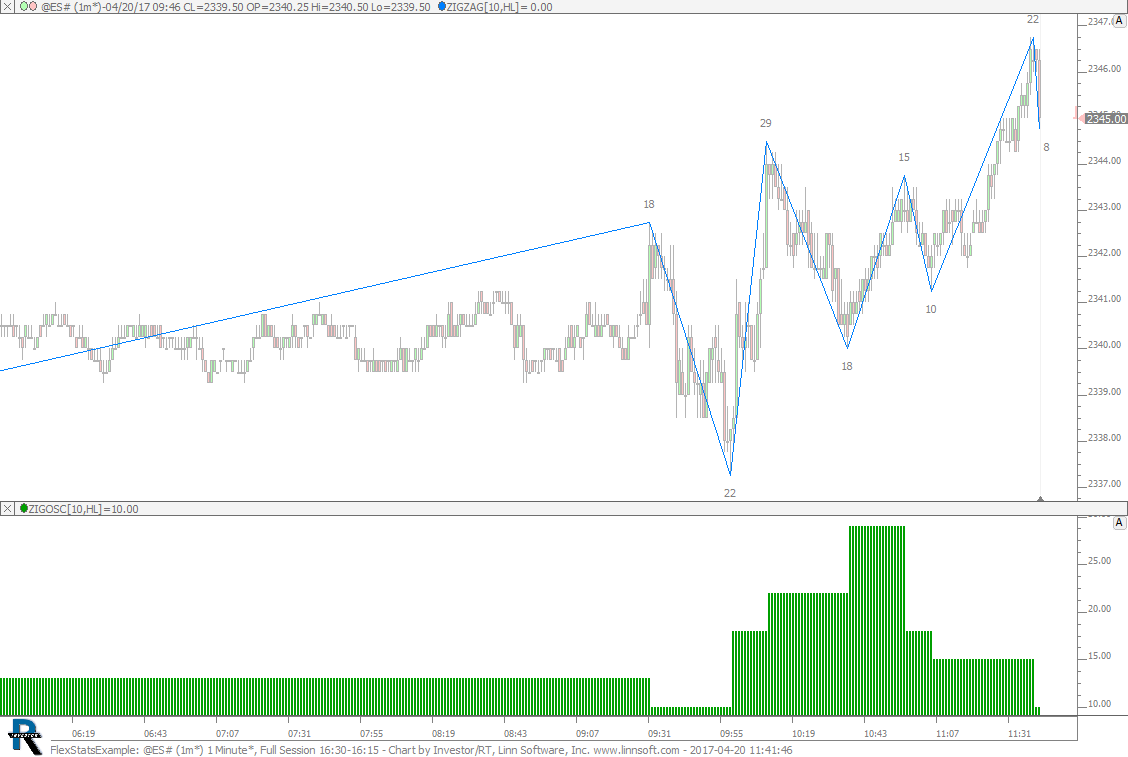 |
FlexStatsExample (@ES#) cpayne [totalcount]
8 years 1 day ago
This chart was uploaded by Investor/RT 12.7.1 showing symbol: @ES#. |
View |
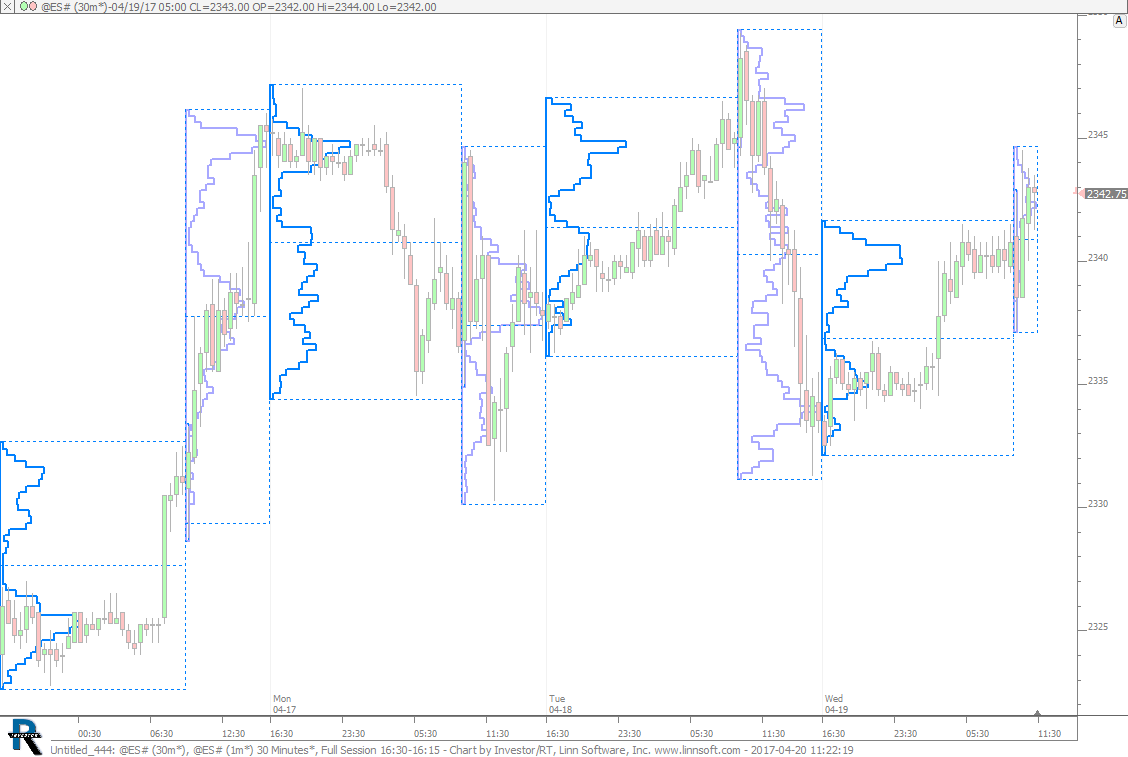 |
Untitled 444 (@ES#) cpayne [totalcount]
8 years 1 day ago
This chart was uploaded by Investor/RT 12.7.1 showing symbol: @ES#. |
View |
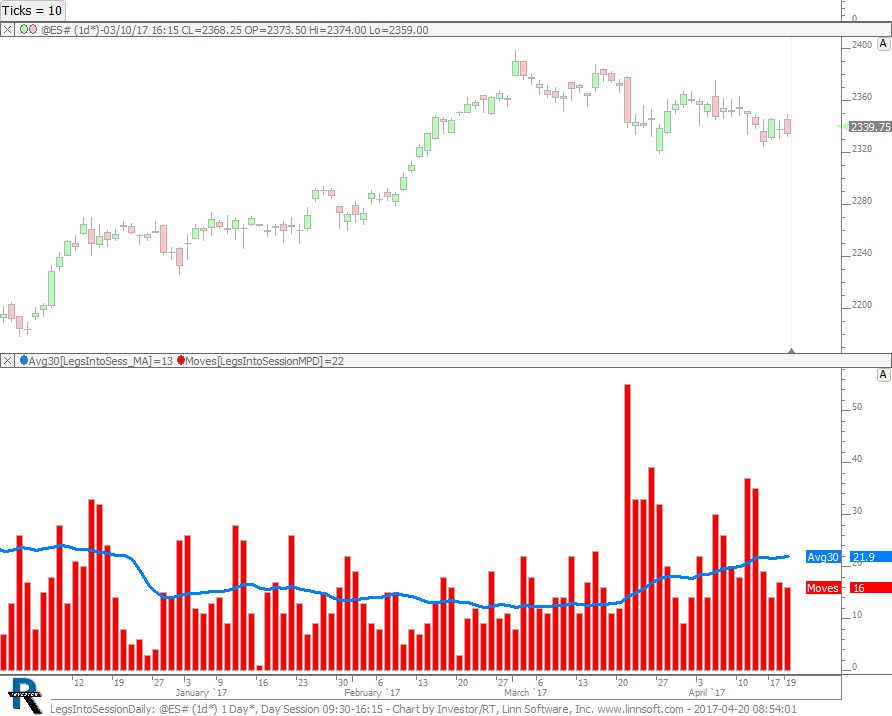 |
LegsIntoSessionDaily (@ES#) cpayne [totalcount]
8 years 2 days ago
Legs Into Session - Daily with Average. This chart was uploaded by Investor/RT 12.7.1 showing symbol: @ES#. |
View |
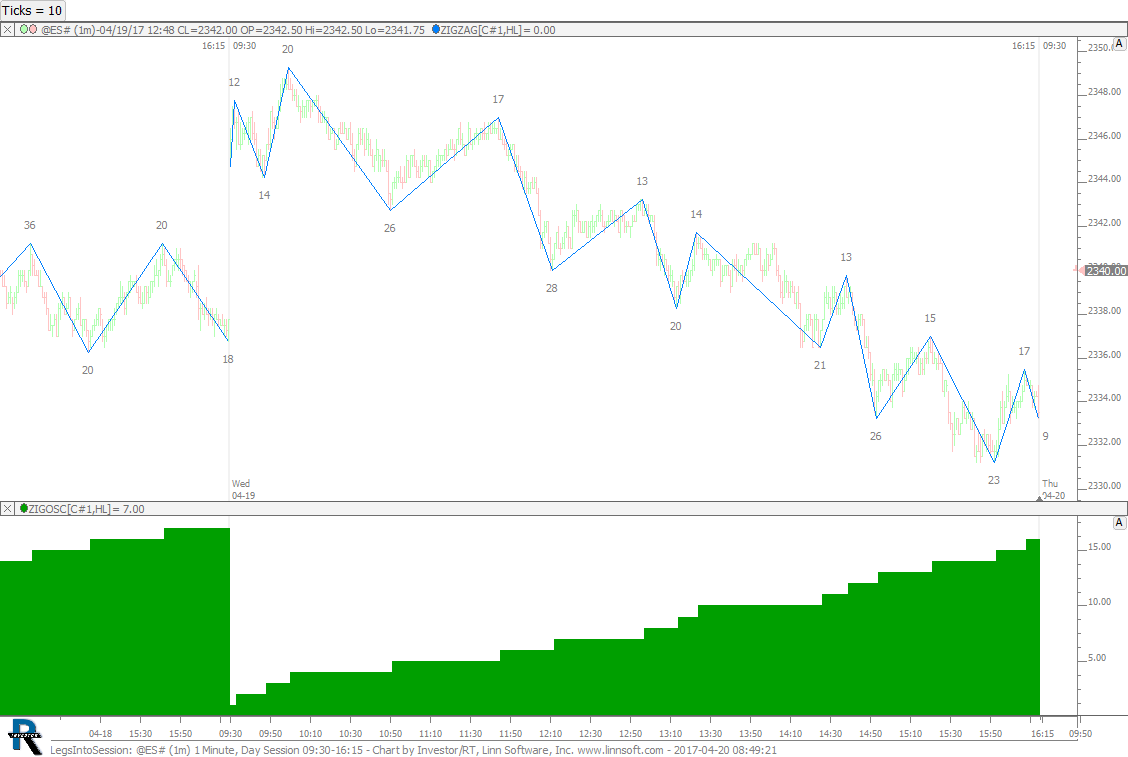 |
LegsIntoSession (@ES#) cpayne [totalcount]
8 years 2 days ago
Legs Into Session - Intraday. This chart was uploaded by Investor/RT 12.7.1 showing symbol: @ES#. |
View |